Managing cloud infrastructure efficiently has evolved from a simple budgeting task into a complex engineering challenge. As enterprise workloads scale, traditional cleanup mechanisms, like manually shutting down idle development environments or deleting orphaned snapshots, fail to provide long-term stability. Most AWS cost optimization programs follow a predictable trajectory: an initial savings spike of 15% to 20%, an organizational celebration, and then months of flatlining returns.
The variance between an optimized environment and a wasteful one is an execution gap. According to the Flexera 2026 State of the Cloud Report, estimated cloud waste across enterprises sits at 29%, with over 85% of organizations citing cloud spend management as their primary operational hurdle. Furthermore, data from the AWS State of Cost Efficiency Report reveals a major systemic issue: while the majority of enterprises focus heavily on purchasing rate-discount commitments like Savings Plans, only 47.1% actively execute resource rightsizing.
Focusing on procurement over structural engineering leaves substantial savings entirely unrealized. To establish permanent financial efficiency, organizations must transition from temporary, surface-level cleanups to an engineering-first model. This blog post serves as the technical sequel to our previous discussion, “AWS Cost Optimization: Closing the Hidden Cloud Savings Gap,” where we identified why cosmetic fixes fall short. Below, we break down the five architectural pillars and the realistic execution sequence required to design cost-resilient AWS environments.
The Five Pillars of AWS Cloud Optimization
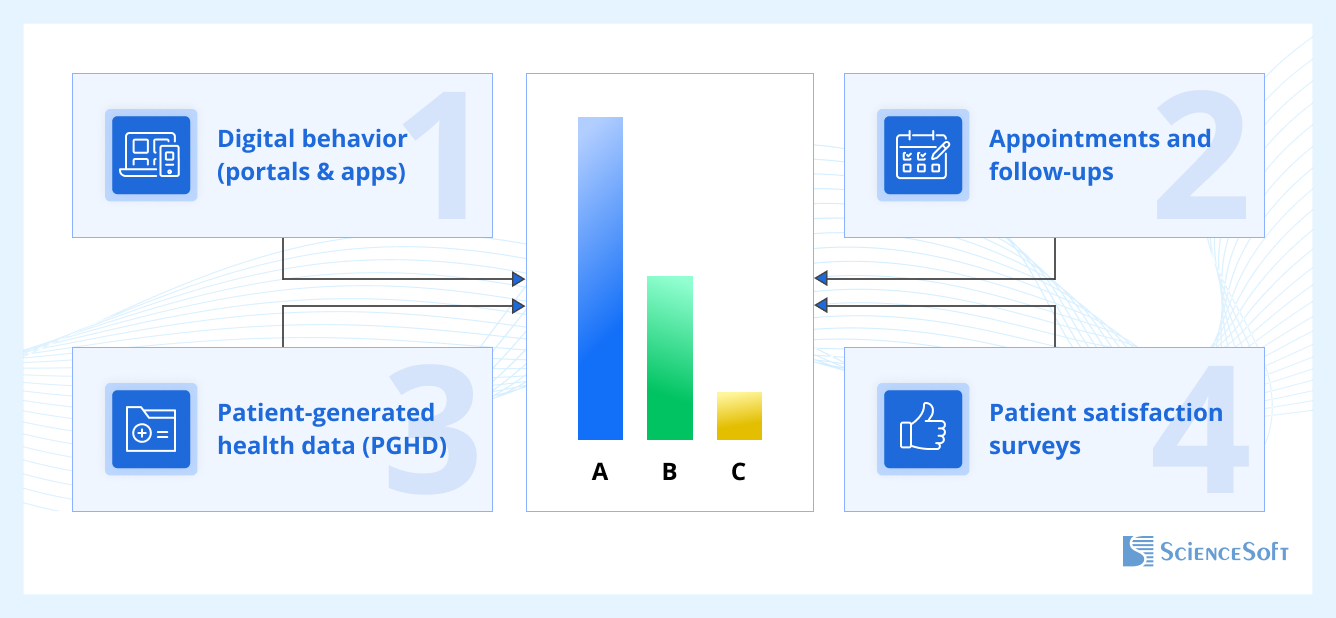
True cloud optimization requires balancing technical upside against actual implementation friction. As outlined conceptually in image (6).png, sustainable efficiency is achieved when core operational layers cross-pollinate directly with the pillars of the AWS Well-Architected Framework.
Pillar 1: Cost Optimization and Strategic Capacity Engineering
Financial efficiency is rooted in data-driven capacity planning rather than speculative purchasing.
- Precision Right-Sizing via AWS Compute Optimizer: Rather than relying on basic CPU metrics, we integrate deep memory utilization analytics. AWS performance data indicates that activating granular EC2 memory metrics correlates with an 8% to 30% percentage-point gain in realized savings per recommendation, yet it remains underutilized by over 80% of eligible customers.
- Commitment-Based Pricing Strategy: For predictable baseline workloads, we architect a dynamic mix of Reserved Instances (RIs) and Savings Plans. Enterprise environments that combine active rightsizing with commitments run roughly 60% of their instances on newer, more efficient hardware and improve their core efficiency metrics four times faster than peers relying on commitments alone.
- Spot Instances for Fault-Tolerant Workloads: For stateless applications, data-processing pipelines, and batch jobs, utilizing spare cloud capacity via Amazon EC2 Spot Instances slashes compute costs by up to 90% compared to standard On-Demand pricing.
Pillar 2: Compute Modernization and Architectural Efficiency
Compute typically represents roughly 70% of the financial upside in an infrastructure budget, making it the most impactful lever, though it requires incremental, deliberate project execution.
- Dynamic Auto Scaling: We build proactive target-tracking and predictive scaling policies that scale your footprint out or in based on real-time operational demand, eliminating expenditures on idle compute.
- Serverless Execution with AWS Lambda: For event-driven microservices or highly variable workloads, shifting to serverless execution removes the overhead of maintaining underlying operating systems and ensures you pay strictly for execution time down to the millisecond.
- AWS Graviton (ARM) Migration: Moving traditional x86 workloads to custom-designed AWS Graviton processors delivers up to 40% better price-performance. However, the real constraint here is engineering capacity rather than the math. Migrating a production workload requires allocating platform team capacity to refactor, test, and validate the testing surface area before shifting workloads to ARM-based silicon.
Pillar 3: Intelligent Storage and Lifecycle Mechanics
Storage generally accounts for 15% to 20% of the optimization upside. It often faces fewer structural obstacles because most of the work is policy-based rather than architectural.
- Automated Tiering with S3 Intelligent-Tiering: Because data access habits evolve unpredictably, we implement S3 Intelligent-Tiering. Objects automatically transition across performance and cost-optimized access tiers based on real-time usage, introducing zero operational overhead or data retrieval fees.
- EBS Upgrades (gp2 to gp3): We systematically modernize block storage by moving Amazon Elastic Block Store (EBS) volumes from gp2 to gp3. AWS storage benchmarks confirm that gp3 delivers an immediate 20% savings per GB-month while completely decoupling provisioned IOPS and throughput from volume size. This is a low-friction, high-return transition.
- Automated Archive Lifecycle Policies: Cold data should never sit on expensive hot storage tiers. By implementing programmatic lifecycle rules, aging datasets are systematically offloaded to Amazon S3 Glacier Flexible or Deep Archive for ultra-low-cost, secure preservation.
Pillar 4: Network Topology and Data Transfer Engineering
Data transfer fees, NAT Gateway sprawl, and inefficient routing represent the remainder of the optimization surface area. Though often dismissed as a rounding error, network costs compound heavily in enterprise environments with high egress or cross-region replication.
- Amazon CloudFront CDN: By caching assets globally at edge locations, we drastically reduce origin data transfer out (DTO) expenses while accelerating application delivery speeds for global users.
- VPC Endpoints and AWS PrivateLink: To eliminate heavy NAT Gateway processing charges, we architect VPC Endpoints. This keeps internal data traffic directed to core services like Amazon S3 or DynamoDB entirely within the private AWS backbone network instead of routing it out across the public internet.
- AWS Transit Gateway Centralization: For complex, multi-account environments, we consolidate hub-and-spoke networking topologies using Transit Gateway. This cleans up redundant routing paths, eliminates disparate gateway costs, and simplifies multi-account architecture at scale.
Pillar 5: Continuous Governance, Security, and Guardrails
An optimized environment is only as durable as the governance model tracking it. Without guardrails, infrastructure inevitably drifts back to waste within 18 months due to small, compounding anomalies, such as oversized staging environments left running over weekends.
- AWS Trusted Advisor and AWS Config: We deploy automated monitoring tools that continuously scan cloud infrastructure to flag non-compliant resource allocations, security misconfigurations, and hidden operational cost risks.
- IAM Least-Privilege and Service Control Policies (SCPs): True optimization requires structural constraint. By creating robust organizational guardrails via SCPs, we prevent development teams from inadvertently spinning up unapproved, high-cost instance classes or unauthorized services.
- AWS Cost Anomaly Detection and Budgets: Rather than waiting for the end-of-month invoice to review metrics, we embed machine learning-driven anomaly monitors. These sound the alarm the moment an unusual spending pattern occurs, stopping runaway bills before they impact the bottom line.
Moving Toward a Well-Architected Infrastructure
Achieving long-term cloud efficiency is not about executing an isolated cost-cutting project. True cost resilience occurs when optimization is deeply embedded into the baseline of the AWS Well-Architected Framework.
By modernizing compute, applying intelligent policies to storage, optimizing network paths, and implementing automated security guardrails, organizations can break out of the cyclical pattern of short-term fixes. Moving beyond the low-hanging fruit requires shifting ownership away from purely financial or compliance metrics and into the engineering workflow. When cost awareness becomes an intrinsic part of how architectures are built and maintained, the cloud transitions from an unpredictable operational expense into a highly responsive, scalable engine for business growth.
Looking to turn these architectural strategies into real operational savings? BizAcuity specializes in analyzing structural cloud inefficiencies and designing scalable, high-performance environments. Get in touch with us to talk about building an infrastructure that scales with your growth.