How Prompt Tuning Improved GPT-5.5 in VS Code


July 6, 2026 by VS Code Team, @code

In our previous post, we introduced the VS Code coding harness, the layer that connects the model to tools, context, instructions, and the agent loop, giving the model the ability to perform coding tasks.

Each model responds to tool calls and instructions differently, and the harness can adapt to improve results. This post walks through a two-week experiment we ran in partnership with OpenAI to tune the GPT-5.5 system prompt in VS Code. The question was simple: if we nudge the agent to explore less and validate sooner, can it get faster and cheaper without getting worse? With OpenAI’s model expertise and our harness data, we tested two small prompt changes, measured them against a control on live traffic, and shipped the winner.

This matters more with usage-based billing in place. Token efficiency isn’t only an infrastructure metric: every token the agent spends wandering is a token you pay for and wait on. An agent that reaches a grounded edit sooner is both a better experience and a smaller bill.

The hypothesis: explore less, validate sooner

Following the launch of GPT-5.5, we looked at how the model spent tokens inside the VS Code agent harness, as part of the work described in Improving token efficiency in GitHub Copilot. Two patterns stood out: where the model spent tokens, and where it over-explored before acting. Agents can spend a lot of effort searching, rereading, and comparing nearby paths before making a useful edit.

That pointed to a single, testable idea: the agent should spend less effort wandering and more effort moving through a deliberate loop of evidence, action, and validation.

Diagram contrasting an agent that over-explores with many scattered search and read steps before its first edit, versus a Treatment B agent that moves through a deliberate anchor, gather minimal context, edit, and validate loop.

After testing different hypotheses and running offline evaluations, we turned that idea into two variants of the GPT-5.5 system prompt, both were promising in offline evals, and we tested them against the current default on live traffic.

Inside the experiment

We ran the experiment in VS Code over a two-week window, splitting GPT-5.5 agent traffic across two treatment groups and one control group with a 25/25/25 split. Both treatments test the same hypothesis but differ in how much structure they add to the prompt.

Group Variant name Description Traffic allocation
Control PRPT_CTRL Current default prompt 25%
Treatment A PRPT_SRCH Economical search and edit: single, compact reminder to limit exploration before acting 25%
Treatment B PRPT_LRG Large prompt sections: broader restructure covering the full edit-and-validate loop 25%

Note: The allocations add up to 75% because the experiment scorecard compares evenly sized groups. The remaining GPT-5.5 traffic continued to use the default prompt outside this scorecard slice, so we could compare the treatments and control across the same kind of user traffic.

Treatment A: economical search and edit

Treatment A makes a small, focused change: a single, compact reminder that nudges the model to reduce unnecessary exploration.

The <economical_search_and_edit> section in the prompt instructs the agent to start from a concrete anchor, gather only enough local context, avoid broad exploration, act once there is a cheap discriminating check, and avoid rereading unchanged context.

You can find the complete implementation details in gpt55BasePrompt.tsx:

{economicalSearchAndEditEnabled && <Tag name='economical_search_and_edit'>
    - Start from the most concrete available anchor: a file, symbol, failing behavior, failing command, or nearby implementation surface.<br />
    - Gather only enough nearby context to choose one plausible local hypothesis and one cheap check that could disconfirm it.<br />
    - Prefer one targeted search or nearby read over broad repo exploration.<br />
    - Once the cheapest discriminating check is known, act.<br />
    - Do not re-read unchanged context unless a new result makes it relevant.<br />
</Tag>}

Treatment B: large prompt sections

Treatment B tested a broader version of the same idea of limiting exploration. Instead of adding a single, compact reminder about economical search, it reorganizes the agent workflow into explicit <Before_the_first_edit> and <After_the_first_edit> sections. Unlike Treatment A, these additions make the system prompt itself larger, so a key question was whether the added structure would still improve efficiency, not just agent behavior.

The goal was to solve the full loop and not only the search step: form a local hypothesis before editing, avoid broad exploration, make a grounded first edit, and validate immediately after the first substantive edit.

You can find the complete implementation details in gpt55BasePrompt.tsx:

{largePromptSectionsEnabled && <>
    <Tag name='Before_the_first_edit'>
        - Start from the most concrete anchor available: a file, symbol, failing behavior, failing command, test, or nearby implementation surface. If the request does not name one explicitly, use the first targeted search or nearby read to identify that anchor, then continue locally from there.<br />
        - Before the first edit, gather only enough nearby evidence to state one falsifiable local hypothesis about how the requested behavior should work or why it is failing, and one cheap check that could disconfirm it.<br />
        [...]
        - Once you can state one falsifiable local hypothesis, the nearby code path it depends on, one cheap check that could disconfirm it, and one small edit that would test it, the next action must be a grounded edit.<br />
        - If confidence is incomplete, the first edit may be a small reversible probe that exposes missing types, behavior mismatches, control-flow gaps, or validation failures.<br />
        - If you find yourself still searching after that local-routing budget, treat that as drift. Recover by choosing the best current hypothesis and the best available nearby check, then make the smallest plausible edit that will let that check discriminate.<br />
    </Tag>
    <Tag name='After_the_first_edit'>
        - Prefer this order for that first validation action:<br />
        - the cheapest behavior-scoped or failing check that can falsify the current hypothesis<br />
        - a narrow test for the touched slice<br />
        - a narrow compile, lint, or typecheck command for the touched slice<br />
        [...]
        - Finish with at least one post-edit executable validation step whenever the environment provides one. Only fall back to diff-only validation when no focused command exists or commands are unavailable.<br />
    </Tag>
</>}

What the two-week scorecard showed

We tracked the treatments across three dimensions: quality (does the code stick), latency (how fast the first edit lands), and efficiency (tokens and tool calls). Each treatment is compared with the control group in the table below.

What each metric measures
  • 10-minute survival rate (by user): Of the code the model wrote, how much is still in the file 10 minutes later (not deleted or rewritten). It’s our proxy for “did the AI’s code actually stick.” Measured as surviving characters ÷ total characters written, as a %. E.g. ~90% — roughly 9 of every 10 characters the model added are kept.
  • Commit survival rate (by user): Narrower and stricter: of the AI-written code, how much survives all the way into a git commit. This is “did it make it into real, saved work.” Same character-ratio calculation, but only counting code present at commit time. E.g. ~87%.
  • p50 Time to First Edit (by turn): For a typical request, how long from hitting enter until the first actual change lands in your code — not just the model talking, but real work appearing. Measured in seconds. E.g. ~74s for the median turn.
  • p95 Time to First Edit (by turn): The same clock, but for the worst 5% of requests — the “why is this taking so long?” cases. A key tail-latency guardrail. E.g. ~6.4 min (383K ms), where hard tasks or lots of exploration delay the first edit.
  • p50 total tokens (by user): How much the model reads + writes for a typical user across their day — a proxy for cost and context load per person. Sum of tokens per user, median across users. E.g. ~12.9M tokens/user/day.
  • p95 total tokens (by turn): The token weight of the heaviest 5% of individual turns — the big, sprawling requests that drive cost spikes and hit context limits. E.g. a single turn running into the millions of tokens, vs a ~500K–900K median.
  • Average tool calls (by turn): How many actions (read file, search, run terminal, edit…) the agent takes per request to get the job done. Lower can mean more efficient; too low can mean less thorough. Mean tool calls per turn. E.g. ~24 per turn.

Signal legend: favorable and highly significant (p < 0.001), favorable and statistically significant (p < 0.05), unfavorable and highly significant, unfavorable and statistically significant, - not statistically significant.

Metric Treatment A (PRPT_SRCH) impact P-value Signal Treatment B (PRPT_LRG) impact P-value Signal
10-minute survival rate (by user) -0.40% (-0.37 pp) 0.0707 -0.44% (-0.41 pp) 0.0493
Commit survival rate (by user) -0.48% (-0.41 pp) 0.3200 +0.68% (+0.57 pp) 0.1533
p50 Time to First Edit (by turn) -2.88% (2.0s faster) 0.0271 -5.68% (3.9s faster) 2e-5
p95 Time to First Edit (by turn) -1.93% (8.0s faster) 0.1928 -9.30% (38.8s faster) 1e-10
p50 total tokens (by user) -2.54% (0.2M fewer tokens) 0.3429 -3.25% (0.3M fewer tokens) 0.2094
p95 total tokens (by turn) -5.19% (0.3M fewer tokens) 0.0157 -7.64% (0.5M fewer tokens) 0.0003
Average tool calls (by turn) -3.19% (0.77 fewer tool calls) 0.0091 -8.54% (2.04 fewer tool calls) 1e-12

Grouped bar chart comparing the percentage impact of Treatment A and Treatment B against the control baseline across seven metrics, showing that Treatment B produces the largest reductions in latency, token usage, and tool calls.

  • Quality: the guardrail metrics stayed mostly healthy. Commit survival rate moved slightly up for Treatment B (+0.68%) and slightly down for Treatment A (-0.48%), neither statistically significant. The 10-minute survival rate moved slightly down for both treatments: -0.44% for Treatment B and -0.40% for Treatment A. Only the Treatment B movement crossed the statistical significance threshold, and just barely (p=0.0493), unlike the highly significant efficiency wins. We treated that as a real tradeoff to weigh, but the movement was small and the other quality guardrail did not regress.

  • Latency: Treatment B delivered the strongest edit-latency wins, and both were highly statistically significant: p50 Time to First Edit improved -5.68% (3.9s faster, p=2e-5), and p95 Time to First Edit improved -9.30% (38.8s faster, p=1e-10). Treatment A moved in the right direction, but the edit-latency effects were weaker: p50 Time to First Edit -2.88% (2.0s faster, p=0.0271), and p95 Time to First Edit -1.93% (not significant).

  • Token efficiency: both treatments reduced median total tokens per user, but those p50 movements were not statistically significant: -3.25% for Treatment B and -2.54% for Treatment A. At the upper tail, Treatment B reduced p95 total tokens by -7.64%, highly statistically significant (p=0.0003). Treatment A also reduced p95 total tokens by -5.19%, statistically significant (p=0.0157). Both variants reduced average tool calls per turn: -8.54% (2.04 fewer tool calls) for Treatment B, highly statistically significant (p=1e-12), and -3.19% (0.77 fewer tool calls) for Treatment A, statistically significant (p=0.0091).

Treatment B had the strongest overall profile: clear latency wins, significant upper-tail token reductions, fewer tool calls, and mostly stable quality guardrails. The one movement worth watching, the small drop in 10-minute survival, was only lightly significant (p=0.0493), while the latency, token, and tool-call gains were larger and far more robust. Treatment A moved several metrics in the right direction, but Treatment B was more consistent across the measures that matter most for VS Code.

So we shipped it: Treatment B, LargePromptSections, is now the default GPT-5.5 system prompt.

The takeaway isn’t only that the numbers moved. The movement was tied to a specific, testable harness hypothesis from provider feedback, validated offline first and then confirmed online over a two-week production window. That’s the loop we want to keep running.

Continuous optimization

This experiment is one example of how we work with model providers beyond launch day. A model release is not the end of the tuning loop. It is another chance to look at real VS Code behavior, test focused improvements, and find new ways to make the experience faster, more reliable, and more efficient.

We’ll keep looking for those improvements across models, prompts, tools, and the VS Code coding harness, so more of each agent’s budget goes to the work that matters instead of unnecessary exploration.

Try agents in VS Code, switch between models, and compare how different models approach the same task. Share your feedback in our GitHub repo. It helps us keep improving the experience.

Happy coding! 💙

Iterating faster with TypeScript 7


June 26, 2026 by VS Code Team, @code

VS Code and TypeScript practically grew up together. We made a bet early on to write VS Code in TypeScript, and we have always worked closely with the TypeScript team to provide great built-in TypeScript and JavaScript language support in VS Code. This post is about the next step of that journey: TypeScript 7, and how collaborating on adopting TypeScript 7 sped up our builds, improved the day-to-day editing loop for both developers and agents, and helped the TypeScript team ship a more tested release.

TypeScript 7 is a complete port of the TypeScript compiler and language tooling in Go. That means it’s fast, more than 10x faster in many cases. VS Code had a lot to gain from those speedups, so we were naturally eager to adopt TypeScript 7 as soon as we could.

However, we also knew that this would take time. When we started this process in the summer of 2025, TypeScript 7 was actually already shockingly far along for a complete rewrite, but it still had type checking inconsistencies and lacked many features we needed. Even so, we wanted to start testing and providing feedback right away. Adopting TypeScript 7 while it was still being built may sound a little crazy, but it turned out to be a great decision for both VS Code and TypeScript.

An incremental migration

The VS Code team has never been afraid to take on large engineering efforts, whether that’s enabling strict null checking in our codebase, adding remote development support, or addressing and preventing dangerous code patterns across thousands of files. A common theme across these efforts is that we try to take an incremental approach. This means breaking big, complex problems down into small steps. Those steps happen in the main codebase (no forks or long-lived branches), and each one usually brings a small improvement as it lands. Take enough little steps, and eventually you can look back and realize that you’ve quietly conquered that once seemingly insurmountable challenge.

We wanted to take the same approach to adopting TypeScript 7. For us, that meant gradually introducing TypeScript 7 into different parts of our workflows and codebases, starting with lower-impact, lower-risk areas before eventually moving on to the main areas of VS Code. There are many benefits to working incrementally, but two were especially important for this effort:

  • Reduced risk. Each step of the adoption was relatively small, so if something went wrong, it was easy to identify the cause and revert.

  • Early feedback. We wanted to start testing and providing high-quality feedback to the TS team early in TS 7’s development. That meant getting as much usage of TypeScript 7 as possible, but without negatively impacting developer productivity on the VS Code team.

    This testing helped us find bugs and limitations that they could then prioritize fixing. And as we adopted TS 7 in more parts of our codebase, those areas also became informal regression tests for each new TypeScript 7 nightly release.

In practice, that incremental philosophy unfolded as a series of phases over about six months. Each phase increased our use and testing of TypeScript 7 a little more, moving in step with TypeScript 7’s own progress and helping shape it along the way. Here’s how it played out:

Exploration (summer and early fall 2025)

TypeScript 7 was publicly announced in March 2025. By the summer, it was ready for initial testing, although at this point it still had known bugs and limitations.

Type checking was farther along than emit (the process of generating JavaScript output files), so most of our early testing focused on manually running the @typescript/native-preview npm package on some of our smaller extensions with --noEmit. We reported issues as we found them, and because the native-preview package was updated daily, we could test new changes and fixes quickly.

As part of TypeScript 7, the TypeScript team was also building up the new language server that would power VS Code’s in-editor TypeScript and JavaScript support. This was shipped using the TypeScript native preview VS Code extension, which replaces VS Code’s built-in JavaScript and TypeScript IntelliSense with the new TypeScript 7 language server. We worked with the TypeScript team to make it easy to switch back and forth between the two TypeScript versions. That flexibility mattered because TypeScript 7 was still missing a number of basic language features at this point. We wanted developers to feel that they could try it out with as little effort and risk as possible.

We also made it easy to report TypeScript 7 issues directly from VS Code. Making reporting easy meant that developers would not think twice about filing even small annoyances. Those reports fed a steady stream of real world feedback for the TypeScript team.

At this stage, most testing was done by a small number of motivated VS Code team members who were interested in alpha testing and were OK working around some annoyances.

The TS 6 bridge (fall 2025)

Meanwhile the TypeScript team was thinking through how to ease the transition to TypeScript 7 instead of leaving users to make one big jump. Now it being 2025, this thinking was inexplicably accompanied by a bewildering hand gesture, with the result being the aptly named TypeScript 6.0:

TypeScript 6.0 acts as the bridge between TypeScript 5.9 and 7. As such, most changes in TypeScript 6.0 are meant to help align and prepare for adopting TypeScript 7

https://devblogs.microsoft.com/typescript/announcing-typescript-6-0/

Such a bridge was necessary because TypeScript 7 gave the team a chance to fix and modernize certain long-standing annoyances in TypeScript tooling. For example, older TypeScript releases defaulted to targeting ES5. That made sense in 2014, when ES6 (aka ECMAScript 2015) had not been finalized yet, but it felt wildly anachronistic in 2025. It was also a footgun for new developers who would end up accidentally generating larger, less efficient JavaScript files simply because they forgot to set target. Similarly, TypeScript 5 did not enable strict null checks by default, so many users were missing out on this truly game-changing feature just because they did not know they needed to enable it.

For us on the VS Code team, switching to TypeScript 6 was a small, low-risk step compared to the prospect of adopting an entirely rewritten TypeScript 7. It required only a few minor code changes. Still, this small step made us more confident that our codebase was in a good state and that once TypeScript 7 was ready, we’d be able to switch to it without many issues.

TS 6 and 7 in parallel (fall 2025)

Next it was time to start using TypeScript 7 in earnest. We started with the lowest-risk area: using TypeScript 7 to type check our built-in extensions. During this phase, we continued to run TypeScript 6 for full type checking and JavaScript generation (emit). We set up our continuous integration so that both TypeScript 6 and 7 builds needed to pass. Generally, the type checking between TypeScript 6 and 7 matched, but running both did help catch a few differences that we reported.

By this point, thanks to steady work from the TypeScript team, the language server in TypeScript 7 was also further along, so we added the TypeScript 7 extension as a dependency in the VS Code repo so that our developers could easily switch to it. Our goal was to gradually improve our editor support so that developers could spend more and more time using TypeScript 7. We prioritized anything that caused developers to switch back to TypeScript 6, whether that was a bug or missing functionality.

One of the most common initial reasons developers switched back to TypeScript 6 may be a bit surprising: code formatting. You can generally live with suggestions not being perfect and even with Go to Definition behaving inconsistently, but formatting differences between TypeScript 6 and 7 would cause our PR pre-commit checks and continuous integration formatting checks to fail. That gave even little formatting inconsistencies—such as extra whitespace—outsized priority. Over time, those formatting issues were ironed out and developers had to switch back to TypeScript 6 less and less.

Adopting TypeScript 7 for most extensions (January and February 2026)

By early 2026, TypeScript 7 had everything we needed to start using it fully. The TypeScript team had done truly amazing work making type checking trustworthy, finishing up emit, and improving the language tooling in the editor. It was time to start switching over to TypeScript 7 fully.

As always, we wanted to move carefully and incrementally, so we started migrating our built-in extensions one by one. These built-in extensions are fundamentally quite similar to a VS Code extension you can create using yo code. Before the switch, those extensions used the following build tools:

  • tsc (TypeScript 6) for type checking and development builds.
  • webpack for production and web bundles.
  • esbuild for fast emit.

As part of the TypeScript 7 migration, we decided to simplify our builds by switching our bundling to use esbuild instead of webpack. This simplified our build tooling and significantly reduced the time it took to generate bundles.

Our new built setup was simpler:

  • tsgo (TypeScript 7) for type checking and development builds.
  • esbuild for production and web bundles.

We migrated the extensions in small groups to minimize the impact of any regressions. This also let us start with the simplest extensions, building up our knowledge and confidence before moving on to more complex extensions. This process generally went smoothly, which shouldn’t be a huge surprise given that we had already been building this code using TypeScript 7.

Adopting TypeScript 7 as the default (February 2026)

The final move was to switch to TypeScript 7 for our normal development. By then, the TypeScript team’s fixes had removed the blockers we had been working around, and because the incremental steps had already done most of the work, the code change for this was actually pretty minor. Here’s the change that switches our normal watch task to use TypeScript 7, for example.

We also made TypeScript 7 the default version used in the editor for the VS Code repo. We still support switching back to the older TypeScript as an escape hatch, but it has rarely been needed in practice. Most developers are happy to stay on TypeScript 7 because of its significantly better performance.

The numbers

So, was it all worth it? The answer is a clear and resounding yes.

Here’s a before-and-after comparison for type checking the main VS Code source code:

# TS 6.0
tsc --noEmit -p src/tsconfig.json
36 seconds

# TS 7
tsgo --noEmit -p src/tsconfig.json
5 seconds

TypeScript 7 is more than seven times faster! That’s especially impressive when you consider that these two tasks are doing the same work: they type check the same files with the same level of thoroughness and report the same errors. Just by switching from TypeScript 6 to TypeScript 7, we sped up our type checking by 7x.

With TypeScript 7, we can also now type check almost all of our built-in extensions in well under a second. The only exception is our larger Copilot extension, and that still only takes 2.5 seconds.

The results get even more impressive when we look at compiling and type checking all of VS Code, i.e. both our main source code and our roughly fifty built-in extension tsconfig projects. This is what the npm run watch command does, and it is also the command that developers working on VS Code typically run.

With TypeScript 6, npm run watch takes around 80 seconds to complete. After migrating to TypeScript 7, we dropped this time to just over 20 seconds: roughly four times faster. That’s a whole minute saved in normal development and agent-assisted iteration every time a build needs to be restarted (re-checks after the initial watch completes are around a second at most).

Those improvements also translate into better language tooling performance in the editor. For TypeScript language features in the editor, we need to load the whole tsconfig project before we can provide proper errors and complex features like auto imports. For the main VS Code project, that used to take close to a minute. Now it’s around 10 seconds. That’s roughly 50 seconds saved. With VS Code developers often reloading their editor windows multiple times per day, those saved seconds really add up. No more quick coffee runs while the editor tools are loading.

Seeing these numbers really puts the scale of the improvements in perspective. It was easy to lose track of the total impact because our incremental approach meant that many improvements arrived gradually instead of in one big PR. Early steps might only have saved a second here or a few hundred milliseconds there. By the end, however, those small wins had added up into something significant. It’s amazing to see how the TypeScript team delivered on their initial promise too: it’s full TypeScript, just way faster.

Better through collaboration

Adopting TypeScript 7 has been a big win for developers working on VS Code, but there’s another result of this effort that is less tangible and perhaps even more impactful. VS Code’s large, complex codebase turned out to be an excellent way to find real-world bugs in TypeScript 7 and polish its editor tooling.

The developers on the VS Code team also were not afraid to provide feedback about missing features or when something just did not feel right. Every time a developer hit a rough edge and switched back to TypeScript 6, it was a signal for the TypeScript team to decide what to fix next. The result is a more tested and polished version of TypeScript 7, one that we know works well beyond the VS Code codebase.

Although we’ve focused on the VS Code side of the story in this post, the TypeScript team really deserves almost all of the credit. They were the ones building TypeScript 7 after all, while also responding to all the feedback from those pesky VS Code devs. From myself and the rest of the VS Code team, thank you!

TypeScript 7 is an exciting step forward for the language. Whether you’re editing code in VS Code, kicking off compiles on the command line, or asking an agent to iterate on a project, the performance improvements are significant and noticeable. Thanks to the work of the TypeScript team and the testing and feedback process outlined here, switching to TypeScript 7 should be a relatively smooth process and an easy win for many codebases.

More than anything though, I hope this post shows the value of working incrementally, testing early and often, and building tight feedback loops for close collaboration. These are values VS Code has always held, and they continued to serve us well again on this effort. I hope that this story motivates you to think differently about how you can tackle large engineering efforts in your own projects and ultimately ship better code.

Happy coding! 💙

Visual Studio June Update – Track Your Usage, Trust Your Tools


Visual Studio works best when you can see what’s happening and trust the tools you’ve added to your workflow. The June update is built around both. The Copilot Usage window gets a refresh with proactive alerts as you approach your limits, MCP servers now get a trust check before they run anything new, and the GitHub Copilot modernization agent for C++ graduates to general availability for MSVC upgrades.

We’ve also extended next edit suggestions across the entire active file and brought full-color emojis everywhere the editor renders text. Install the June Stable Channel update when you’re ready, then take a look at what’s new below.

Copilot usage tracking and alerts

GitHub Copilot usage is now calculated based on token consumption rather than by request, as part of its usage-based billing model. The refreshed Copilot Usage window in Visual Studio gives you a clearer view of where you stand against that model, with real-time updates as you work. Open it any time from the Copilot badge menu > Copilot Usage.

The Copilot Free Usage flyout showing a Monthly limit progress bar at 100.0% with a reset date, an Inline suggestions bar at 0.1%, and an Upgrade plan button.

You’ll also see proactive alerts as you approach a limit, when you hit it, and when additional usage (overages) activates. The quota warning threshold is configurable, so you can decide how early you want the heads-up.

This is the start of a broader investment in Copilot usage visibility. Expect more in upcoming releases, and let us know on Developer Community what would help most.

Trust validation for MCP servers

MCP servers extend Copilot’s reach, and as more of your day-to-day workflow runs through them, the question of whether they’ve quietly changed underneath you becomes worth asking. Visual Studio now validates MCP server trust in two places during startup. Before the server process starts, the current configuration is compared against a previously trusted baseline. After it starts, the fingerprint of its tools, prompts, resources, and instructions is compared to the last-trusted fingerprint. If anything has diverged, a trust dialog asks you to review the changes before the server is allowed to run.

The Trust and run MCP server dialog warning that the configuration for "MyDemoServerNew4Final" has changed and that tools, prompts, and instructions may have been updated, with Trust and Do not trust buttons.

From the dialog you can accept the changes (which updates the baseline), check Don’t show me this dialog again for this server and pick Trust to always trust the server going forward, or pick Do not trust to reject the changes and abort startup. First-time connections are implicitly trusted and seed the initial baseline. Built-in servers, servers under a RegistryOnly policy, and any server you’ve explicitly set to always-trust skip the prompt entirely.

Trust validation is on by default. You can manage it at Tools > Options > GitHub > Copilot > Copilot Chat > Show trust dialog before running tools from an updated MCP server.

GitHub Copilot modernization agent for C++

The first C++ scenarios for the GitHub Copilot modernization agent are now generally available. These are the flows that upgrade your C++ projects to the latest version of the Microsoft C++ (MSVC) Build Tools, where the new features, performance improvements, and security updates live.

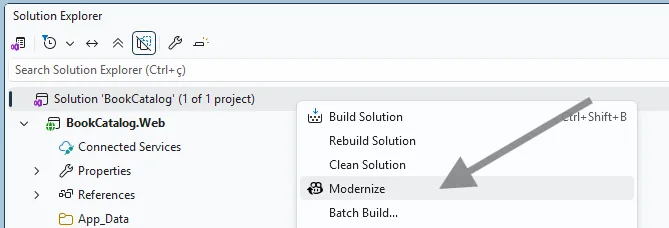
The agent analyzes your project, identifies compatibility issues, and lays out an upgrade plan. Run it in Automated mode to let it carry out the upgrade end to end, or in Guided mode to review and approve the assessment, plan, and execution steps before each one runs. Right-click a solution or project in Solution Explorer and pick Modernize, or open Copilot Chat and type @Modernize followed by your upgrade request.

An assessment.md document generated by the modernization agent for a Hilo C++ sample, listing in-scope toolset upgrade issues (compile blockers like C2039 'tr1' not a member of std, and MSB8036 Windows SDK 10.0 not found) with project paths, file paths, and rationale for each.

Thanks to the developers who put the preview through its paces on real C++ projects — your feedback shaped where this landed. Let us know which C++ modernization scenarios you want next on the C++ Developer Community.

Long-distance next edit suggestions

Make a change in one place, and you usually know there are related edits to make further down the same file. GitHub Copilot’s next edit suggestions (NES) have always anticipated the next change, but until now they were limited to the area immediately around your cursor. That’s often not where the related edits actually are.

Long-distance next edit suggestions extends NES across the full active file. Copilot can predict and propose edits anywhere in the current file, helping you keep related code in sync without manually hopping between sections.

A C# property setter at line 60 with the cursor positioned in the setter body and a "Tab Suggestion on Ln: 81" hint pointing to a Next Edit Suggestion several lines further down the file.

The feature is off by default for now. Turn it on under Tools > Options > Text Editor > Inline Suggestions by checking Enable extended range suggestions. The deep dive on the model training and evaluation behind long-distance NES is worth a read if you want the back story. Give it a try and tell us how it lands.

Color emojis

Emojis are now rendered in full color across Visual Studio. The same emoji you use to flag a bug, mark a section header, or highlight a TODO shows up with its real colors in the editor, in markdown previews, in GitHub Copilot Chat, in build output, and in Solution Explorer.

Three TODO-style code comments rendered in green with full-color emojis: a red bug for "Fix editing user not being saved", a notepad for "Cleanup code", and a sparkles for "Add the ability to edit a user".

A red ❌ stands out as a warning, and a green ✅ reads as confirmation. The rendering uses modern font technologies, so what you see matches what your teammates see regardless of which Windows version they’re on.


From our entire team, thank you for choosing Visual Studio! For the latest updates, resources, and news, check out the Visual Studio Hub and stay in touch.

Happy coding!
The Visual Studio team

Automating your Visual Studio extension builds with GitHub Actions


If you’re building and maintaining Visual Studio extensions, you’ve probably ended up with some sort of build and publishing workflow – whether it’s manual, scripted, or stitched together over time.

This post is for extension authors who want a simple, repeatable way to build, version, and publish their VSIX files using GitHub Actions.

I’m going to show how I do this across my own extensions.

github action publish image

I’ve been using this approach for a long time, and over time I pulled the most repetitive pieces into a few small reusable actions, so I don’t have to keep rewriting the same logic in every repo.

Those are:

  • vsix-version-stamp – keeps your versioning in sync
  • publish-vsixgallery – publishes CI builds for testing
  • publish-marketplace – publishes to the Visual Studio Marketplace

You can use them independently or together, but I tend to use all three.

If you want to see this wired up in a real repo, take a look at Start Screen.

A real workflow

Here’s a simplified setup very similar to what I use across my extensions today:

name: Build
on:
  push:
    branches: [ main ]
  pull_request:
    branches: [ main ]

jobs:
  build:
    runs-on: windows-latest

    env:
      Configuration: Release
      VsixManifestPath: src\source.extension.vsixmanifest
      VsixSourcePath: src\source.extension.cs

    steps:
      - uses: actions/checkout@v6

      - name: Setup MSBuild
        uses: microsoft/setup-msbuild@v3

      - name: Restore
        run: msbuild /t:Restore

      - name: Version stamp
        uses: madskristensen/vsix-version-stamp@v2
        with:
          manifest-file: ${{ env.VsixManifestPath }}
          vsix-token-source-file: ${{ env.VsixSourcePath }}

      - name: Build
        run: msbuild /p:Configuration=$(Configuration)

      - name: Publish to VSIX Gallery
        uses: madskristensen/publish-vsixgallery@v1
        with:
          vsix-file: '**/*.vsix'

      - name: Publish to Marketplace
        uses: madskristensen/publish-marketplace@v2
        with:
          extension-file: '**/*.vsix'
          publish-manifest-file: vs-publish.json
          personal-access-code: ${{ secrets.VS_MARKETPLACE_TOKEN }}

This is essentially the full pipeline – version, build, package, and publish.

From here, you can tweak when publishing happens (for example, only on releases), but the core setup tends to stay the same.

Keeping your version in sync

Versioning is one of those things that’s easy to get wrong.

The vsix-version-stamp action updates your version during the build, so you don’t have to think about it.

It works especially well together with the
VSIX Synchronizer extension, which generates a .cs file from your .vsixmanifest.

That gives you:

  • A single source of truth
  • Version available in code
  • No manual edits before publishing

It’s completely optional, but once you start using it, it tends to stick.

Publishing to the Visual Studio Marketplace

Once you have a VSIX, publishing it to the Marketplace is straightforward.

You only need a single secret:

- name: Publish to Marketplace
  uses: madskristensen/publish-marketplace@v2
  with:
    extension-file: '**/*.vsix'
    publish-manifest-file: vs-publish.json
    personal-access-code: ${{ secrets.VS_MARKETPLACE_TOKEN }}

That’s it.

The VSIX contains the extension metadata, and the publish manifest fills in the rest.

Publishing to a VSIX Gallery (for CI builds and testing)

The publish-vsixgallery action serves a different purpose.

It’s for quickly sharing builds.

I primarily use it when I want someone to try out a fix or validate a change before it goes to the Marketplace.

- name: Publish to VSIX Gallery
  uses: madskristensen/publish-vsixgallery@v1
  with:
    vsix-file: '**/*.vsix'

That’s what VSIX galleries are great for – fast, lightweight distribution without the overhead of a full release.

Works with your own gallery too

VSIX Gallery is open source, so you can host your own instance if you want.

The GitHub Action supports a configurable gallery-url, so it’s not tied to a specific hosted gallery.

- name: Publish to VSIX Gallery
  uses: madskristensen/publish-vsixgallery@v1
  with:
    vsix-file: '**/*.vsix'
    gallery-url: 'https://your-gallery.example.com'

That lets you use the same workflow whether you’re targeting a public gallery or something you host yourself.

Mixing and matching

You don’t have to use all three actions.

Some common setups:

Minimal

  • Build + Marketplace publish

CI-focused

  • Build + VSIX Gallery publish

Full pipeline

  • Version stamping + build + gallery + Marketplace

Use what fits your workflow.

When to use what

  • VSIX Gallery
    Use this for testing, sharing builds, and quick validation
  • Visual Studio Marketplace
    Use this for official releases

Most extensions benefit from using both:

  • CI builds go to a gallery
  • Stable builds go to the Marketplace

Wrap-up

This is the setup I use across my extensions.

It keeps things predictable, makes it easy to share builds, and removes most of the repetitive steps from the release process.

You don’t need to adopt all of it. Start with the parts that make sense for your workflow and build from there.

What 50,000 Runs of a 5-Line Eval Taught Us


June 19, 2026 by VS Code Eval Team, @code

Over the last six months, we have run the same tiny eval more than 50,000 times. It gives the VS Code agent one instruction: write a string to a file. No large codebase to understand, no test suite to debug, no architectural decision to make. It is our smoke test, a quick way to confirm that the end-to-end model interaction still works.

A task this simple gives us an immediate read on the health of the system: how reliably the agent finishes the work and what kinds of failures show up in practice. We didn’t intend it to be more than that. But at this scale, it became a surprisingly rich source of insight into how models approach even the simplest request.

In our previous post, we introduced VSC-Bench, the offline evaluation suite we use to measure agent behavior in VS Code. In this blog post, we look at how models solve a simple task and what it tells us about efficiency, model selection, and the value of small, stable evals.

The five-line eval

A simple task is valuable precisely because it removes variables. When the work is unambiguous and the correct answer is fixed, anything that changes between runs comes from the model or the system around it, not from the task itself. That makes a small eval a sensitive instrument: it reacts to harness regressions, infrastructure incidents, and differences in model behavior, without the noise of a complex problem to interpret.

The say_hello task we use for this is built around that idea. Every run starts in the same empty workspace, with the same tools and the same fixed prompt, using our VS Code agent harness. The task asks the agent to “Add HELLO to HELLO.txt” and checks two assertions: that the file exists and that it contains the expected content.

promptSteps:
  - text: Add HELLO to HELLO.txt.
    assertions:
        - check: file_exists("HELLO.txt")
        - check: file_contains("HELLO.txt", "HELLO")

Because say_hello runs as a smoke test before every benchmark suite, it quietly accumulated 50,974 runs across 30 models over six months. That volume turned a basic sanity check into a useful dataset on how differently models handle even the simplest work.

A developer doing this task would recognize that the workspace is empty, create HELLO.txt, and add the requested content. In the most direct VS Code agent path, this translates into a single create_file tool call with HELLO as the file content.

tool : create_file
args : {
  "filePath": "/path/to/workspace/HELLO.txt",
  "content": "HELLO"
}


Note

The VS Code eval harness includes the workspace state in the initial prompt context. We assume that the model should not perform redundant existence checks.

How models solve say_hello

As expected, the say_hello task is easy enough that all models pass it most of the time. The interesting part is not whether they can do the work, but how they do it. Can the model recognize that this is a basic request that only requires a simple solution? Or does it still treat it like a complex problem that requires planning, exploration, and search?

To establish a baseline, we filtered for passing runs that used this one-tool-call path and looked at the lowest output-token counts in that group. Those runs averaged roughly 50 output tokens, including the tool-call structure. We then measured how often each model took that path.

Chart showing the percentage of passing runs where the model achieves the one-tool-call direct path.

One model takes the direct path every time. The broader trend is what stands out: a few models often take the direct path, most do so only occasionally, and five never do.

At the top, Model-A stands alone. It goes straight to file creation in 100% of passing runs, using a single tool call every time. For this simple request, Model-A always creates the file directly without planning or exploring first. Model-B and Model-C follow at 73% and 71%, respectively.

The large middle cluster, Model-D through Model-P, takes the direct path somewhere between 19% and 52% of the time. These models can recognize a simple task, but not consistently. More often than not, they add a small step first, such as reading internal state or doing light workspace exploration, before creating the file.

Below them, Model-Q through Model-X rarely take the direct path, doing so in 0.2% to 6% of passing runs, with five models falling below 1%. For these models, extra work is the default. They almost always plan, explore, or search before producing the same five-character file.

At the bottom, five models, Model-Y through Model-AC, never take the direct path across thousands of passing runs. They always do something else first: plan, reach for a patch tool instead of simple file creation, search and plan, or narrate at length before creating the file. For them, even the simplest request triggers the full machinery of a complex one.

All models create the file with the right content, but they reach the same outcome with very different amounts of work. Even on a task with almost no ambiguity, some models still plan, search, or choose a more complex editing tool. They all pass the eval, but they do not use the same amount of effort to pass it.

How models spend their overhead

Because our offline eval harness captures the complete tool-call sequence, we can turn those traces into model behavior patterns. Across runs, models tend to spend their extra effort in a few familiar ways:

Overhead pattern Frequency Representative models What happens
Planning before acting 52-99% Model-AC, Model-Z, Model-S, 13 other models Drafts a checklist or reads internal state before creating a 5-character file. Every one of the 16 models we could measure does this in at least half of its runs; Model-AC reaches 99% and Model-Z 96%. On one occasion, four planning steps in a single run for a one-step task.
Exploring an empty workspace 56-96% Model-T, Model-Q, Model-AA Lists directories or searches for files in an empty workspace. Model-T lists the directory in 96% of runs; Model-AA both lists and searches in 56%, looking for clues in an empty room.
Narrating the reasoning 1,441-3,676 tokens Model-AB, Model-M, Model-U Emits far more text than any tool call needs, walking through its reasoning and reconfirming the task. These three top the output-token chart at 29-74 times the realistic floor, even though the file itself is five characters.
Using the wrong tool for the job About 95% Model-AA Uses a complex patch/edit tool (designed for modifying existing files) instead of simple file creation. Like using a CNC machine to cut a piece of paper.
Running a terminal command 3-14% Model-W, Model-Z, Model-V Runs a terminal command (echo HELLO > HELLO.txt) when a simpler file-creation API is available.

These are not correctness failures. They are signs that the model does not consistently recognize when the shortest path is enough. On longer tasks, planning and exploration can be valuable. On a one-step task, they add latency and cost without improving the result.

The cost of overthinking

Why should you care about how many extra steps a model takes to write a five-character file? Because those extra steps are not free and translate directly into output token usage, which has an actual cost.

For this simple task, about 50 output tokens is a realistic minimum. The following chart shows the range of output tokens used by different models. The selected models range from that minimum to thousands of tokens for the same five-character result!

Chart that shows average output tokens per run vary from near the ideal floor to thousands of tokens for the same HELLO.txt task.

The chart falls into four clear bands. The extreme group includes Model-AB, Model-M, and Model-U, which average 3,676, 2,120, and 1,441 output tokens, respectively. That is 29 to 74 times more than the realistic minimum for the same five-character result. The high-overhead group, from 400 to 1,000 tokens, includes Model-AA, Model-B, Model-N, Model-H, Model-V, Model-E, Model-S, and Model-K. These models are not in the thousands, but they still spend roughly 8x to 12x the realistic minimum.

The moderate group, from 150 to 400 tokens, includes Model-P, Model-D, Model-X, Model-T, Model-G, Model-Z, Model-I, Model-AC, Model-F, Model-J, and Model-Q. They add overhead, but stay far closer to the task’s natural size. The efficient group is below 150 tokens: Model-R, Model-A, Model-Y, Model-W, Model-O, Model-C, and Model-L. Model-L comes closest to our realistic minimum at 55 tokens, showing that a model can complete the task with very little extra narration even when it does not always take the direct tool path.

Choosing a model that overthinks less saves both time and money, but knowing which one is most efficient for a task usually means running your own benchmark. To take that burden off you, the VS Code and GitHub Copilot teams keep investing in optimizations and model routing. For example, automatic model selection lets VS Code pick the best model for your task.

Model size does not predict overhead

Our first hypothesis was that larger models overthink more, but our data contradicts this:

  • Model-F (a larger model) uses 160 output tokens on average and 2.1 tool calls. The most disciplined model in its family.

  • Model-H (a smaller model from the same family) uses 485 output tokens on average and 3.7 tool calls. More overhead than its larger sibling.

  • Model-AB (a “mini” model) is the single highest-overhead model at 3,676 output tokens on average. The smallest model in this sample does the most work.

Our read is that newer generations within each model family trend more disciplined, regardless of parameter count. This points to training maturity: how well a model scales its effort to the task in front of it. And that calibration isn’t an academic curiosity. It shows up directly on the bill.

Where do we go from here?

We wanted to share a few key insights our team took from these runs, and a few learnings you might be able to apply to your own day-to-day flow.


Note

The say_hello eval gives us great insights but it represents only one task. For harness optimization, we avoid optimizing too narrowly around a single task. We still run the full benchmark regularly across a diverse task set to validate whether changes improve our harness broadly.

Match the model to your task

With usage-based billing, output tokens represent both money and time. The difference between the leanest and heaviest model on this task is roughly 70× for identical output. The obvious lesson would be “don’t reach for the biggest model to write HELLO.” But that lesson is too blunt, and seeing why is the most useful thing say_hello taught us.

There is an important caveat to these results. say_hello is a short-horizon task with one step and one correct answer. On long-horizon work, planning, exploration, and reasoning can prevent expensive mistakes and improve the odds of finishing. The goal is not to eliminate planning. It is to understand whether a model can tell the difference between a one-step task and a 30-step task.

That is one reason why we think model selection should not become the developer’s burden. Signals like effort calibration, token efficiency, and tool discipline can help automatic model routing pick the right model for the task at hand without asking developers to reason about every tradeoff.We continue to invest in and research automatic model selection in VS Code, so the product can make more of these choices for you over time.

Start small, measure well

Most teams do not start with a private offline benchmark suite they can run every day. Even a simple task, run consistently and logged well, can reveal useful changes in model or system behavior.

Start with the smallest task that has an unambiguous correct answer. Then run it constantly: use it as a preflight check before nightly evals, model onboarding, and infrastructure changes. The task does not need to be clever; it needs to be stable enough that changes in pass rate, latency, tool use, or failure mode mean something.

The important part is to capture enough structure to explain what changed. Record the tool-call sequence, not just the count. Knowing there were 4 tool calls is useful, but incomplete. Knowing that the model planned, explored, searched, and then created the file tells you where the overhead came from and why the run cost more.

// What most harnesses log:
{ "tool_calls": 4, "pass": true }

// What you actually need:
{
  "tool_sequence": ["plan", "list_directory", "search_files", "create_file"],
  "output_tokens": 617,
  "pass": true
}

From smoke test to signal

The surprising part of say_hello was not that models could write HELLO.txt. It was that a five-character edit made effort visible: which models scaled down, which kept planning or searching, and which system failures only appeared after thousands of runs.

Try the same request with your preferred model in VS Code, inspect its tool calls in the Chat Debug View, and consider what your own smallest useful task might be. Share what you find in the VS Code repository.

Happy coding! 💙

Improving token efficiency for GitHub Copilot in VS Code


June 17, 2026 by Ryan Caldwell and Bhavya U

With the recent move to usage-based billing for GitHub Copilot, every token in an agentic session matters. They affect your credits, latency, and the context window an agent has left to finish the task. Each new model generation tends to consume more tokens per task than the last, as we’ve witnessed in our own data. This means that harness-level efficiencies are increasingly important to counter this trend. As agents take on longer, more autonomous work, an inefficient harness adds up fast.

Chart showing tokens per turn increasing across successive model generations

Making the GitHub Copilot agentic harness in VS Code more token-efficient is continuous work, and it’s the best way to counter this trend. For most changes, we run A/B experiments in production and offline evaluations against task suites, confirming that task success rate holds or improves while token usage drops. It’s rarely one big win, usually a steady stream of small ones. Below, we walk through recent gains, first for OpenAI models and then for Anthropic models.

How agentic requests spend tokens

Two costs sit at the heart of every agentic request, and two ideas help us reduce them. Both apply across OpenAI and Anthropic models, even though each provider exposes them differently.

Screenshot of the Cache Explorer showing parts of the prompt in a horizontal stacked bar chart.
Graphical overview of the prompt signature highlighting the different parts of the prompt.

The prompt prefix and caching. In an agentic coding session, a large share of every request repeats across turns: system instructions, tool definitions, repository context, and conversation history. This repeated beginning is the prompt prefix. When requests share the exact same prefix, the inference provider can reuse cached model state instead of recomputing it from scratch on each request. Despite the name, the cached artifact is not a human-readable copy of the prompt. It is the model state computed while processing that prefix, represented internally as key/value tensors. Reusing the prefix cuts both cost (cached tokens can be up to 10 times cheaper) and latency, which is why we work to keep the prompt cache hit-rate high.

Tool-definition overhead. Agents can pull in a large number of tools: those exposed by MCP servers, built-in tools, or extension-provided tools. Each tool is sent to the model with a full definition (a name, a description, and a complete JSON parameter schema), and historically every one was loaded into context on every request. Even when that data is cached, the context window overhead is fixed on each turn and grows as the toolset does.

Tool search. Tool search reduces that overhead by letting the model load tool definitions on demand instead of all at once. Upfront, the model sees only lightweight metadata, the name and description of each deferred tool, and the heavier parameter schemas stay out of context until the model searches for a tool and loads it. Because deferred tools are added at the end of the context window rather than the prefix, the cached prompt prefix stays reusable and the caching gains keep working across turns. The payoff is a leaner context window: the model spends fewer tokens on tools it never uses, leaving more room and budget for the actual task.

Efficiency wins for OpenAI models

For OpenAI models, our recent work focused on reducing usage costs and latency for Copilot users through improved token efficiency. We pursued that through three changes: retaining cached model state for longer, reducing tool-definition overhead, and replacing repeated HTTP requests with persistent WebSocket connections.

Extended prompt caching

OpenAI models cache the prompt prefix automatically: the provider infers the reusable prefix and reuses its model state across requests. That reuse has a direct cost benefit. For most OpenAI models that support cached input pricing, uncached input tokens cost 10 times as much as cached input tokens.

Caching the prefix happens on its own, but how long that cache survives is something we can configure. After careful evaluation, we enabled extended prompt caching for supported models through the prompt_cache_retention body parameter. By default, the cache lives in fast GPU memory, where it is dropped after about 5 to 10 minutes of inactivity (up to an hour in some cases) to make room for other work. Setting "prompt_cache_retention": "24h" moves the cache to slower but roomier GPU-local storage and keeps it for up to 24 hours.

The benefit is simple. With the default cache, a pause of more than a few minutes throws the cache away, so your next request has to reprocess the whole prefix at the full, uncached price. Extended retention keeps the cache warm, so picking up where you left off is still fast and cheap, even after a long break.

After enabling extended prompt caching for supported OpenAI models in VS Code, we measured the following relative increases in cache hit rate. These are relative changes, not percentage-point increases: a 919% increase means the cache hit rate was 10.19 times higher than its previous value.

Time between requests GPT-5.2 GPT-5.3-Codex GPT-5.4
10-20 min +13% +32% +10%
20-30 min +135% +142% +137%
30-40 min +301% +203% +679%
40-60 min +338% +279% +919%

The increase was largest after longer gaps between requests, when cached model state that would otherwise have expired remained available for reuse. In practice, this increase means more of your prompt is processed at the lower cached-input rate, reducing the cost of requests even after longer pauses.

To avoid sending all tool definitions on every request, tool search makes this on-demand. Available to models GPT-5.4 and newer, OpenAI’s native tool search implements this deferral with a defer_loading flag.

Upfront, the model only sees lightweight metadata: the name and description of each deferred function or, when deferred functions are grouped into a namespace, only the namespace’s name and description.

During a four-day VS Code experiment with GPT-5.4 and GPT-5.5, tool search reduced per-turn token utilization, time to first token, and time to complete:

Metric Model Delta
P50 Total tokens used per turn GPT-5.4 -9.81%
P50 Total tokens used per turn GPT-5.5 -8.61%
P50 Time to first token (TTFT) GPT-5.4 -6.88%
P50 Time to first token (TTFT) GPT-5.5 -7.34%
P50 Time to complete (TTC) GPT-5.4 -5.31%
P50 Time to complete (TTC) GPT-5.5 -5.42%

Aggregated across an entire session, total token usage for the median Copilot user decreased by 8.97% with GPT-5.4 and 10.92% with GPT-5.5.

WebSockets

An agentic coding turn can involve many sequential requests to the inference provider; one for each step the model takes as it calls tools and works toward a solution. Even when the underlying HTTP connection is reused, each step remains a separate API request.

Responses API WebSocket mode keeps a persistent connection open and provides a lower-latency continuation path for those sequential requests. On an active connection, OpenAI can also reuse the most recent response state from a connection-local in-memory cache, reducing continuation overhead across long chains of tool calling.

A few months ago, OpenAI announced WebSocket support in the Responses API. Initial documentation showed large latency improvements, so we experimented with it early and saw consistent latency reductions in our own A/B test. This was one of those ideas that feels obvious in retrospect. Agentic coding sessions make repeated requests over a long-lived interaction, which is exactly what WebSockets are designed to handle.

During the initial rollout of WebSockets to VS Code Stable, the latency gains from the A/B experiment held in production. The table below shows the latency gains from WebSockets relative to HTTP during that rollout. Since then, improvements elsewhere in the stack, including improved prompt caching, have further reduced latency and usage costs. For each metric, lower is better:

Tracking metric Percentile GPT-5.3-Codex GPT-5.4
Time to first token (TTFT) p50 -19.46% -16.37%
Time to first token (TTFT) p95 -12.92% -15.78%
Time to complete (by turn) p50 -13.55% -11.74%
Time to complete (by turn) p95 -7.86% -6.26%

We also observed statistically significant relative increases in user engagement. For GPT-5.3-Codex and GPT-5.4, respectively, active users increased by 1.27% and 2.17%, while two-day engagement increased by 1.90% and 3.14%.

These gains led us to make WebSockets the default transport for OpenAI models GPT-5.2 and newer across Copilot products including VS Code, Copilot CLI, the GitHub app, and more.

Efficiency wins for Anthropic models

For Anthropic models, our recent work targeted the same two repeating costs: the prompt prefix we keep warm in cache, and the tool payload we send on every turn. We pursued that through two changes: spending our prompt-cache breakpoints more deliberately, and deferring tool definitions through tool search.

Smarter prompt caching

Anthropic’s prompt caching works differently from the automatic prefix caching that OpenAI models use. Rather than the provider inferring the reusable prefix, the caller places explicit cache_control breakpoints, and the API caches everything up to each marker.

The budget of breakpoints per request is small and fixed, so where you place them matters as much as whether you use them. We reworked our Messages API caching to spend up to four breakpoints deliberately, anchored at the prompt’s most stable boundaries:

  • The end of the tool definitions and the end of the system prompt, the parts that change least between turns.
  • A pair of rolling anchors on the two most recent cacheable messages.

That second, older anchor is a safety net. If the freshest anchor misses (a slow tool call lets its cache lapse, or content drifts slightly), the older anchor still serves a hit covering everything up to it. We typically give up a single exchange instead of cold-starting the whole conversation cache.

These changes produced a steady few-percentage-point increase in cache hit rate. For agentic workloads, where the prefix is long and turns come in quick succession, it now sits at around 94%, which means that only a small fraction of each request’s input has to be recomputed instead of served from cache. This reduces both usage cost and time to first token.

Anthropic’s tool search tool applies the same deferral idea. Tools are marked with defer_loading: true, and alongside the deferred catalog we keep a small, curated set of core tools loaded (reading and editing files, running terminal commands, searching the workspace) so the most common actions never require an extra step.

We first rolled this out using Anthropic’s server-side tool search, where the model searches the deferred catalog on Anthropic’s side and the API expands matches into tool_reference blocks inline. In a seven-day VS Code experiment, deferring tool definitions reduced both prompt-token and total-token usage and trimmed time to first chunk:

Metric Percentile / scope Delta
Time to first chunk p50 (by turn) -2.45%
Total prompt tokens p50 (by turn) -11.30%
Total prompt tokens p95 (by turn) -8.85%
Total prompt tokens p50 (by user) -18.32%
Total tokens p50 (by turn) -11.09%
Total tokens p95 (by turn) -8.74%
Total tokens p50 (by user) -18.03%

For the median Copilot user, overall prompt-token and total-token usage each fell by roughly 18% across a full session.

With the approach proven, we moved the search itself client-side, backing it with the same tools-grouping system we built for VS Code’s reduced toolset. The model still calls a tool_search tool, but instead of Anthropic matching against the deferred catalog, we run the search locally and return tool_reference blocks for the best matches.

The local search is also smarter. Rather than lexical matching over tool names and descriptions, we use our internal Copilot embedding model, the same model that powers our embedding-guided tool routing, to compare the query against vector representations of every available tool. Because it matches intent rather than literal keywords, a request like “find all references to this symbol” surfaces the right tool even when its name and description share no words with the query.

For a deeper look at the grouping and embedding-guided routing behind this, see How we’re making GitHub Copilot smarter with fewer tools.

Moving the search client-side gave us some extra benefits beyond the original token savings:

  • Responsiveness: the search runs locally against cached embeddings, so discovering a tool no longer depends on a server-side search round trip.

  • Dynamic MCP tool discovery: because we own the candidate set, tools that connected MCP servers add or remove mid-session are reflected immediately, without waiting on a fixed server-side catalog.

  • Better quality: the embedding-guided search is more likely to surface the right tool for a given query, which reduces user error and improves task success, as shown in the metrics below.

That responsiveness showed up directly in the numbers. In a two-week VS Code Stable rollout, the client-side tool search reduced latency on top of the token savings already gained from deferral.

Metric Model Delta
Time to first token (p50) Claude Opus 4.6 -1.91%
Time to complete (p50) Claude Opus 4.6 -1.97%
Time to complete (p95) Claude Opus 4.6 -2.57%
Time to complete (p50) Claude Sonnet 4.6 -1.30%
Time to complete (p95) Claude Sonnet 4.6 -3.35%
User error rate Claude Sonnet 4.6 -4.01%

In both variants, deferred tools sit outside the cached prompt prefix, so the prefix is never rewritten and the caching gains above keep working across turns. And once a tool has been discovered, it stays available for the rest of the conversation, so the model does not pay to search for it again.

What’s next

The work above makes our agentic harness leaner: a higher cache hit rate, fewer tool definitions per request, and less transport overhead. The next step is to move whole classes of work off the main agent entirely. We’re building specialized subagents, and exploring custom-trained ones, for narrow tasks like searching the workspace, running commands, and summarizing results. Each runs on the smallest, cheapest model that can do the job, instead of the main model paying for that work in its own context. The result is a lower overall cost per task.

In addition, we’re working to improve transparency around token usage and cache state in the product. This includes flagging actions that quietly drive up cost, such as resuming a session after a long pause with its cache expired, or changing the reasoning effort in the middle of a session. That way, you can make an informed choice before paying for a cache cold start.

Making the agentic harness more token-efficient is ongoing work, and we’ll keep investing, one small win at a time.

Happy coding! 💙

Use your own language model key in VS Code


June 18, 2026 by Kayla Cinnamon

At Microsoft Build this year, I had the opportunity to present in the opening keynote. One thing I showed was using local models inside VS Code on the new Surface RTX Spark Dev Box. My model was periodically analyzing my log files and giving me summaries, so I could easily diagnose issues without having to look through the logs myself. Check out the recording at 12:18.

Using local models gives you even greater flexibility when working with agents. Sometimes you want the built-in models available through GitHub Copilot. Sometimes you want to try a new model from a provider your team already uses. Sometimes you want to experiment locally. VS Code allows you to do all of these workflows with bring your own language model key (BYOK) and bring your own local model.

With BYOK in VS Code, you can add models from providers like Azure, Anthropic, Huggingface, Gemini, OpenAI, OpenRouter, or you can run a model locally with Ollama, Foundry Local, and more, then use them directly from the Chat model picker.

Screenshot of the VS Code Chat model picker showing available language models.

What is BYOK?

BYOK lets you use a language model from a supported provider by adding your own API key or endpoint configuration in VS Code. Once configured, those models appear in the same Chat model picker you already use for Copilot. Support is built in for several providers and VS Code is extensible, so any model provider can enable support through an extension.

This gives you more choice for chat and agent workflows. For example, you can:

  • Try models that are not built into VS Code.
  • Use a provider your organization already has billing or governance set up for.
  • Connect to local models through providers such as Ollama or Foundry Local.
  • Pick different models for different tasks, such as quick Q&A, planning, or multi-step agent work.

The goal is to allow you to choose the right model and keep working.

What BYOK works with

BYOK models are available for VS Code chat experiences, including agent workflows when the selected model supports the required capabilities.

There are a few important details to keep in mind:

  • BYOK models work without signing into a GitHub account and without a Copilot plan. You can add and use models entirely with your own API keys, including fully offline scenarios with local models.
  • BYOK applies to chat and utility tasks, not standard code completions.
  • Some AI features, such as semantic search, inline suggestions, and features that rely on embeddings, still require a GitHub account or Copilot support.
  • Usage for provider-backed BYOK models is billed directly by that provider and does not count against GitHub Copilot request quotas.
  • For Copilot Business and Enterprise, organization administrators can control BYOK availability through Copilot policy settings.

In other words, BYOK expands model choice in VS Code Chat, but it does not replace every Copilot-powered feature in the editor.

Getting started with BYOK

The easiest way to get started is through the Language Models editor.

You can open it from the Chat model picker by selecting the Manage Language Models gear icon, or you can run Chat: Manage Language Models from the Command Palette.

Screenshot of the Language Models editor in VS Code.

The Language Models editor shows the models available to you, grouped by provider. It also shows useful details like model capabilities, context size, billing information, and whether a model is visible in the picker.

This is also where you can keep the model picker focused. If you are testing several providers, you can hide models you do not use often and keep your day-to-day models easy to find.

Adding models from a built-in provider

If the provider you want is built into VS Code, setup is a few clicks.

  1. Open Chat: Manage Language Models.
  2. Select Add Models.
  3. Choose a provider.
  4. Enter a group name for the models. This is the label shown in the model picker and Language Models editor.
  5. Enter the provider details, such as an API key, endpoint, deployment name, or other required configuration.
  6. Select the model from the Chat model picker.

Screenshot of the model provider picker in VS Code.

Depending on the provider, VS Code might open a chatLanguageModels.json file so you can finish configuring model details.

For example, a Mistral configuration specifies the endpoint URL, API type, and model capabilities:

[
  {
    "name": "Mistral",
    "vendor": "customendpoint",
    "apiKey": "<your-mistral-api-key>",
    "apiType": "chat-completions",
    "models": [
      {
        "id": "mistral-medium-latest",
        "name": "mistral medium",
        "url": "https://api.mistral.ai/v1/chat/completions",
        "toolCalling": true,
        "vision": true,
        "maxInputTokens": 256000,
        "maxOutputTokens": 16000
      }
    ]
  }
]

The exact fields depend on the provider and model. The important part is that after the provider is configured, the model becomes available from the same picker you use for the rest of Chat. For more information, check out the Language Model docs.

Adding models from extensions

VS Code also supports language model provider extensions. These extensions can contribute models directly into the Language Models editor and Chat model picker.

To find provider extensions:

  1. Open the Extensions view.
  2. Search for @tag:language-models.
  3. Install the provider extension you want to use.
  4. Follow the extension’s setup instructions.
  5. Select the model from the Chat model picker.

Screenshot of the Extensions view listing extensions that provide language models.

This extensibility is a big part of the BYOK story. Instead of every provider needing to be hard-coded into VS Code, extensions can bring new model providers into the editor as the ecosystem evolves.

Leveraging utility models

VS Code also uses lightweight models in the background for small tasks like generating chat titles, commit messages, and rename suggestions. These default to built-in Copilot models and most users won’t need to touch them. But if you’re using BYOK without signing into a GitHub account, those defaults aren’t available. VS Code will show a notification in the Chat view prompting you to configure them. Set


chat.utilityModel

and


chat.utilitySmallModel

to one of your BYOK models to keep those features working. A fast, inexpensive model works well here.

Screenshot of the setting for configuring the Chat Utility Model.

Choosing the right model

One of the best parts of BYOK is that you do not have to use one model for everything.

For everyday work, you might choose:

  • A fast model for quick questions, summaries, and small edits.
  • A reasoning model for planning, debugging, or complex refactors.
  • A local model when you want to experiment offline.
  • A provider-specific model when your team already has workflows around that provider.

Simply choose which model you want to use in the model picker below the Chat box.

Screenshot of the VS Code Chat model picker showing available language models.

Try it out

BYOK gives you more flexibility in VS Code without adding more tools to your workflow. You can keep using the built-in Copilot models, add models from providers you already use, experiment with local models, and choose the right model for each task from one place.

To learn more, check out the VS Code docs on AI language models, the VS Code blog post on Expanding Model Choice in VS Code with Bring Your Own Key, and the GitHub changelog entry for BYOK availability in VS Code.

We also have a video for how to Bring Your Own AI… No Sign-In Required!.

We are continuing to improve model choice in VS Code, and your feedback helps shape what comes next. Try BYOK with your workflow and let us know what you think in the VS Code repository.

Happy coding! 💙

Make Visual Studio look the way you want


Themes are personal. Some of us live in dark mode, some swear by high contrast, and some of us have very strong opinions about that one shade of blue from years ago. The new themes in Visual Studio 2026 are built on Fluent, which gives us a much more consistent and accessible foundation, but we have heard from plenty of you who want more control over specific colors. Accent colors, hover states, the line between the shell and the tab headers… the small things that make an IDE feel like yours.

So, we did something about it.

theme color settings image

Visual Studio now has a new Theme colors options page that lets you customize any Fluent color token directly inside the IDE. No extensions, no JSON files to hunt down, no restarts. Just open the page, find the token you want, and pick a new color.

Where to find it

Open it from Tools > Options > Environment > Visual Experience > Theme colors. You’ll see every Fluent color token in the active theme listed in a searchable grid. Pick one, change the color, and the change applies live.

Customizations are per-theme

This is the part we like the most. Whatever you change is saved against the current theme, not globally. So, you can have your own personal twist on Dark, a different twist on Light, and a wildly different one on a tinted theme, and switching between them brings your customizations along automatically.

If you go too far down a rabbit hole, there’s a per-color reset so you can revert a single token without throwing away the rest of your work.

New tokens for more granular control

Alongside the options page, we also added some new color tokens that give you more separation between parts of the shell. The most commonly asked-for one is being able to color the tab and window headers independently from the rest of the shell chrome, which, among other things, lets you get pretty close to a classic retro look if that’s what you’re after.

See all the color tokens in the theme color tokens documentation.

fluent blue theme image

Sharing your customizations

Because customizations are saved as JSON under the hood, they’re easy to share – and easy to apply on top of any theme. Drop a JSON file into:

%LOCALAPPDATA%\Microsoft\VisualStudio\18.0_xxxxxxxx\ColorThemes

…and Visual Studio will use it to override the theme it’s named after. The file name has to match the theme you want to override – so cool-breeze.json overrides Cool Breeze, dark.json overrides Dark, and so on. Restart Visual Studio and the overrides take effect on top of that theme.

Here’s an example set of overrides that leans Cool Breeze in a more retro, blue direction. Save it as cool-breeze.json in the folder above:

[
  {
    "Name": "EnvironmentHeader",
    "Category": "5af241b7-5627-4d12-bfb1-2b67d11127d7",
    "Background": "FFF5CC84"
  },
  {
    "Name": "EnvironmentTab",
    "Category": "5af241b7-5627-4d12-bfb1-2b67d11127d7",
    "Background": "FFF5CC84"
  },
  {
    "Name": "EnvironmentBody",
    "Category": "5af241b7-5627-4d12-bfb1-2b67d11127d7",
    "Background": "FF5D6B99"
  },
  {
    "Name": "EnvironmentBodyText",
    "Category": "5af241b7-5627-4d12-bfb1-2b67d11127d7",
    "Background": "E4FFFFFF"
  },
  {
    "Name": "EnvironmentBackground",
    "Category": "5af241b7-5627-4d12-bfb1-2b67d11127d7",
    "Background": "FFCCD5F0"
  },
  {
    "Name": "EnvironmentHeaderInactive",
    "Category": "5af241b7-5627-4d12-bfb1-2b67d11127d7",
    "Background": "FFCCD5F0"
  },
  {
    "Name": "EnvironmentTabInactive",
    "Category": "5af241b7-5627-4d12-bfb1-2b67d11127d7",
    "Background": "FFCCD5F0"
  },
  {
    "Name": "StatusBarBackgroundFillRest",
    "Category": "5af241b7-5627-4d12-bfb1-2b67d11127d7",
    "Background": "FF40508D"
  }
]

Share that file with a teammate, and they’ll see the same look the next time they launch Visual Studio – no extension to install, no theme to package up.

You can also grab the Blue Steel theme pack that ships with these new colors to mimic the retro blue theme.

Why this matters

Themes used to be an all-or-nothing thing. If you didn’t love one of the built-in options, your only real path was an extension that replaced the entire theme. That’s a lot of overhead for what is often a very small change (“I just want this one color to be a little less bright.”).

The new options page is meant to fix exactly that. Quick, one-off customizations should feel quick. Bigger overhauls still belong in extensions, and the marketplace is full of great ones, but most of the feedback we get is about a handful of specific tokens. Now you can fix those in about ten seconds.

Availability

This is now in latest version of Visual Studio 2026 (18.7). Give it a try, break things in interesting ways, and let us know in the comments what tokens you ended up changing – we’re always curious how people set up their IDEs.

Happy coding!


Review pull requests without leaving Visual Studio


Pull request integration in Visual Studio has been one of the most requested Git features. Developers have been asking for a way to open a PR, inspect the changes, discuss feedback, and finish the review without switching to the browser. The feedback on that request has played a big role in shaping this experience over time.

You’ve been able to create pull requests in Visual Studio since 2024. Now you can also review, comment on, and approve pull requests from both GitHub and Azure DevOps, all without leaving the IDE.

A pull request open in Visual Studio, showing the pull request list, overview, and approve and merge actions

Find and open pull requests

You can view the list of pull requests for the open repository from the Git Repository window, the Git Changes window, or the Git menu. If your current branch already has an active PR, you can also open it directly from Git Changes.

The three pull request entry points in Visual Studio, from the Git Repository window, Git Changes window, and Git menu

When you open a pull request, you can see the overview, changes, commits, and reviewers together in one place. If a teammate asks for a quick review, you can open Visual Studio, find the PR, and get straight to what you need.

From there, you can choose how deep you want to go. You can review the pull request without checking out the branch, which lets you inspect the changes while keeping your current branch, uncommitted changes, and working state intact.

If you want a closer look, you can also check out the PR branch and use Visual Studio’s navigation, build, and debugging tools to dig into the code. Reviewing without checking out is great for a quick pass, while checking out the branch is better when you want to investigate more deeply.

When you’re juggling multiple reviews, you can switch between active pull requests without having to check out all of them. That makes it easier to jump in on reviews during the day, then get back to your own work.

Browse the changes

The pull request view is designed to help you move through a pull request quickly. Open any changed file to see the diff inline or side by side, or use the multi-file summary view to see all changes at a glance.

Tip: If you want a wider view of the diff, collapse the left panel and focus on the code.

You can also review commit by commit, which is useful when a pull request covers several logical steps and you want to understand how the change evolved.

A pull request open in Visual Studio, showing changed files and comments list in the left panel and a file diff on the right

Comment and discuss

You can leave comments on specific lines, reply to threads, and resolve conversations when the discussion is done. Files with active comments are marked in the Changes list, so it’s easy to spot where discussions are happening. Everything syncs between Visual Studio and the browser.

A pull request open in Visual Studio, showing an inline comment thread in the file diff with a reply being drafted

When you’re reviewing a pull request in checked-out code, you can apply a code suggestion directly to your working copy with one click. When there isn’t one, Copilot can generate a fix based on the comment and surrounding code, so you can evaluate and test it right away.

Approve, complete, and merge

When you’re ready to decide, you can see the information you need and act without leaving the review. On the Overview tab, you can see status checks, merge conflicts, and whether any required approvals are still missing. You can approve the pull request from the diff view, with additional vote options for Azure DevOps pull requests.

You can also complete or merge the pull request right in the IDE. If plans change, you can convert it to draft or close it. Once you open the pull request, you can get all the way through the review in one place.

Try pull request review in 18.7

This is a big step forward for pull request review in Visual Studio, but we’re not done. We’re still working on features like comment filtering, a timeline of PR activity, and a smoother checkout flow for deeper review. We’re also keeping a close eye on feedback to figure out what’s next.

The pull request review experience is now available in the June 18.7 stable release. Try it out, and let us know what you want to see next on Developer Community or through our survey at aka.ms/ReviewPR.

Thanks to everyone who shared feedback and tried out pull request review in Insiders along the way. Your feedback helped shape the experience we’re shipping now.


Visual Studio Code 1.125


Follow us on LinkedIn, X, Bluesky


Last updated: June 9, 2026

Welcome to the 1.125 release of Visual Studio Code.

Happy Coding!


June 9, 2026

  • Add the /chronicle command set to the Agent Host, providing session history insights — standup, search, tips, cost-tips, improve, and reindex — directly from chat. #320648

  • Improve the display of file paths in the Agent Host for better readability. #316541

June 8, 2026

  • Enhance the Cache Explorer view to make multi-agent sessions easier to understand and navigate, and to surface more detailed prompt-signature allocation information. #320137

  • Add support for qualified tool names in tool sets. #271589


We really appreciate people trying our new features as soon as they are ready, so check back here often and learn what’s new.