
We’ve all been there: a bug report lands in your inbox with a title like “App crashes sometimes” and zero reproduction steps. Your morning, which was supposed to be spent building new features, is now a forensic investigation. You’re setting scattershot breakpoints, staring at the call stack, and trying to guess what the original reporter was thinking.
Debugging isn’t just about fixing code; it’s about reducing uncertainty. Today, we’re taking a massive leap toward solving that problem by introducing a new, upgraded, guided workflow within our exiting Debugger Agent in Visual Studio.
Ending the “Guessing Game” with a Guided Debugger Loop
Let’s be honest: traditional debugging is full of friction. You manually parse a vague report, hunt for the right file, and spend twenty minutes just trying to see if you’re in the right ballpark. This new workflow flips the script, transforming the Debugger Agent from a chatbot into an interactive partner plugged directly into your live runtime.
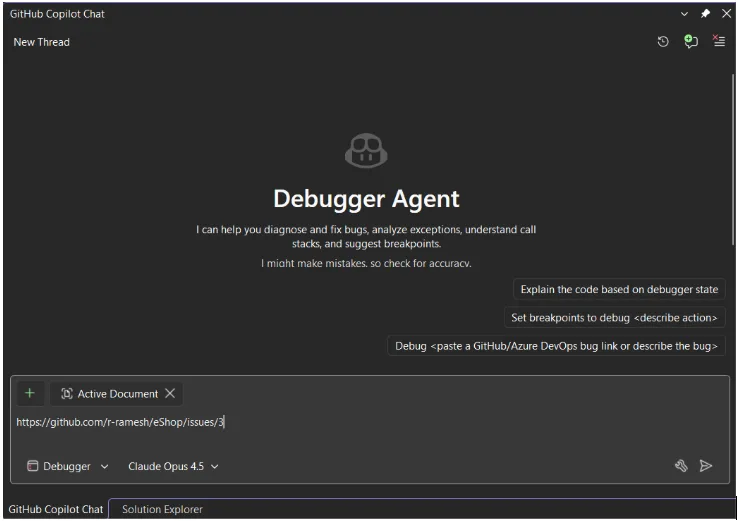
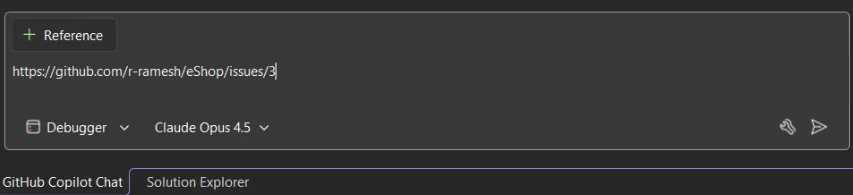
To get started, simply open your solution in Visual Studio, switch to Debugger mode in Copilot Chat, and point it to the problem with a GitHub/ADO URL or a quick sentence like:
“The app crashes when saving a file.”
The workflow is interactive and powered by runtime debugging, meaning the Agent doesn’t just read your code; it feels how it’s running. It immediately builds a mental model of the failure and walks you through a structured, real-time process:
- Hypothesis & Preparation: The Agent analyzes the issue and proposes a root cause. If the reasoning looks solid, it sets intelligent breakpoints and prepares to launch your project.
Note: If your project can’t be started automatically, just manually start your code, attach the debugger, and tell the Agent you’re ready.
- Active Reproduction: The Agent stays “on the line” while you trigger the bug, watching the runtime state as you move through the repro steps.
- Real-Time Validation: As breakpoints hit, the Agent evaluates variables and the call stack to systematically confirm its hypothesis or eliminate potential causes.
- The Final Fix: Once the root cause is isolated, the Agent proposes a solution. If you approve, it applies the fix and reruns the session to validate the resolution.
This iterative flow is designed to keep you “in the zone.” By handling the manual setup and state analysis, the Agent lets you move from a bug report to a verified fix with significantly less mental context switching.
Our Vision: Foundational Quality and Beyond
18.5 GA releases deliver the foundational experience of the guided workflow, specifically optimized for high-value, reproducible scenarios like exceptions, logic inconsistencies, and state corruption.
As we look forward, we are already evolving this foundation to be even more robust. Our goal is to progressively automate the end-to-end workflow, maturing the Debugger Agent into a comprehensive, seamless debugging companion that anticipates your needs.
Debug Smarter, Not Harder
The new workflow in the Debugger Agent represents a fundamental shift in how we think about IDEs. We’re excited to see how you use this in your own workflows whether you’re untangling a complex race condition in a multi-threaded service or simply trying to figure out why a UI element isn’t updating as expected.
Stay connected with the Visual Studio team by following us on Twitter @VS_Debugger, Twitter @VisualStudio, YouTube, and LinkedIn.