Your Data Analytics Team: Challenges of Growing


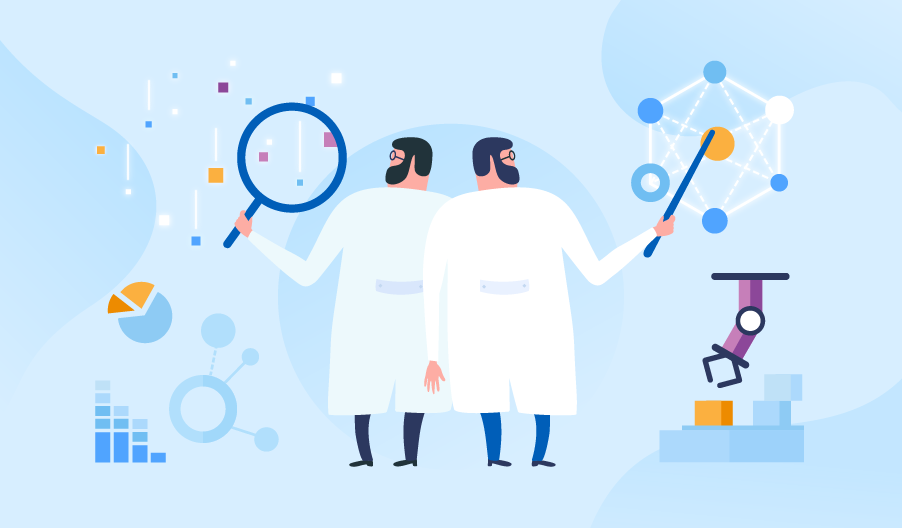
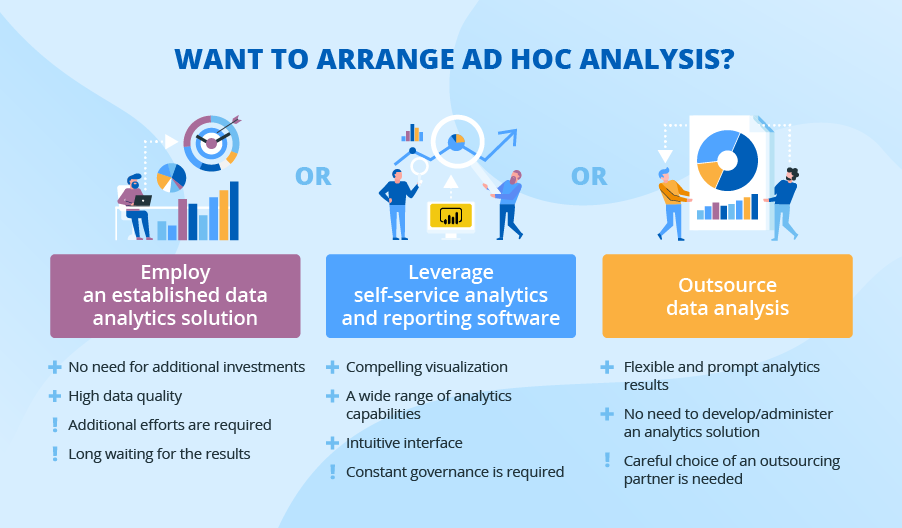
A business has two options if they want to grow their data analytics capabilities: developing an in-house data analytics team or making use of managed analytics services. Multiple companies prefer the traditional first option, believing that growing an in-house team is a safe choice. Undoubtedly, this strategy can be powerful, still it’s associated with certain challenges. Having looked back at my practical experience, I’ve outlined a typical profile of a company growing their in-house analytics team and picked out 3 challenges such companies are likely to face in the process.

A typical profile of a company that is to grow their in-house analytics team

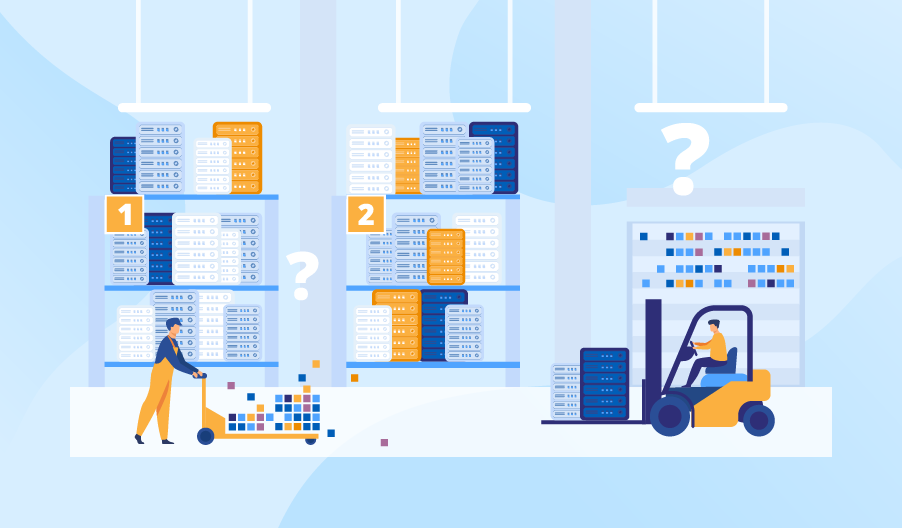
Meet Prod&Sell, a large manufacturer and retailer, which is currently present in 15 states. Although the company has a data analytics team, they lag behind Prod&Sell’s evolving analytics needs. While Prod&Sell’s C-suite and business units expect reliable and timely reporting, self-service and predictive analytics (to name a few things), the analytics team still collects data from disintegrated sources, cleans it and prepares reports manually.

To satisfy the company’s analytical needs, the C-suite opts for creating a business intelligence solution with embedded big data analytics and data science capabilities. Colin, the Head of Prod&Sell’s data analytics, is charged with the task to further develop his department to implement this ambitious project.

Challenges of developing an in-house data analytics team

Here are the challenges that are ahead of Prod&Sell and Colin:

challenges of growing data analytics team

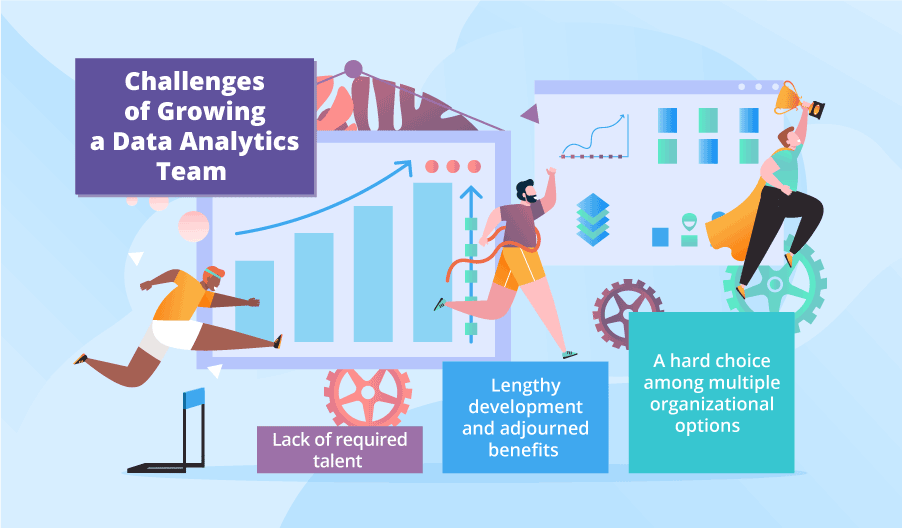
Lack of required talent

First, Colin has to build up a team with mastery in many domains:

  • BI and big data: to design and implement a data lake, a data warehouse, OLAP cubes, reports and dashboards, as well as administer the implemented solution on a daily basis.
  • Data science: to design machine learning models and tune their hyperparameters, train and retrain them, and deal with noise reduction.
  • Data quality and data security: to set up and automate a data quality management process and ensure role-based access to data.
  • Business analysis: to elicit the needs of different business units and departments.

Taking into account that big data and data science skills are in short supply, it will take Colin many months to find all the required roles to fill in the talent gaps.

Lengthy development and adjourned benefits

It may take Prod&Sell about 2 years to develop the solution with all the analytic capabilities they want. This presupposes a long transitional period when the data analytics team will have to split their efforts between continuing with the existing practices and elaborating on new ones. Even if Colin’s team smartly chooses among available software development life cycle models, they will be able just to shorten the transitional period, not to get rid of it. This means that routine tasks will anyway retard the achievement of strategic goals, which seems to make the efforts on the data analytics team development futile. As a result, the C-suite may eventually decide to abandon the idea of further growth.

A hard choice among multiple organizational options

Prod&Sell will have to decide whether their analytics will be centralized or decentralized and, correspondingly, what the place of the altered analytics department will be in the organizational structure (what structural units it should be subordinate to – finance, marketing and sales, or each strategic business unit). Making a strategic mistake at this stage can result in the need for further restructuring and refocusing the analytics department in the future.

But overall, things aren’t that bad

Though the situation the article describes is rather gloomy, by no means I’m trying to dissuade you from developing an in-house analytics team. My message is ‘Be prepared for challenges and elaborate on the ways to overcome them before they happen’. For example, you can invite consultants to cover talent gaps and transfer knowledge or outsource a part of analytics, which promises most of the problems.


Request a ready-to-run service from ScienceSoft to start getting valuable insights within a couple of weeks. Data analytics expertise since 1989.

3 Valuable Data Sources To Consider


The fact that small companies generate less data doesn’t mean big data initiatives should be set aside for them. From our big data services practice, we confirm that small companies are particularly capable of acting quickly on acquired data-driven insights.

big data for small business

However, when starting a big data initiative, you should remember that big data analysis will result in meaningful insights only if appropriate data sources are chosen. And the main concern of a small company is that their limited budget put some restraint on this selection process. To help you choose wisely, our consultants present three insightful internal and external data sources for you to consider.

CRM

CRM systems contain data gathered at each customer “touchpoint” – marketing, sales, and after-sales service. Integrated with various software (website, helpdesk, ecommerce, etc.), CRM becomes a solid foundation where the aggregated all-round customer data is stored. By analyzing this data, you can:

  • Get a 360-degree customer view to deliver a more personalized experience. When you clearly understand your customer journeys across all channels, you can use every opportunity to convert inquiries into sales by enabling your customer-facing employees to make quick informed decisions.
  • Modify your products/services or create new ones that meet customer needs better by analyzing customer complaints, requests for support and cases of returned products.

Your website

Website analytics plays a crucial role in improving your online presence and provides you with insights on how to meet the lead generation goal. With this data source, a big data solution can help you:

  • Tailor your landing pages based on where your visitor traffic comes from.
  • Improve customer journeys by understanding what affects customer behavior and optimizing your website to customer needs.
  • Raise conversion rates through measuring and analyzing current conversion figures and identifying new conversion opportunities.
  • Update your marketing campaigns by assessing their performance.

Social media

Though internal data sources are insightful, analyzing internal data only is not enough even for a small business. If you don’t use this opportunity, you miss out on revealing social trends and outperforming competitors. Social media channels contain a wealth of data that your existing and perspective customers share both intentionally and unintentionally. Social media analytics helps you:

  • Run better influencer marketing and keep up with the trends in your business sphere by identifying customer sentiment.
  • Generate a better strategy to drive your brand recognition through analyzing your customers’ feedback, which opens up an opportunity to convert your followers into customers.

See how small business uses data sources

According to IBM research, 62 % of retailers leverage big data analytics to keep ahead of the competition. Among them are small companies like BaubleBar and Emitations, which deploy big data analytics to stay on top of trends. By tracking customers’ characteristics (demographic, psychographic ones), analyzing their buying behavior and feedback, these accessories brands gain an in-depth insight into the popular choices of their customers. They compare this data with social trends in fashion to identify patterns and correlations that help design their offering and define their marketing strategy.

Be ready to go big data

The global business intelligence and big data analytics market is forecast to grow, making it hard to stay out – the opportunities of big data are tempting.

Are you ready to make the most of your big data? ScienceSoft can help you choose the most suitable option for your big data initiative, be it in-house implementation or outsourcing big data analytics.

Let us define your big data options


Big data is another step to your business success. We will help you to adopt an advanced approach to big data to unleash its full potential.

The ‘What’ And the ‘Why’ of a Big Data Warehouse


Editor’s note: Is ‘a big data warehouse’ just another buzzword for you? Read on to discover the role of the big data warehouse in a big data solution and have a look at ScienceSoft’s offer in big data services to learn how we help our customers leverage big data potential.

ScienceSoft’s experts in DWH services refer to the term ‘big data warehouse’ in their everyday practice. In the article, I’ll explain what they mean by the big data warehouse and how it is different from the traditional (enterprise) DWH.

big data warehouse

Big data warehouse vs. traditional DWH

The big data warehouse is a central storage component of the big data solution’s architecture, and the difference with the traditional DWH lies in:

Data type

The traditional DWH stores homogeneous data only: records from CRM, ERP, etc. The big data warehouse is a universal storage repository: it stores both traditional data and heterogeneous big data – transactional data, sensor data, weblogs, audio, video, official statistics, and others.

Data volume

Enterprise data warehouses cannot deal with a very large volume of data (typically, they store terabytes of data). As for big data warehouses, they allow storing petabytes of data and beyond. Surely, such volumes need proper management, and here we share our experience on how the properly chosen technology stack can tackle this task for our customers.

Do you need to store your ever-growing big data?

ScienceSoft’s team of big data experts is ready to develop and implement your big data warehouse.

Approach to data quality

The traditional DWH demands data to be consistent, accurate, complete, auditable, and orderly.

When speaking of big data quality, it is impossible to meet the above requirements, and, luckily, there is no need to. Data experts set minimal satisfactory thresholds to refine data in the big data warehouse to the ‘good-enough’ state. These thresholds vary depending on a particular task. Let’s take requirements for big data completeness, for example. When analyzing shopping trends in social media, the 100%-data completeness is not really needed – we can define customer sentiment during the autumn season without the two-day amount of data. However, in case of IoT analytics in oil and gas, – the minimal satisfactory thresholds will be higher, as without the two-day amount of data you can miss some important patterns, which can result in machinery breakdowns or oil spillages.

Technology stack

Among the technologies utilized in the traditional DWH are Microsoft SQL Server, Microsoft SSIS, Oracle, Talend, Informatica, etc.

The big data warehouse employs specific technologies that can deal with storing huge volumes, close-to-instant streaming and parallel processing of big data: HDFS, Apache Cassandra, HBase, Amazon RedShift, Apache Spark, Hadoop MapReduce, Apache Kafka, etc.

Insights

The big data warehouse architecture allows advanced AI-based analytical technologies like machine learning. By analyzing big data from multiple sources, companies can have deeper insights on enhancing business processes, make accurate predictions and generate prescriptions.

The enterprise data warehouse also employs analytics, but due to the limited amount of stored data, the above-mentioned advanced technologies, which are very data-hungry, cannot be embraced to the fullest. Thus, the analytics results only describe what happened and diagnose the reason for the outcome.

Data access

Although both DWH types pursue the common goal – delivering intelligence to decision-makers, the big data warehouse goes further as it allows rapid reporting to be available across the organization. That way, the insights are granted to a larger number of decision-makers.

It’s time to go big data

A big data solution can’t go without a big data warehouse. What is more, you may need to have it augmented with a data lake. However, if you don’t feel like diving into technical details on the way to your big data solution that addresses your business objectives, you are welcome to ask ScienceSoft’s team for a customized solution.


Big data is another step to your business success. We will help you to adopt an advanced approach to big data to unleash its full potential.

Big Data Analytics in the Energy Sector


Editor’s note: Big data analytics has already taken root in the energy industry. In this article Alex Bekker, Head of Data Analytics Department at ScienceSoft, describes how exactly big data analytics can drive value in the electric power sector. In case you’re one of those considering the launch or improvement of a big data solution, you are welcome to explore ScienceSoft’s offering in big data services.

Electric utilities go for smart grids with advanced metering infrastructure and big data capabilities to get strategic insights that would foster efficient energy use. Based on the experience gained from our cooperation with electric utilities, I will show you three practical examples of how big data analytics augments the energy industry.

big data analytics in the energy industry

Fault detection and predictive maintenance

It’s not news that failures in the energy industry equipment may result in catastrophic power blackouts and vast sums of money spent on new assets, restoration works and energy losses. To avoid or minimize such outcomes, I advise developing an efficient equipment monitoring and predictive maintenance approach, the key technologies of which are smart meters and big data. As well as sensors, whose operating principle is described by my colleague, Alex Grizhnevich, in the article dedicated to IoT-based predictive maintenance, smart meters generate all kinds of equipment state data to communicate disturbances, their localization and fault types to the utility in real time. It allows electric utilities to employ advanced big data technologies to detect disturbances early enough to avoid breakdowns and costly downtimes.

Do you want to benefit from predictive maintenance to extend energy equipment’s lifespan and avoid costly breakdowns?

ScienceSoft’s experts can share our proven big data best practices to help you avoid unplanned downtimes due to equipment failures.

Electric power quality

Electric power quality influences the safe operation of a power grid and consumers’ satisfaction. Fortunately, big data software goes far beyond detecting disturbances a posteriori. For example, we at ScienceSoft offer our customers to implement continuous power quality monitoring to create “an early warning system” empowered with deep learning and pattern recognition algorithms. With this system, you can analyze all the information related to power quality, detect and classify deviations from the norm appearing in power grids quickly and accurately. Once the deviation is classified, it is possible to determine its causes and take measures to prevent it, avoiding downtimes and production losses.

Load management

Advanced big data analytics methods enable accurate load forecasting, which is the basis for effective energy management. Here, let me set an example of how data science can help electric utilities forecast the load and save the investments. To enable that, they partition the geographical area according to local weather information and use data from smart meters. Smart meters, constantly collecting data, feed the AI technologies with data to identify consumers’ typical behavior, match behavior patterns with historical data on weather conditions and make accurate predictions about customers’ real-time behavior under certain weather conditions. And utilities are not the only ones to win in this situation: in combination with in-home displays and programmable communicating thermostats, electric power users obtain the information that can encourage them to initiate a change in the energy consumption, which advances the era of conscious energy consumption.

It’s time to secure the energy gains!

Considering the benefits that predictive maintenance, power quality monitoring and load management bring into the energy industry, many electric utilities have already leveraged big data analysis. The use cases I’ve outlined here are by no means exhaustive. If you’d like to learn more about the value, which big data analytics may bring, you are welcome to explore the overview prepared by my former colleague Olga Baturina.

A big data journey may be long and full of risks to overcome. But I’m convinced, with the right strategy at hand, the result is always worth it. If you are not sure where to start or think your current big data solution leaves something to be desired, ScienceSoft’s data analytics team will be glad to help, just let us know.


Big data is another step to your business success. We will help you to adopt an advanced approach to big data to unleash its full potential.

What and How to Track to Boost Your Sales Performance


Editor’s note: In the article, Irene explains why measuring sales performance is so important for sales growth and shares three examples of how a company can facilitate this process. If you feel that you need assistance with your sales analytics, consider turning to ScienceSoft’s data analytics consulting services.

Out of major industries, retail is one of the most susceptible to changing consumer needs and the dynamic economic environment. To meet your sales goals month after month in such circumstances, you need to constantly assess your company’s performance and make quick adjustments.

In this article, I’ll share with you some examples of sales metrics you need to track to stay in the know about your sales performance and three options to facilitate their analysis.

What sales metrics to analyze?

Sales metrics are quantifiable measures that help you assess the effectiveness of a salesperson, a sales team, the whole organization (sales productivity metrics), the sales process or its aspect (sales performance metrics) against set objectives.

Due to the abundance of all-rounded sales data, many of ScienceSoft’s clients face the dilemma of which sales metrics they need to track when there are dozens available. As analyzing the right metrics is crucial for spotting critical information about your sales process, I advise companies to carefully choose individual KPIs based on their industry and short-term and long-term business goals.

Among the common sales metrics I usually recommend tracking are:

This sales performance measurement shows the percentage of leads that convert into customers, and it is used for forecasting your revenue objectives. The conversion rate also measures the effectiveness of your sales activities: if the win rate is increasing with the same or higher number of closed deals, sales team performance is improving.

To calculate the average deal size, you have to divide the total revenue from the closed deals by the number of those deals. This metric is particularly important for those companies who plan to move upmarket – the bigger the deal size, the closer they are to enterprise-level contracts.

To understand the profitability of a sale, you should calculate your sales-to-cost ratio. For that, you compare the revenue you earn from the deal to the cost of acquiring it. Should you find out that the revenue you earn from securing a deal is only enough to cover the expenses, some urgent actions are required – searching for the ways to reduce costs, shortening your sales cycle, rethinking your target market, etc.

Your sales funnel consists of a certain number of stages, each of which can lead to winning or losing a sale. Only by monitoring your stage-by-stage conversion, you’ll be able to define at which stage your leads are likely to quit business with you. The quicker you define and eliminate weak points in your conversion funnel, the higher your win rate will be.

How to track and analyze sales metrics?

options for sales metrics analysis

When the key sales metrics to analyze are defined, the challenge arises to provide business users with seamless and timely access to their analysis. For that, you have to develop an effective sales analysis environment and get the right software in place. Here are some common in-house options:

Among Excel advantages, I may point out its sufficiency as a personal solution for analyzing historical data, plus it is affordable and comparatively easy to master. However, the tool is not effective for collaboration and forecasting. What is more, all the information has to be entered into Excel manually, which is extremely time-consuming and can result in numerous errors. Consequently, the accuracy of the analysis will be greatly impaired.

  • Analytics capabilities of your CRM/sales management tool

A CRM system compiling all-rounded information about your customers from a variety of sources can help you derive actionable insights crucial for achieving your sales goals. For example, you can learn which communication channels bring more value, the cost of acquiring customers, best up-selling and cross-selling opportunities, and much more. But to be fair, not every CRM software is capable of that. Your CRM can be considered effective for sales analysis if it has:

  • Vast analytical capabilities that facilitate customer segmentation to optimize marketing and sales processes, forecast challenges approaching through the sales pipeline, etc.
  • Powerful integration capabilities to connect to data sources (ecommerce platform, social media, store software, etc.) needed for conducting comprehensive sales analysis.
  • Setup data management procedures to ensure high data quality.
  • Intuitive visualization to allow getting a visual snapshot of the metrics.

For a real-life example of utilizing CRM capabilities for sales analytics, have a look at one of our projects, in which ScienceSoft implemented and customized a CRM system to allow a multibusiness company to gain greater visibility into daily operations.

Not Sure About the Most Feasible Way to Conduct Sales Analysis?

ScienceSoft’s experts are ready to evaluate your existing analytical environment to define your best sales analytics solution.

  • Self-service business intelligence solution

With a well set-up and tuned self-service BI solution, you get:

  • A central repository of aggregated and cleansed sales data from integrated corporate applications, as well as from external data sources. That way, you can connect to all data required for getting a holistic view of the whole sales cycle.
  • Profound analytical capabilities powered by data science and machine learning, which are applied to your sales data to find the answers to most deliberate questions. Besides understanding the reasons behind certain sales performance, you can get detailed recommendations on how to enhance the performance of your sales team, what stages of your sales pipeline require immediate adjustments, and what corrective actions to your sales funnel will bring maximum ROI.
  • Self-service visualization and reporting functionality, which bring sales analytics at your fingerprints. With informative and easy-to-digest reports and dashboards, you can track your key sales metrics in real time to conduct benchmarking, define hurdles to hitting your sales quota and obtain insights into how to improve your sales team’s performance and the whole sales process. To see how it works in practice, watch our BI demo.

The key to successful selling

I’m sure that the key to remaining competitive on the market with timely and accurate decisions is the right analytics solution. The article outlined some of the in-house solutions for tracking and analyzing sales metrics. But surely, an in-house solution is not the only way to go. If having an analytics solution inside your organization is not an option, you can always opt for outsourcing. If you feel that you need help with defining your most fitting sales analytics option, don’t hesitate to reach out to ScienceSoft’s consultants.


Are you striving for informed decision-making? We will convert your historical and real-time data into actionable insights and set up forecasting.

2 Main Types of Data Scientists


Editor’s note: Desperately searching for data science talent? ScienceSoft’s data science consultants are ready to help you both in word and deed. Read on to learn what types of data scientists we differentiate and get the required competence from us.

Let’s face reality: data science unicorns do not exist. If you are searching for a data scientist who can do anything from defining your data science-related business needs regardless of the field you operate in to building a complex deep neural network with the same mastery, you are at high risk of never finding such a person. In data science, specializations rule.

With that, you can find numerous approaches to classifying data scientists, which can include from 2 to more than 10 data science jobs/specializations. At ScienceSoft, we also distinguish among different types of data scientists having a professional data science team on board. Still, being committed to keeping things simple, we recognize just 2 types of data scientists: analysts and technicians. Let’s get to know their core responsibilities better.

types of data scientists

Data scientists – analysts

Data scientists – analysts are proficient in translating business needs into the design of data science solutions, as well as interpreting the findings achieved with the help of these solutions back to the business. To do this successfully, they should have a solid grasp of industries they serve, as well as domain knowledge like supply chain management, predictive maintenance, and quality management.

The core responsibilities of data scientists – analysts are:

  • Analyzing business needs that require data science, like forecasting, optimization, root cause analysis.
  • Managing the quality of raw data.
  • Preparing the data required to train a machine learning model (for example, augmenting data and reducing noise).
  • Defining factors that influence the accuracy of predictions (for example, defining that for the purpose of demand forecasting, a machine learning model should analyze latest sales trends, seasonality, patterns specific to each SKU, as well as the influence of promotions).
  • Exploring data and interpreting results (i.e., making sure that the model differentiates signals from noise).
  • Building reports and dashboards to visualize the analysis findings.

To get a real feel about the work this type of data scientists performs, check out one of the projects from ScienceSoft’s portfolio that illustrates their competence: Data Science for an Automated Trading System.

Is This the Data Science That You Envisaged for Your Business?

Reach out to ScienceSoft to drive your decision-making with careful forecasting and effective root-cause analysis. Data science consulting services since 1989. 

Data scientists – technicians

Data scientists – technicians are adept at converting a data science concept into a robust solution. They work with mathematical formulas and code, making machine learning algorithms consume data and produce the relevant output. For example, in one of ScienceSoft’s latest data science blog posts, our Head of Data Analytics Department explained in detail how a deep learning model predicts the optimal inventory level based on historical sales data.

The core responsibilities of data scientists – technicians are:

  • Choosing the optimal machine learning algorithm among the available options.
  • Designing and implementing machine learning (including deep learning) models.
  • Choosing relevant activation and optimization functions.
  • Tuning the models’ hyperparameters.
  • Training and retraining the models.

Check a real-life project from ScienceSoft’s practice to see how our data scientists designed and implemented a convolutional neural network to enable automated medical diagnostics: Development of a Brain Tumor Localization Application.

No need to choose between the 2 types. Get both!

ScienceSoft has gathered a pool of data science professionals (both analysts and technicians) who are ready to drive and back up the improvements that your business longs for, no matter the area. With us, you’ll be able to increase your production efficiency and sales effectiveness, optimize your supply chain, predict customer behavior, and offer your customers with an impeccable experience. If you are still in doubt as to which type of data scientists your business needs, hesitate no more! ScienceSoft’s projects show that our customers needed the competence of both roles.

Explore Our Data Science Offer


Bringing data science on board is promising, yet difficult. We’ll solve all the challenges and let you enjoy the advantages that data science offers.

PepsiCo’s competitive strategy turned into KPIs


In 2016, PepsiCo launched their 2025 Sustainability Agenda, a detailed overview of PepsiCo’s business model that was to focus on “products, planet and people”. PepsiCo supported each of the strategic goals with KPIs and defined targets for them. Recently, the company published their Q2 2017 results, at which we will look from the perspective of BI consulting.

PepsiCo's strategy translated into KPIs

PepsiCo’s KPIs to build the portfolio of healthier products

We’ll focus on one of the pillars of 2025 Sustainability Agenda – PepsiCo’s healthier product portfolio. Here is how this strategic initiative is expressed in KPIs and relevant goals that the company aims to reach by 2025:

Target KPI Goal
Reduce added sugar Share of Pepsi’s global beverage portfolio volume that has 100 calories or fewer from added sugars per 12-oz. serving 2/3
Reduce saturated fat Share of Pepsi’s global portfolio volume that does not exceed 1.1 grams of saturated fat per 100 calories 3/4
Reduce salt Share of Pepsi’s global foods portfolio volume that does not exceed 1.3 milligrams of sodium per calorie 3/4

These KPIs are specific, measurable, relevant and time-bound. In other words, they are in line with the well-known SMART approach. However, will these KPIs contribute to the company’s success?

Can PepsiCo boast of its success?

If at first PepsiCo’s decision to differentiate and to offer healthier products might have cast some doubts upon sceptics, the doubts should have lessened after PepsiCo published their Q1 2017 results. Recently, the company announced the Q2 2017 results showing organic revenue growth of 3.1%.

Can now business intelligence consulting practitioners add PepsiCo to the list of best practice examples of how to successfully translate a corporate strategy into KPIs? So far, it seems too early for that. Pepsi’s efforts to make their product portfolio healthier are evident: the company divided their brands into good-for-you and fun-for-you categories, as well as adopted the practice of indicating product content clearly on packaging. Still, it’s difficult to say how much PepsiCo progressed in achieving their KPIs.

Undoubtedly, PepsiCo oversees how they advanced in KPIs. What’s more, the company signed an agreement with Partnership for a Healthier America to monitor their progress against previously outlined goals. However, the results have not been published yet.

So far, we can suppose that good financial results and the progress in KPIs are interrelated, as in April 2017, the company reported that more than 45% of PepsiCo’s revenue had come from its “guilt-free” beverage and snack division. “Guilt-free”, a term that refers to PepsiCo’s product portfolio, means beverages with fewer than 70 calories per 12 oz. and snacks with lower amounts of salt and saturated fat.

To sum it up

PepsiCo’s corporate strategy, targets and KPIs are transparent and clear. However, half-year results are not sufficient to state that PepsiCo’s efforts to satisfy the needs of health-conscious customers are paying off. We’ll keep track on this topic in our Business Intelligence blog to finally understand if PepsiCo’s case is a good example of translating the corporate strategy into KPIs.


We offer BI consulting services to answer your business questions and make your analytics insightful, reliable and timely.

The Complete Guide to Data Warehouse


A data warehouse (DWH) is a centralized repository of data integrated from one or more data sources. The main two approaches used to integrate data into the data warehouse are Extract, Transform, Load (ETL) and Extract, Load, Transform (ELT). The data warehouse is a core component of business intelligence, which enables structured data storing, reporting and analysis.

The DWH implementation and management can be assigned to either a company’s in-house IT team or a professional consultancy. There is also a possibility to eliminate the burden of DWH design, implementation, maintenance and support by opting for DWaaS.

data warehouse

Interested In Getting a DWH Solution?

ScienceSoft’s team can help you integrate and securely store your data under one roof and facilitate company-wide analytics.

Data warehouse fundamentals

See the benefits your company can obtain by moving your DWH to the cloud, integrating big data into the DWH and turning to DWaaS.

Get insight into data warehouse price components and the ranges of DWH costs.

Explore a step-by-step guide to risk-free data warehouse development.

Check out what architectural approaches are employed to design a data warehouse and choose a beneficial DWH structure for your business.

Find out the definition and purpose of a big data warehouse and what benefits it brings to the decision-making process.

Learn about the difference and synergy between a data lake and a data warehouse, and define how to structure your big data solution in accordance with your business needs.

Data warehouse project examples

ScienceSoft implemented a big data warehouse and analytics solution to allow a market research company to cope with the continuously growing amount of data and conduct faster big data analysis.

ScienceSoft designed and implemented a data warehouse and data analytics solution to enable the customer to collect data (including big data) from multiple data sources and get valuable insights into customer behavior.

ScienceSoft delivered a DWH and analytics solution to allow the customer integrate data from multiple applications specific to their business directions and optimize business processes with company-wide analytics.

ScienceSoft implemented a DWH as a part of a BI solution to allow the customer consolidated disparate data sources under one roof and embrace company-wide reporting.


Since 2005, ScienceSoft advises on, develops, migrates, and supports your data warehouse. We can also provide a data warehouse as a service on a subscription fee basis.

IoT and Big Data: Challenges and Applications


With the evolvement and development of IoT, the whole range of all imaginable things and industries becomes smarter: smart homes and cities, smart manufacturing machinery, connected cars, connected health and more. Countless things empowered to collect and exchange data are forming a totally new network – internet of things – the network of physical objects that can gather data in the cloud, transmit data and fulfill users’ tasks.

big data in IoT

IoT and big data are right on the way to their hour of triumph. Still, there are some peculiarities and pitfalls to keep in mind to benefit from this innovation. In this article, we are happy to share the knowledge we’ve mined with the years in IoT consulting.

How IoT big data can be applied

First of all, there are various ways to get benefits from IoT big data: in some cases, it’s enough to get by with quick analysis, while some valuable outcomes are available only after deeper data processing.

how big data can be applied in IoT

Real-time monitoring. Big data gathered by connected devices can be used in real-time operations: measure temperature at home or in the office, track physical activities (count steps, monitor movements) and more. Real-time monitoring is highly used in healthcare (for example, to take heart rate, measure blood pressure, sugar). It’s also successfully applied in manufacturing (to control production machinery), agriculture (to monitor cattle and plants) and other industries.

Data analysis. Processing IoT-generated big data, there is the opportunity to go beyond monitoring and get valuable insights from these data: identify trends and tendencies, reveal unseen patterns and find hidden information and correlations.

Process control and optimization. Data that comes from sensors gives additional context to reveal non-trivial issues affecting performance and optimize processes.

  • Traffic management: tracking traffic load in various dates and times to work out the recommendations aimed at traffic optimization (for example, increase the number of trains and buses at certain time periods, see if it’s profitable, advise on introducing new schemes of traffic lights and building new roads to make some streets less busy and manage traffic congestions).
  • Retail: as some goods are almost over in a shopping place, supermarket’s personnel is informed about it, for example, to refill shelves with merchandise.
  • Agriculture: water plants when it’s necessary according to sensors’ data.

Predictive maintenance. The data collected with connected devices can be a reliable source to predict risks, proactively identify potentially dangerous conditions, for example:

  • Healthcare: monitoring patients’ state and identifying risks (for example, which patients are at risks of diabetes, heart attacks) to take timely measures.
  • Manufacturing: predicting equipment failures.

Not all IoT solutions need big data. It should be also noted, that not all IoT solutions require big data (for example, if an owner of a smart home is going to switch off the light with the help of mobile phone, this operation may be performed without big data). It’s important to consider reducing efforts on processing dynamic data and avoid huge storages of the data, which will not be needed in the future.

Big data challenges in IoT

Huge volumes of data are totally useless, unless they are processed to get something valuable. Also, there are various challenges connected with data collecting, processing and storing.

big data challenges in IoT

Data reliability. Although big data is never 100% accurate, it’s important to be sure before analyzing data that the sensors function properly and the quality of the data coming for analysis is reliable and not spoiled with various factors (for example, unfavorable environment in which machinery operate, breakdowns in sensors).

Which data to store. Connected things generate terabytes of data, and it’s a demanding task to choose which data to store and which to drop. What is more, the value of some data is far not on the surface, but you may need this data in the future. And if you decide to store the data for the future, the challenge is to do it with minimal costs (as soon as data storing and processing are rather expensive).

Analysis depth. As soon as not all big data is important, another challenge appears: when is it enough to get by with quick analysis and when deeper analysis can bring more value.

Security. There is no doubt that connected things in various sectors can make our life better, but, at the same time, there are very important concerns about data security. Cyber criminals can get access to data centers and devices, connect to traffic systems, power plants, factories, steal personal data from telecom operators. IoT big data is a relatively new phenomenon for security specialists, and the lack of relevant experience increases security risks.

Big data processing in an IoT solution

In IoT systems, data processing components of an IoT architecture vary depending on the peculiarities of incoming data, expected outcomes and more. We’ve worked out our own approach to processing big data in IoT solutions.

Big data processing in IoT

Data comes from sensors connected to things. A “thing” can literally be any object: an oven, a car, a plane, a building, an industrial machine, rehabilitation equipment. Data comes either periodically or in streaming. The latter is essential for real-time data processing and managing things promptly.

Things send the data to gateways which ensure initial data filtering and preprocessing reducing the volume of data transferred to the next IoT system’s blocks.

Edge analytics. Before deep data analysis, it makes sense to conduct data filtering and preprocessing to select most relevant data needed for certain tasks. Also, this stage ensures real-time analytics to quickly recognize useful patterns found earlier by deep analysis in a cloud.

Cloud gateway is necessary for basic protocol translation and communication between different data protocols. It also enables data compression and secure data transmission between a field gateway and central IoT servers.

Data generated by connected devices is stored in its natural format in a data lake. Raw data comes to a data lake with “streams”. The data is kept in a data lake until it can be used for business purposes. Cleaned and structured data is stored in a data warehouse.

Machine learning. The machine learning module generates the models based on previously accumulated historical data. These models are regularly (for example, once in a month) updated with new data streams. Incoming data is accumulated and applied for training and creating new models. When these models are tested and approved by specialists, they can be used by control application which send commands or alerts in response to new sensor data.

To sum it up

IoT generates a lot of big data which can be used for real-time monitoring, analytics, process optimization and predictive maintenance, just to name a few. However, it should be kept in mind that getting valuable insights from huge volumes of data in various formats is not a trivial task: you need to be sure that sensors work properly, the data is securely transmitted and effectively processed. What is more, there is always a question: which data is worth storing and processing (as soon as both these processes are rather expensive).

Despite of potential problems listed above, it should be kept in mind that IoT development gains momentum and helps businesses across multiple industries open new digital opportunities.


From roadmapping to evolution – we’ll guide you through every stage of IoT initiative!

Ad Hoc Reporting and Analysis to Get Quick Answers to Burning Questions


Editor’s note: In this article, Marina showcases the specifics of ad hoc reporting and analysis and shares the three options to gain its capabilities. In case you want to leverage ad hoc reporting and analysis in your business, you are welcome to consider ScienceSoft’s business intelligence services.

The constantly changing business environment requires making fact-based decisions on the fly. Addressing this challenge, ad hoc analysis and reporting becomes a necessity for companies who seek ways to operate efficiently in any unstable conditions. So, let’s find out how ad hoc analysis and reporting can help you provide your business users with the answers to their questions requiring quick action and gain a competitive advantage over your competitors.

Ad hoc analysis vs. regular analysis

Regular or repeating analysis presupposes reports and dashboards that are viewed on a regular basis by business users. Once some analytics software is set up to answer a range of predefined questions, no additional efforts, like data sources integration, are needed.

In its turn, ad hoc analysis is data analysis conducted on demand to promptly answer particular questions that cannot be answered with regular reports.

Ad hoc analysis may be triggered by a variety of reasons, including:

  • The need for more detailed information about the aspects reflected in regular reports (for example, learning about the sales of some particular product when your regular reports provide data on the whole product line).
  • Getting valuable insights on specific issues, usually in response to some peculiar event – say, a sudden drop in sales.
  • Proof of concept for new types of regular reports.

How to organize ad hoc analysis and reporting

ad hoc analysis and reporting

Generally, there are three ways to arrange ad hoc analysis:

Employ an established data analytics solution

If you have a centralized analytical solution, you can already carry out ad hoc analysis with existing software. Still, the following steps should take place to enable that:

  • Defining report requirements.
  • Deciding on what data sources to integrate to conduct the analysis.
  • Performing the required data management procedures – data cleansing, grouping, modeling, etc.
  • Reporting data in an easy-to-digest format.

Among this option’s benefits are the absence of additional investments and ensured high data quality in case of proper data management procedures arranged in your company.

However, you can see that ad hoc analysis requires additional efforts in this case. Consequently, business users may wait for the analytical results from 1 hour to two weeks, depending on the employed analytical solution, the report complexity, the data management procedures, and much more. So, I consider this approach inefficient in today’s business environment because of the two main reasons:

  • Business users aren’t self-sufficient – they have to address third parties to perform the analysis – the IT department, data analysts or data scientists (depending on the analysis complexity).
  • Potential delays in obtaining analytics results – ad hoc reports can be gained too late to take advantage out of the insights.

Leverage self-service analytics and reporting software

The second option is to adopt self-service analytics and reporting software. The implementation of such reporting tools, for example, Microsoft Power BI or Tableau, can empower business users in your company to get analytics insights and present them in a visual format without burdening your IT staff and data analysts. Among self-service software benefits are:

Analytics results are presented in the form of informative and easy-to-digest reports, spreadsheets and dashboards with charts, tables, etc. To see the visualization capabilities of self-service analytics software in detail, watch our BI demo.

  • A wide range of analytics capabilities

Self-service software usually has a set of basic analytical features for beginners and more advanced capabilities for competent users.

Thanks to such functionality as drag and drop, drill-down, natural language processing, etc., self-service software is rather easy to master.

However, you should remember that a self-service analytical solution with ad hoc capabilities requires constant governance to ensure data security, data accuracy and consistency, and high quality of data analytics results.

Ready to Speed Up Your Decision-Making?

ScienceSoft will implement/upgrade your data analytics solution with self-service capabilities or become your data analytics vendor to help you benefit from ad hoc analysis and reporting.

Outsource data analysis

The last option from the list is to outsource your data analysis to a vendor. It may be a one-time data analysis or continuous engagement with an agreed number of ad hoc reports of specified complexity on a subscription fee basis.

The advantages of this option are quite obvious – you obtain flexible and prompt analytics results with no need to develop or administer an analytics solution. However, to reap the above benefits, you have to carefully choose your outsourcing partner. If you need to dig deeper into this issue, check out the overview of data analytics outsourcing written by my colleague Irene Mikhailouskaya. There she covers typical concerns, such as data security, when outsourcing data analysis and gives tips on how to proactively deal with them.

Your business users can have the answers to all their questions promptly!

With the capabilities of ad hoc analysis and reporting, you can streamline your decision-making, increase operational efficiency, and gain flexibility in the ever-changing business environment. If you feel like obtaining these benefits but can’t choose among the options I’ve listed above or need help with their implementation, you can always resort to ScienceSoft’s help.


Are you striving for informed decision-making? We will convert your historical and real-time data into actionable insights and set up forecasting.