The Complete Guide to Data Warehouse


A data warehouse (DWH) is a centralized repository of data integrated from one or more data sources. The main two approaches used to integrate data into the data warehouse are Extract, Transform, Load (ETL) and Extract, Load, Transform (ELT). The data warehouse is a core component of business intelligence, which enables structured data storing, reporting and analysis.

The DWH implementation and management can be assigned to either a company’s in-house IT team or a professional consultancy. There is also a possibility to eliminate the burden of DWH design, implementation, maintenance and support by opting for DWaaS.

data warehouse

Interested In Getting a DWH Solution?

ScienceSoft’s team can help you integrate and securely store your data under one roof and facilitate company-wide analytics.

Data warehouse fundamentals

See the benefits your company can obtain by moving your DWH to the cloud, integrating big data into the DWH and turning to DWaaS.

Get insight into data warehouse price components and the ranges of DWH costs.

Explore a step-by-step guide to risk-free data warehouse development.

Check out what architectural approaches are employed to design a data warehouse and choose a beneficial DWH structure for your business.

Find out the definition and purpose of a big data warehouse and what benefits it brings to the decision-making process.

Learn about the difference and synergy between a data lake and a data warehouse, and define how to structure your big data solution in accordance with your business needs.

Data warehouse project examples

ScienceSoft implemented a big data warehouse and analytics solution to allow a market research company to cope with the continuously growing amount of data and conduct faster big data analysis.

ScienceSoft designed and implemented a data warehouse and data analytics solution to enable the customer to collect data (including big data) from multiple data sources and get valuable insights into customer behavior.

ScienceSoft delivered a DWH and analytics solution to allow the customer integrate data from multiple applications specific to their business directions and optimize business processes with company-wide analytics.

ScienceSoft implemented a DWH as a part of a BI solution to allow the customer consolidated disparate data sources under one roof and embrace company-wide reporting.


Since 2005, ScienceSoft advises on, develops, migrates, and supports your data warehouse. We can also provide a data warehouse as a service on a subscription fee basis.

IoT and Big Data: Challenges and Applications


With the evolvement and development of IoT, the whole range of all imaginable things and industries becomes smarter: smart homes and cities, smart manufacturing machinery, connected cars, connected health and more. Countless things empowered to collect and exchange data are forming a totally new network – internet of things – the network of physical objects that can gather data in the cloud, transmit data and fulfill users’ tasks.

big data in IoT

IoT and big data are right on the way to their hour of triumph. Still, there are some peculiarities and pitfalls to keep in mind to benefit from this innovation. In this article, we are happy to share the knowledge we’ve mined with the years in IoT consulting.

How IoT big data can be applied

First of all, there are various ways to get benefits from IoT big data: in some cases, it’s enough to get by with quick analysis, while some valuable outcomes are available only after deeper data processing.

how big data can be applied in IoT

Real-time monitoring. Big data gathered by connected devices can be used in real-time operations: measure temperature at home or in the office, track physical activities (count steps, monitor movements) and more. Real-time monitoring is highly used in healthcare (for example, to take heart rate, measure blood pressure, sugar). It’s also successfully applied in manufacturing (to control production machinery), agriculture (to monitor cattle and plants) and other industries.

Data analysis. Processing IoT-generated big data, there is the opportunity to go beyond monitoring and get valuable insights from these data: identify trends and tendencies, reveal unseen patterns and find hidden information and correlations.

Process control and optimization. Data that comes from sensors gives additional context to reveal non-trivial issues affecting performance and optimize processes.

  • Traffic management: tracking traffic load in various dates and times to work out the recommendations aimed at traffic optimization (for example, increase the number of trains and buses at certain time periods, see if it’s profitable, advise on introducing new schemes of traffic lights and building new roads to make some streets less busy and manage traffic congestions).
  • Retail: as some goods are almost over in a shopping place, supermarket’s personnel is informed about it, for example, to refill shelves with merchandise.
  • Agriculture: water plants when it’s necessary according to sensors’ data.

Predictive maintenance. The data collected with connected devices can be a reliable source to predict risks, proactively identify potentially dangerous conditions, for example:

  • Healthcare: monitoring patients’ state and identifying risks (for example, which patients are at risks of diabetes, heart attacks) to take timely measures.
  • Manufacturing: predicting equipment failures.

Not all IoT solutions need big data. It should be also noted, that not all IoT solutions require big data (for example, if an owner of a smart home is going to switch off the light with the help of mobile phone, this operation may be performed without big data). It’s important to consider reducing efforts on processing dynamic data and avoid huge storages of the data, which will not be needed in the future.

Big data challenges in IoT

Huge volumes of data are totally useless, unless they are processed to get something valuable. Also, there are various challenges connected with data collecting, processing and storing.

big data challenges in IoT

Data reliability. Although big data is never 100% accurate, it’s important to be sure before analyzing data that the sensors function properly and the quality of the data coming for analysis is reliable and not spoiled with various factors (for example, unfavorable environment in which machinery operate, breakdowns in sensors).

Which data to store. Connected things generate terabytes of data, and it’s a demanding task to choose which data to store and which to drop. What is more, the value of some data is far not on the surface, but you may need this data in the future. And if you decide to store the data for the future, the challenge is to do it with minimal costs (as soon as data storing and processing are rather expensive).

Analysis depth. As soon as not all big data is important, another challenge appears: when is it enough to get by with quick analysis and when deeper analysis can bring more value.

Security. There is no doubt that connected things in various sectors can make our life better, but, at the same time, there are very important concerns about data security. Cyber criminals can get access to data centers and devices, connect to traffic systems, power plants, factories, steal personal data from telecom operators. IoT big data is a relatively new phenomenon for security specialists, and the lack of relevant experience increases security risks.

Big data processing in an IoT solution

In IoT systems, data processing components of an IoT architecture vary depending on the peculiarities of incoming data, expected outcomes and more. We’ve worked out our own approach to processing big data in IoT solutions.

Big data processing in IoT

Data comes from sensors connected to things. A “thing” can literally be any object: an oven, a car, a plane, a building, an industrial machine, rehabilitation equipment. Data comes either periodically or in streaming. The latter is essential for real-time data processing and managing things promptly.

Things send the data to gateways which ensure initial data filtering and preprocessing reducing the volume of data transferred to the next IoT system’s blocks.

Edge analytics. Before deep data analysis, it makes sense to conduct data filtering and preprocessing to select most relevant data needed for certain tasks. Also, this stage ensures real-time analytics to quickly recognize useful patterns found earlier by deep analysis in a cloud.

Cloud gateway is necessary for basic protocol translation and communication between different data protocols. It also enables data compression and secure data transmission between a field gateway and central IoT servers.

Data generated by connected devices is stored in its natural format in a data lake. Raw data comes to a data lake with “streams”. The data is kept in a data lake until it can be used for business purposes. Cleaned and structured data is stored in a data warehouse.

Machine learning. The machine learning module generates the models based on previously accumulated historical data. These models are regularly (for example, once in a month) updated with new data streams. Incoming data is accumulated and applied for training and creating new models. When these models are tested and approved by specialists, they can be used by control application which send commands or alerts in response to new sensor data.

To sum it up

IoT generates a lot of big data which can be used for real-time monitoring, analytics, process optimization and predictive maintenance, just to name a few. However, it should be kept in mind that getting valuable insights from huge volumes of data in various formats is not a trivial task: you need to be sure that sensors work properly, the data is securely transmitted and effectively processed. What is more, there is always a question: which data is worth storing and processing (as soon as both these processes are rather expensive).

Despite of potential problems listed above, it should be kept in mind that IoT development gains momentum and helps businesses across multiple industries open new digital opportunities.


From roadmapping to evolution – we’ll guide you through every stage of IoT initiative!

Ad Hoc Reporting and Analysis to Get Quick Answers to Burning Questions


Editor’s note: In this article, Marina showcases the specifics of ad hoc reporting and analysis and shares the three options to gain its capabilities. In case you want to leverage ad hoc reporting and analysis in your business, you are welcome to consider ScienceSoft’s business intelligence services.

The constantly changing business environment requires making fact-based decisions on the fly. Addressing this challenge, ad hoc analysis and reporting becomes a necessity for companies who seek ways to operate efficiently in any unstable conditions. So, let’s find out how ad hoc analysis and reporting can help you provide your business users with the answers to their questions requiring quick action and gain a competitive advantage over your competitors.

Ad hoc analysis vs. regular analysis

Regular or repeating analysis presupposes reports and dashboards that are viewed on a regular basis by business users. Once some analytics software is set up to answer a range of predefined questions, no additional efforts, like data sources integration, are needed.

In its turn, ad hoc analysis is data analysis conducted on demand to promptly answer particular questions that cannot be answered with regular reports.

Ad hoc analysis may be triggered by a variety of reasons, including:

  • The need for more detailed information about the aspects reflected in regular reports (for example, learning about the sales of some particular product when your regular reports provide data on the whole product line).
  • Getting valuable insights on specific issues, usually in response to some peculiar event – say, a sudden drop in sales.
  • Proof of concept for new types of regular reports.

How to organize ad hoc analysis and reporting

ad hoc analysis and reporting

Generally, there are three ways to arrange ad hoc analysis:

Employ an established data analytics solution

If you have a centralized analytical solution, you can already carry out ad hoc analysis with existing software. Still, the following steps should take place to enable that:

  • Defining report requirements.
  • Deciding on what data sources to integrate to conduct the analysis.
  • Performing the required data management procedures – data cleansing, grouping, modeling, etc.
  • Reporting data in an easy-to-digest format.

Among this option’s benefits are the absence of additional investments and ensured high data quality in case of proper data management procedures arranged in your company.

However, you can see that ad hoc analysis requires additional efforts in this case. Consequently, business users may wait for the analytical results from 1 hour to two weeks, depending on the employed analytical solution, the report complexity, the data management procedures, and much more. So, I consider this approach inefficient in today’s business environment because of the two main reasons:

  • Business users aren’t self-sufficient – they have to address third parties to perform the analysis – the IT department, data analysts or data scientists (depending on the analysis complexity).
  • Potential delays in obtaining analytics results – ad hoc reports can be gained too late to take advantage out of the insights.

Leverage self-service analytics and reporting software

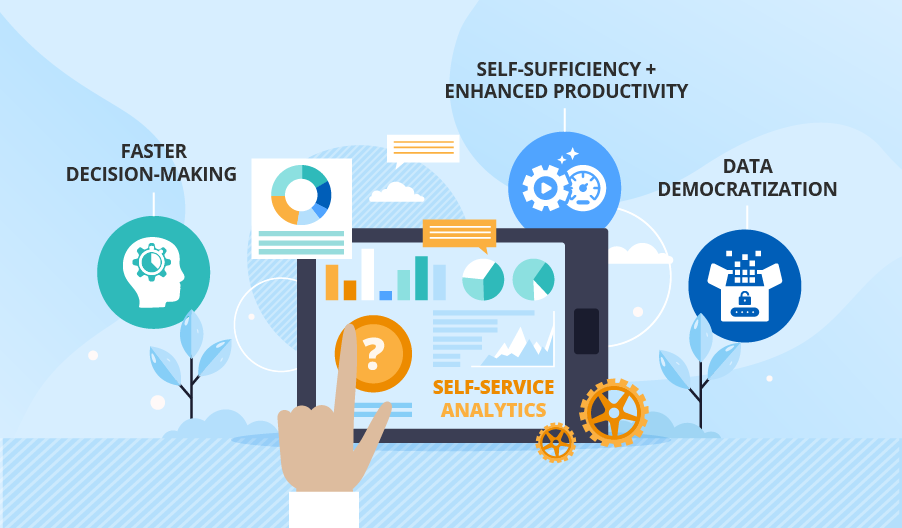
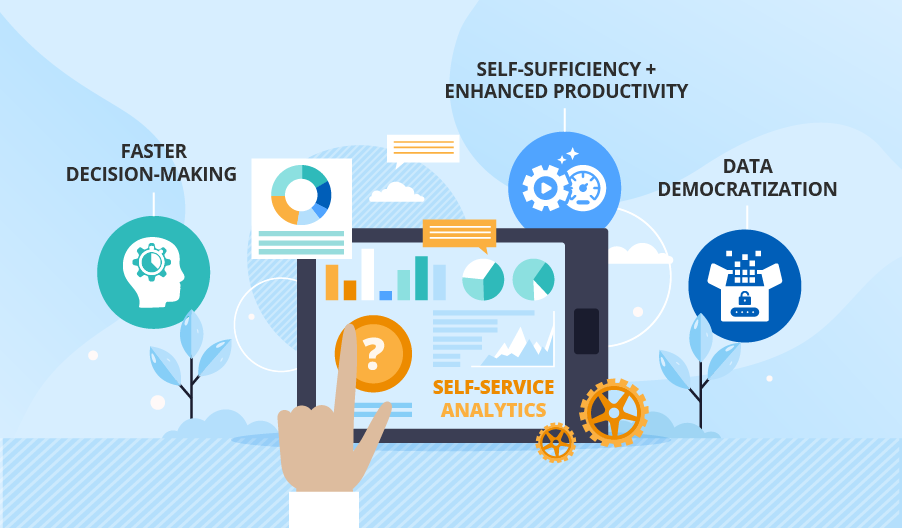
The second option is to adopt self-service analytics and reporting software. The implementation of such reporting tools, for example, Microsoft Power BI or Tableau, can empower business users in your company to get analytics insights and present them in a visual format without burdening your IT staff and data analysts. Among self-service software benefits are:

Analytics results are presented in the form of informative and easy-to-digest reports, spreadsheets and dashboards with charts, tables, etc. To see the visualization capabilities of self-service analytics software in detail, watch our BI demo.

  • A wide range of analytics capabilities

Self-service software usually has a set of basic analytical features for beginners and more advanced capabilities for competent users.

Thanks to such functionality as drag and drop, drill-down, natural language processing, etc., self-service software is rather easy to master.

However, you should remember that a self-service analytical solution with ad hoc capabilities requires constant governance to ensure data security, data accuracy and consistency, and high quality of data analytics results.

Ready to Speed Up Your Decision-Making?

ScienceSoft will implement/upgrade your data analytics solution with self-service capabilities or become your data analytics vendor to help you benefit from ad hoc analysis and reporting.

Outsource data analysis

The last option from the list is to outsource your data analysis to a vendor. It may be a one-time data analysis or continuous engagement with an agreed number of ad hoc reports of specified complexity on a subscription fee basis.

The advantages of this option are quite obvious – you obtain flexible and prompt analytics results with no need to develop or administer an analytics solution. However, to reap the above benefits, you have to carefully choose your outsourcing partner. If you need to dig deeper into this issue, check out the overview of data analytics outsourcing written by my colleague Irene Mikhailouskaya. There she covers typical concerns, such as data security, when outsourcing data analysis and gives tips on how to proactively deal with them.

Your business users can have the answers to all their questions promptly!

With the capabilities of ad hoc analysis and reporting, you can streamline your decision-making, increase operational efficiency, and gain flexibility in the ever-changing business environment. If you feel like obtaining these benefits but can’t choose among the options I’ve listed above or need help with their implementation, you can always resort to ScienceSoft’s help.


Are you striving for informed decision-making? We will convert your historical and real-time data into actionable insights and set up forecasting.

What Benefits To Ask For


Editor’s note: Read on to learn why Marina advises companies to consider Power BI as their business intelligence solution. And if you feel inspired to employ Power BI suit for developing a robust analytics solution, you are welcome to leverage ScienceSoft’s expertise as your Power BI consulting service provider.

Today, Microsoft Power BI is a recognized leader among business intelligence solutions. And as a BI consultant, I understand why this self-service BI tool has gained such a position. Here, I share why use Power BI and what benefits have become the most valuable for ScienceSoft’s customers in my practice.

power bi benefits

Deep business insights

As a modern analytical tool, Power BI goes far beyond just a collection of reports and charts. To benefit from data-driven decision-making, I suggest business users leverage Power BI extensive data integration capabilities and advanced data analytics services. Have a look at how the Power BI-based BI solution implemented by ScienceSoft for an international real estate developer allows our customer to look at the aggregated financial data from any perspective, analyze their cash flow and spot the trends to identify new profit opportunities.

Data visualization capabilities

I believe that visualization is an integral part of data analytics, as it allows getting a bird’s eye view of the current business situation, tracking goal achievements, benchmarking, etc. In my work with ScienceSoft’s customers, I advise companies to fully employ a wide range of Power BI’s visualization capabilities to get self-service analytics and the possibility of sharing insightful findings with other colleagues to ensure their being on the same page.

Fast data processing and reporting

Ad hoc data analysis and reporting is the feature many of our customers seek in their BI solutions. With powerful algorithms running in the cloud, Power BI enables companies to get quick insights straight out of their data sets to perform such activities as real-life tracking of employees’ working time, task fulfillment, inventory analysis, etc. For example, in ScienceSoft’s project for the machinery maintenance entity, dashboards created with Power BI allowed improving HR and performance management.

Interested to see Power BI in action?

Take a look at how a BI solution implemented on Microsoft Power BI helps run the root-cause analysis.

User-friendly interface

I’d like to highlight that Power BI is pretty easy to use and can provide analytical capabilities for all levels of users, from the entry-level to professional analysts. Its interface is rather intuitive with such functions as drag and drop, natural language query, automatic integration with the existing systems, etc. What is more, employees can only see data relevant to their user role: to ensure that, Power BI service employs Row Level Security.

Affordable pricing

I always suggest that companies with limited budgets consider Power BI, as one of its major advantages is no/minimal upfront costs (depending on the service package). Such products as Power BI Desktop and Power BI Mobile are free. Within Power BI service pricing plans, you can find two options – Power BI Pro ($9.99/user/month) and Power BI Premium (starting from $4,995/dedicated compute and storage resources/month) – tailored to business needs of different scales. In our other article, I present the structured overview of Power BI, where you can find more detailed information on Microsoft Power BI offering and possible service plans.

How to start your Microsoft Power BI journey?

Besides the advantages I’ve described above, Microsoft Power BI has some limitations mentioned in my other blog post. Therefore, I advise you to carefully map your business needs to Microsoft business intelligence offering if you want to ensure that Microsoft Power BI suits your particular situation. To perform this task, you may find useful trustworthy BI consulting. My colleagues and I are always ready to give you a hand at any stage of your business intelligence endeavor, just send us a request.


Do you need to get an expert opinion on Microsoft Power BI? Our consultants will analyze your current reporting capabilities and offer an optimal solution to meet your business needs.

Key Aspects of Ecommerce Database Design


Editor’s note: In this article, Tanya tells about the core of an ecommerce database and its implementation. Read on and if you need to design and implement an optimal ecommerce database, check out ScienceSoft’s ecommerce services.

Is it possible to run an ecommerce store without a database behind it? Yes, but it would be feasible only for small businesses selling a limited amount of products to a small customer base. If your store doesn’t fall under this description, you’ll need a database to store and process data about your products, customers, orders, etc.

An ecommerce database allows you to organize data in a coherent structure to keep track of your inventories, update your product catalog, and manage transactions. The amount of effort required for your database management directly depends on how well it was designed.

How to design ecommerce database

Create a layout to organize your data effectively

Elaborating an ecommerce database architecture is the first step in its development. With a thoroughly designed database, you’ll make your ecommerce database a long-term solution that won’t require many updates and changes when your business is up and running.

Database design is mainly determined by a database schema. It is expressed in a diagram or a set of rules, aka integrity constraints written in a database language like SQL, that define how the data is arranged, stored, and processed.

What forms the center of an ecommerce database?

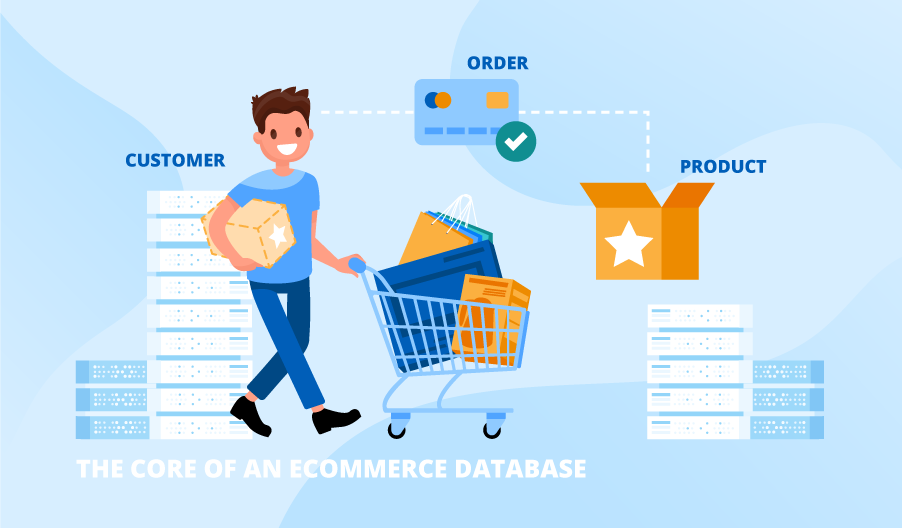
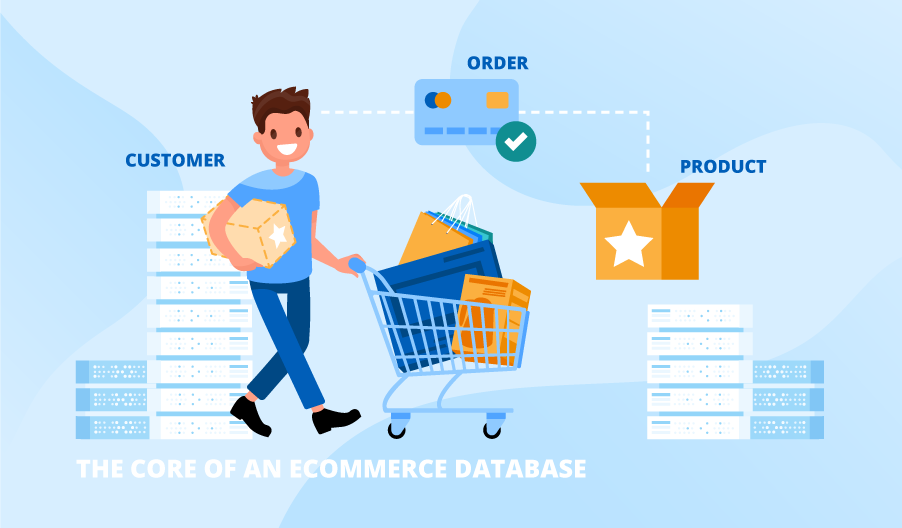
The three data blocks that comprise the core of an ecommerce database are a customer, an order, and a product. However, it’s a good practice to plan a database keeping in mind its possible expansion (tables for suppliers, shipments, transactions, and other data).

The Customer

The basic customer information includes a name, an email address, a home address broken down into lines, a login, a password, as well as additional data like age, gender, purchasing history, etc.

The Order

Order tables hold data about the purchases of each individual client. Usually, this data is organized into two tables. The first table contains all order-related information like the items ordered, date of order, the total amount paid, as well as Customer ID – a foreign key to the customer table.

The second table holds data on each product from the order, including product ID, its price, parameters, and quantity.

Design Your Ecommerce Database with Further Expansion in Mind

ScienceSoft can help you design and develop a scalable ecommerce solution.

The Product

Tables with product data include SKUs, product names, prices, categories, weight, and product-specific information like color, size, and, material, etc. If you’re selling many products from categories different in their attributes, having a single table listing all products with null values for some of the product parameters may not be appropriate.

In some cases, an entity–attribute–value, or an EAV, model may become an optimal approach. In the simplest case, it includes two tables. The first one is a product entity table with product IDs, attribute IDs, and attribute values. The attribute ID is a foreign key into the second table with all attributes and their definitions. This configuration gives an opportunity not to store every possible attribute (sometimes absent for a specific product type) in the product entity table.

Develop the core into a tailored solution

To define an optimal ecommerce database design, you need to carefully assess your ecommerce store, considering its size, features, look, integrations, and future evolution. Dedicated database development consultants at ScienceSoft are ready to help you define the tech stack required to support your business throughout its life cycle. If you would like to learn more about the database design options that would be perfect for your store, feel free to ask us.


Are you planning to expand your business online? We will translate your ideas into intelligent and powerful ecommerce solutions.

Self-Service Business Intelligence: Drive Your Company’s Success


Editor’s note: In this article, Marina describes the components of a self-service business intelligence (BI) solution and shares how self-service BI allows non-IT users to create queries and reports on their own. Read on for tips on building your self-service BI project, and if you seek deeper assistance with developing or upgrading your self-service BI solution, consider ScienceSoft’s BI consulting services.

The trend of self-service analytics continues to gain its momentum as more and more companies leverage self-service BI tools to put actionable insights in the hands of business users, who have little or no background in BI, statistical analysis, and data mining.

As opposed to traditional BI, self-service BI allows business users to make timely strategic and operational decisions without reliance on third parties – IT specialists, data analysts, and data scientists. Still, I would not call self-service BI an alternative to a traditional BI solution but rather its amendment, so implementing one doesn’t necessarily require a complete reboot of previous investments.

‘What self-service BI requires then?’ you might be wondering. Below, you can find your answer while I describe the components that support effective self-service business intelligence.

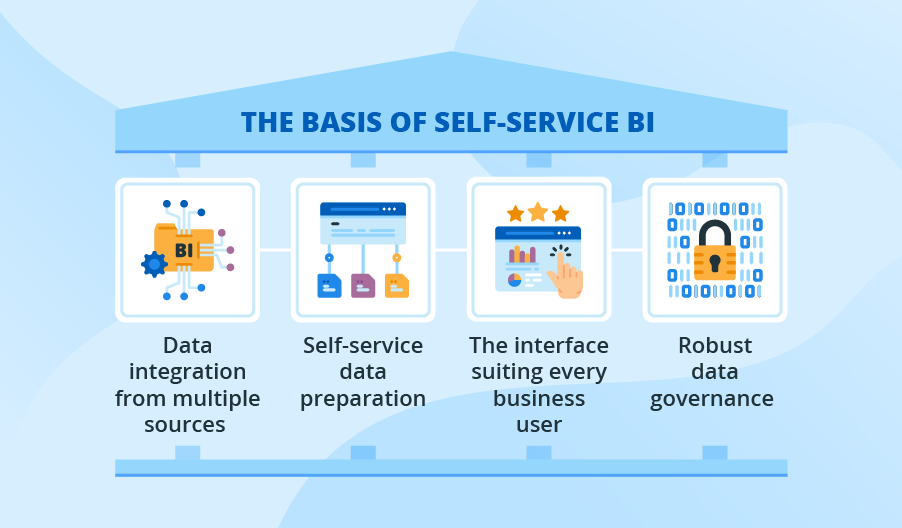
The foundation of a self-service BI

self-service BI

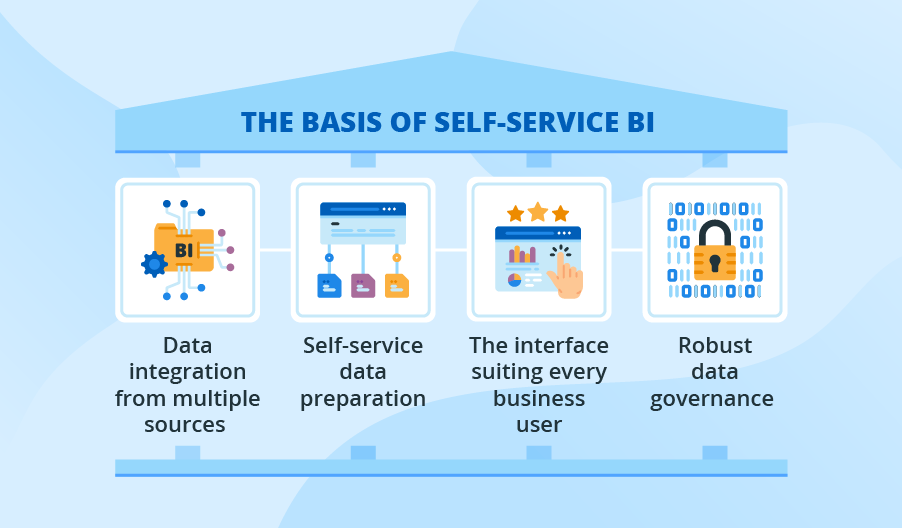
To enable the environment in which non-IT professionals can obtain valuable insights from disparate data sources on demand, a self-service BI solution should provide:

Data integration from multiple sources

Your self-service BI solution should allow integrating with different data sources (ERP, CRM, accounting and marketing software, etc.). Additionally, a self-service BI platform has to be flexible enough to integrate big data sources (streaming data, IoT data, social media data, etc.) to further enrich your insights with big data analysis.

Self-service data preparation

To serve the diverse analytical needs of your business users (historical analysis, streaming analytics, predictive analytics, etc.), a self-service BI solution should enable the aggregation of data sets before feeding data of a suitable format into your business intelligence system for reporting and further analysis.

The self-service data preparation tools perform such tasks as:

  • Accessing and cataloging data.
  • Data parsing and profiling.
  • Transforming and modeling data for analysis.
  • Refining and enriching data, etc.

Among the most vivid examples of these tools, I can mention such Power BI technologies as Power Query and Power BI dataflows that, besides ingesting data from a variety of data sources, allow data cleansing, transforming, integrating, enriching, and schematizing to dive really deep into your business.

Getting Lost in Self-Service BI Technologies?

ScienceSoft’s team is ready to assist you in selecting and configuring the right technology stack to meet your particular business intelligence needs and maximize self-service BI ROI.

The interface suiting every business user

As a self-service BI solution has to satisfy the demands of business users with different levels of technical expertise, it should have an easy-to-use interface for data analysis, reporting and visualization, sharing and collaboration.

As an example of such, I can think of Power BI, a recognized leader among self-service software praised for its friendly interface. Have a look at how its compelling visualization and intuitive interface helped an international real estate developer analyze financial data from any perspective and, consequently, better understand their business. If you think you may need professional help with assessing how well Power BI can meet your self-service analytics needs or its implementation, you are welcome to consider our Power BI consulting offer.

To facilitate fast adoption of self-service BI, the solution has to offer a non-technical representation of corporate data, so that all end users can derive value from self-service analytics technologies using common business terms. Thus, they could have a consolidated view of data relevant to such terms as ‘customer’ or ‘product’ with no need to know the relational structure of the tables where the data is stored. If you need an example, check our BI demo to see how easy it is to spot trends and patterns and answer your business questions with such interactive data visualization.

Robust data governance

The agility of self-service BI, which is realized in accessing critical business data by a large number of business users, poses certain risks – data leakage and inconsistent or invalid outputs across business units. So, to be in control of business analytics quality, I recommend setting up a data governance framework as soon as you deploy self-service BI.

Surely, modern self-service software usually has built-in data governance features. Still, I advise you to develop and set up your own data management procedures in accordance with your industry specifics, BI objectives, a number of users, etc. If you need to dig deeper into the topic, say, learn how to define your data quality objectives or check data management best practices, explore this insightful guide to data quality management written by my colleague Irene Mikhailouskaya.

Achieve self-service BI success!

Although self-service BI has lots to offer, developing and maintaining such a solution requires substantial efforts. Besides choosing proper self-service software, you need to follow the agile approach in developing or upgrading your self-service BI solution and work hard on the solution’s adoption within your business community. If you feel in need of qualified assistance with any of these tasks, my colleagues at ScienceSoft and me are ready to help.


We offer BI consulting services to answer your business questions and make your analytics insightful, reliable and timely.

Can ERP Be the Only Source of Data for Business Intelligence?


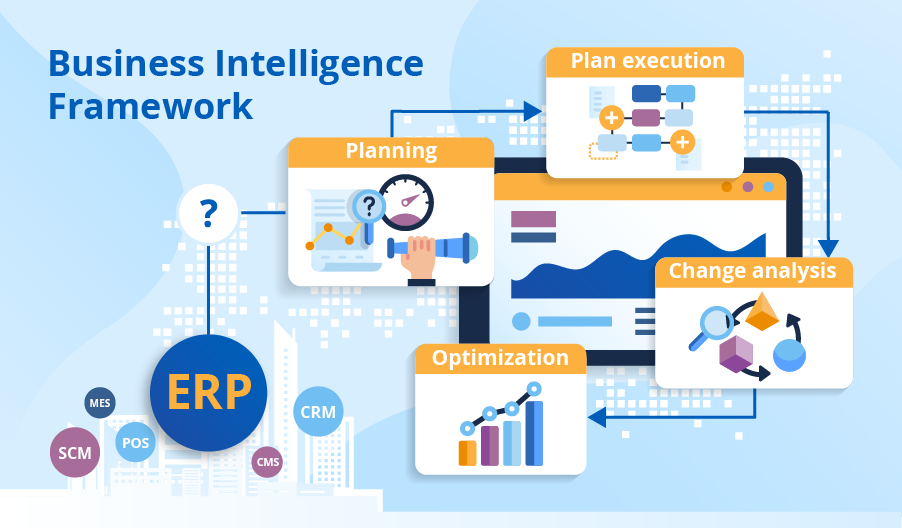
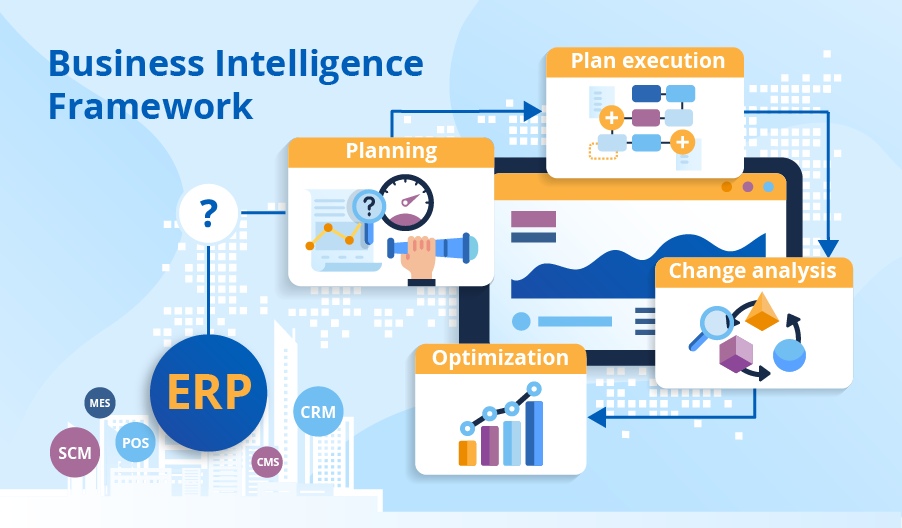
Based on our 17 years of experience in BI implementation, we developed a BI framework that allows utilizing data for more structured fact-based decisions. The framework embraces four main components: planning, plan execution, change analysis and optimization. Let’s look at each component separately and check whether the data in a company’s enterprise resource planning (ERP) system is enough to get valuable insights and which other data sources to turn to if ERP data is insufficient or missing.

business intelligence ERP

Planning

The planning component embraces trend analysis, forecasting, and performance analysis.

Trend analysis

Examining only ERP data to identify trends can result in misleading insights. For instance, a manufacturer sees no growth in shipments to a particular region and concludes that the situation remains stable. In reality, the demand for the manufacturer’s products in this region is increasing. The ERP system doesn’t reflect this trend as it’s unaware of unmet demand: the enterprise is working at its full capacity and successfully selling everything it produces. However, if the manufacturer turned to their CRM data, they would find there the increased number of lost opportunities with ‘No product available’ clarification.

Forecasting

We don’t think that an ERP system is enough for forecasting. Say, to predict customer demand, data from internal and external sources is required, such as detailed sales history (ERP and POS systems), a customer’s location and type (CRM), weather conditions or social media trends (external sources).

Performance analysis

Internal benchmarking also requires not only ERP data. For example, to identify their top-selling stores, a retailer should analyze sales values taken from a POS system, as well as consider the sales floor area and the number of available checkouts, which can be stored in their ERP.

Plan execution

ERP data may be enough to analyze the performance against the plan and spot deviations. However, to run root cause analysis, a company often needs to go beyond ERP data. Say, if a manufacturer has failed to achieve their production plans, they may find the reason in the disrupted deliveries of raw materials by some of their Tier 1 suppliers. To get to these details, a manufacturer has to turn to SCM (supply chain management) data.

Change analysis

ERP can be one of the data sources for change analysis. It’s fine to conduct ROI analysis, as finances and assets are tracked in an ERP system. On the other hand, ERP data won’t help in analyzing the effect of redesigning a company’s online store, while the data (i.e., product lists, pictures, descriptions and visitors’ search and purchase histories) from a content management system and an e-commerce solution will be required for this purpose.

Optimization

We don’t recommend companies to rely solely on ERP data if they challenge themselves with business process optimization. Take asset management as an example: ERP is likely to contain just machinery name, purchasing date, and price. If a company strives to use their machinery efficiently and reduce overall costs through preventive and even predictive maintenance, they need to know equipment utilization and maintenance schedules. And this info is usually stored in an MES (manufacturing execution system) or dedicated equipment utilization software.

To sum it up

Though ERP is a vital source of data for BI, we don’t recommend embedding business intelligence into ERP. BI can only bring value when it’s on top of all the company’s applications, such as ERP, CRM, SCM, CMS, MES, and POS, and when it uses external data sources.


BI expertise since 2005. Full-cycle services to deliver powerful BI solutions with rich analysis options. Iterative development to bring quick wins.

Major Pros and Cons to Consider


Editor’s note: Do you wonder whether Microsoft Power BI is the right self-service analytics solution for you? Marina shares her vision on its major pros and cons, which can influence your decision. To learn how we support our customers in their business intelligence projects, check ScienceSoft’s Power BI consulting services.

When ScienceSoft’s customers ask for more agility and independence in their analytics and reporting, I recommend considering Microsoft Power BI. Rather than forcing them into an implementation project right away, my suggestion is for them to start with the careful mapping of their business analytics needs against Power BI advantages and disadvantages. Here is the list of Power BI strong sides and limitations I share with the companies to take into consideration in the first place.

What I like about Power BI

Data integration and visualization capabilities

In my everyday practice, I see how handy Power BI is for creating meaningful data stories by importing data of various formats from a diversity of external and internal data sources. It is especially beneficial for the companies that don’t have a data warehouse solution – Power BI acts as a facilitator that enables data sets processing.

Also, with the possibility of creating reports and personalized dashboards, business users of every level can use Power BI to make quick and confident decisions. To get an idea of how personalized reports and dashboards may look, check ScienceSoft’s project where we enabled the international real estate developer to gain in-depth insight into their business and spot trends for new business opportunities.

Affordability

I believe Power BI suits every pocket. It enables creating self-explanatory dashboards and reports at the lowest possible price. With Power BI Desktop, it is free of charge – you just download the free version and create reports. However, a Power BI Desktop limitation to be taken into account is the inability to collaborate on the insights with your colleagues within a single space. For that, you’ll need amending Desktop with Power BI service, which is available at a relatively low price – $9.99/user/month or at no additional cost for Office 365 E5 users.

Data analytics capabilities

When customers turn to ScienceSoft to upgrade their old and rigid enterprise DWHs to perform particular analytics, Power BI is one of the options we offer them, as it enables necessary analytics within days or even hours and eliminates the need for lengthy development and implementation.

If you want to read about Power BI value in more detail, don’t hesitate to explore our article dedicated to Power BI benefits.

Let us show you the Power BI potential!

If you want to see how Power BI translates raw data into meaningful data stories, have a look at our Power BI Demo.

What I don’t like about Power BI

Complexity

Power BI is intuitive enough when it comes to importing data and creating simple reports. However, I always warn the customers who require advanced analytics within the Power BI suite that they will need additional tools to master (Power Pivot, Power Query, etc.) and an external consultant to hire for conducting complex analysis.

Costly on-premises storage and processing

When our clients need to keep their data and reports on-premises because of legal regulations or specifics of their industry, I advise them to deploy Power BI Report Server. However, the solution is only available in the Power BI Premium plan, so they will have to pay starting from $4,995/month for the possibility of keeping their Power BI content in-house.

Limitations to face when dealing with huge data sets

When employing Power BI for deriving insights out of massive data sets, you must remember about data set limits. For example, the size of a data set you can import into Power BI Pro is 1GB, which can naturally limit the complexity of reports and dashboards. If you want to import and analyze larger data sets with Power BI, you can try creating multiple queries to process the entire data set or shift to Power BI Premium.

Is Microsoft Power BI the right solution for you?

Even though Power BI is one of the most powerful facilitators for self-service business intelligence, I believe that the feasibility of each Power BI project should be estimated individually. In case you need assistance with defining the right set of Power BI functions or advising on Power BI implementation, I am ready to answer your questions.


Do you need to get an expert opinion on Microsoft Power BI? Our consultants will analyze your current reporting capabilities and offer an optimal solution to meet your business needs.

Examples, Sources and Technologies explained


For years, people have asked all-knowing Google how big data can help businesses to succeed, what big data technologies are the best, and other important questions. A lot has been written and said about big data already, but the term itself remains unexplained. To be fair, we do not count a widespread definition “big data is big.” This concept raises another question: what are the measures for “big” – 1 terabyte, 1 petabyte, 1 exabyte or more?

Here, our big data consulting team defines the concept of big data through describing its key features. To give a complete picture, we also share an overview of big data examples from different industries, enumerate different sources of big data and fundamental technologies.

What is big data

Big data defined

Here’s our definition:

Big data is the data that is characterized by such informational features as the log-of-events nature and statistical correctness, and that imposes such technical requirements as distributed storage, parallel data processing and easy scalability of the solution.

Below, you can read about these features and requirements in more detail.

Informational features: In contrast to traditional data that may change at any moment (e.g., bank accounts, quantity of goods in a warehouse), big data represents a log of records where each describes some event (e.g., a purchase in a store, a web page view, a sensor value at a given moment, a comment on a social network). Due to its very nature, event data does not change.

Besides, big data may contain omissions and errors, which makes it a bad choice for the tasks where absolute accuracy is crucial. So, it doesn’t make much sense to use big data for bookkeeping. However, big data is correct statistically and can give a clear understanding of the overall picture, trends and dependencies. Another example from Finance: big data can help identify and measure market risks based on the analysis of customer behavior, industry benchmarks, product portfolio performance, interest rates history, commodity price changes, etc.

Technical requirements: Big data has a volume that requires parallel processing and a special approach to storage: one computer (or one node as IT gurus call it) is not sufficient to perform these tasks – we need many, typically from 10 to 100.

Besides, big data solution needs scalability. To cope with ever-growing data volume, we don’t need to introduce any changes to the software each time the amount of data increases. If this happens, we just involve more nodes, and the data will be redistributed among them automatically.

Big data examples

To better understand what big data is, let’s go beyond the definition and look at some examples of practical application from different industries.

1. Customer analytics

To create a 360-degree customer view, companies need to collect, store and analyze a plethora of data. The more data sources they use, the more complete picture they will get. Say, for each of their 10+ million customers they can analyze 5 types of customer big data:

  • Demographic data (this customer is a woman, 35 years old, has two children, etc.).
  • Transactional data (the products she buys each time, the time of purchases, etc.)
  • Web behavior data (the products she puts into her basket when she shops online).
  • Data from customer-created texts (comments about the company that this woman leaves on the internet).
  • Data about product/service use (feedback on the quality of the goods ordered, the speed of delivery, etc.).

Customer analytics is equally beneficial for companies and customers. The former can adjust their product portfolio to better satisfy customer needs and organize efficient marketing activities. The latter can enjoy favorite products, relevant promotions and personalized communication.

2. Industrial analytics

To avoid expensive downtimes that affect all the related processes, manufacturers can use sensor data to foster proactive maintenance. Imagine that the analytical system has been collecting and analyzing sensor data for several months to form a history of observations. Based on this historical data, the system has identified a set of patterns that are likely to end up with a machine breakdown. For instance, the system recognizes that picture formed by temperature and load sensors is similar to pre-failure situation #3 and alerts the maintenance team to check the machinery.

It’s important to mention that preventive maintenance is not the only example of how manufacturers can use big data. In this article, you’ll find a detailed description of other real-life big data use cases.  

3. Business process analytics

Companies also use big data analytics to monitor the performance of their remote employees and improve the efficiency of the processes. Let’s take transportation as an example. Companies can collect and store the telemetry data that comes from each truck in real time to identify a typical behavior of each driver. Once the pattern is defined, the system analyzes real-time data, compares it with the pattern and signals if there is a mismatch. Thus, the company can ensure safe working conditions (as drivers should change to have a rest, but they sometimes neglect the rule).

4. Analytics for fraud detection

Banks can detect an unusual card behavior in real time (if somebody else, not the owner, is using it) and block suspicious activities or at least postpone them to notify the owner. For example, if the user is trying to withdraw money in Spain, while they reside in Texas, before declining the transaction, the bank can check the user’s info on the social network – maybe they are simply on vacations. Besides, the bank can verify if this user has any linkage with fraud-related accounts or activities across all other channels.

Big data sources: internal and external

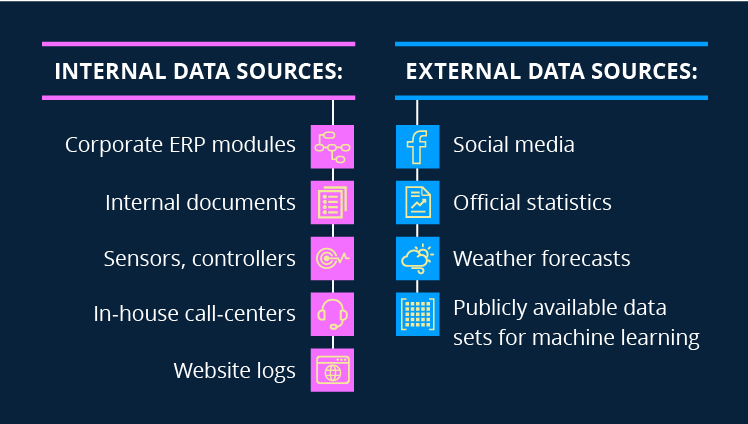
There are two types of big data sources: internal and external ones. Data is internal if a company generates, owns and controls it. External data is public data or the data generated outside the company; correspondingly, the company neither owns nor controls it.

Let’s look at some self-explanatory examples of data sources.

Internal and external big data sources

Autonomous system or a part of traditional BI?

Big data can be used both as a part of traditional BI and in an independent system. Let’s turn to examples again. A company analyzes big data to identify behavior patterns of every customer. Based on these insights, it allocates the customers with similar behavior patterns to a particular segment. Finally, a traditional BI system uses customer segments as another attribute for reporting. For instance, users can create reports that show the sales per customer segment or their response to a recent promotion.

Another example: Imagine an ecommerce website supported by the analytical system that identifies the preferences of each user by monitoring the products they buy or are interested in (according to the time spent on a product page). Based on this information, the system recommends “you-may-also-like” products. This is an independent system.

Big data technologies: overview of good-to-know names and terms

Big data good-to-know terms

The world of big data speaks its own language. Let’s look at some good-to-know terms and most popular technologies:

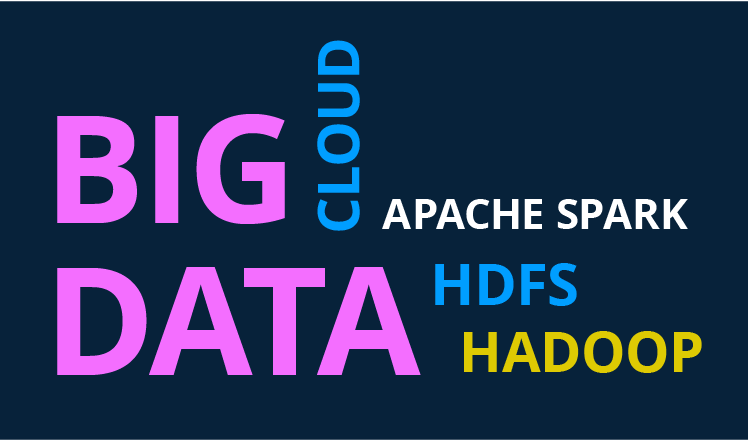
  • Cloud is the delivery of on-demand computing resources on a pay-for-use basis. This approach is widely used in big data, as the latter requires fast scalability. E.g., an administrator can add 20 computers in a few clicks.
  • Hadoop is a framework used for distributed storage of huge amounts of data (its HDFS component) and parallel data processing (Hadoop MapReduce). It breaks a large chunk into smaller ones to be processed separately on different data nodes (computers) and automatically gathers the results across the multiple nodes to return a single result. Quite often Hadoop means the ecosystem that covers multiple big data technologies, such as Apache Hive, Apache HBase, Apache Zookeeper and Apache Oozie.
  • Apache Spark is a framework used for in-memory parallel data processing, which makes real-time big data analytics possible. E.g., an analytical system may identify that a visitor has been spending quite a long time on particular product pages, but has not added them to the cart yet. To motivate a purchase, the system can offer a discount coupon for the product of interest.

Read more:

Now you know what big data is, don’t you?

Our big data consultants created a short quiz. There are five questions for you to check how much you’ve learned about big data:

  1. What kind of data processing does big data require?
  2. Is big data 100% reliable and accurate?
  3. If your goal is to create a unique customer experience, what kind of big data analytics do you need?
  4. Name at least three external sources of big data.
  5. Is there any similarity between Hadoop and Apache Spark?

Well done! We hope that the article was helpful to you and that after reading it you’ve found the quiz easy.


Big data is another step to your business success. We will help you to adopt an advanced approach to big data to unleash its full potential.

Supplier Risk Assessment with Data Science


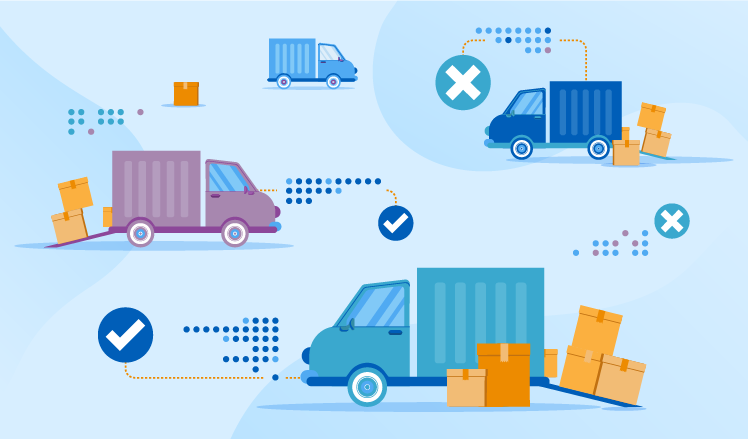
Not once in their practice, our data scientists have heard such complaints from retailers and manufacturers as suppliers missing delivery deadlines, failing to meet quality requirements or bringing incomplete orders. To avoid these problems, businesses strive to optimize their current approaches to assessing supplier risks. As the issue is common and its criticality is in the air, our data science consultants decided to share best practices and describe an alternative approach to assessing supplier risks. This one relies on deep learning – the most advanced data science technique – and allows businesses to build accurate short-term and long-term predictions of a supplier’s failure to meet their expectations.

Here’s the summary of everything that we cover in our blog post:
supplier-risk-assessment

The limitations of the traditional approach to supplier risk assessment

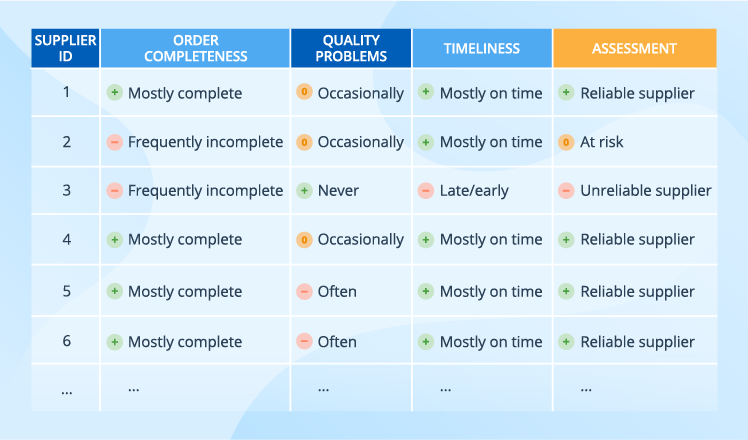
Traditionally, businesses assess supplier risks based on such general data about suppliers as their location, size and financial stability, leaving out suppliers’ daily performance. And even if suppliers’ performance is considered, the traditional approach usually means a simplified classification that can easily result in a table like this:
traditional-approach-to-supplier-risk-assessment

With such an approach, several suppliers are rated the same. But the table doesn’t show a particular pattern, say, a trend in the latest deliveries of a particular category by the given supplier.

The data science-based approach to supplier risk assessment

Our data scientists suggest an alternative to the traditional supplier risk assessment – a data science-based approach. However, to enjoy it, a business must have extensive data sets with supplier profiles and delivery details, which serve as a starter kit. Without this data, a business cannot proceed with designing and developing a solution.

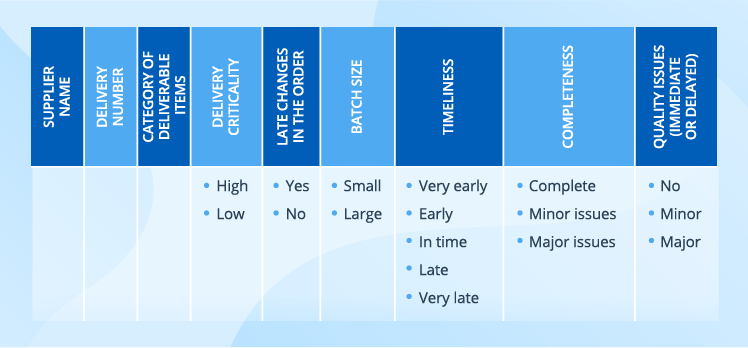
Below, we suggest a possible structure for each of the data sets, but they are neither obligatory nor rigid and only serve as an example. To make the set relevant for their needs, businesses can add specific properties, for example, expand a supplier profile with such criteria as financial situation, market reputation, and production capability.

Supplier data

supplier-data-for-risk-assessment

A supplier can mean either a company with all its manufacturing facilities or a separate manufacturing facility.

Delivery data
delivery-data-for-assessing-supplier-risk

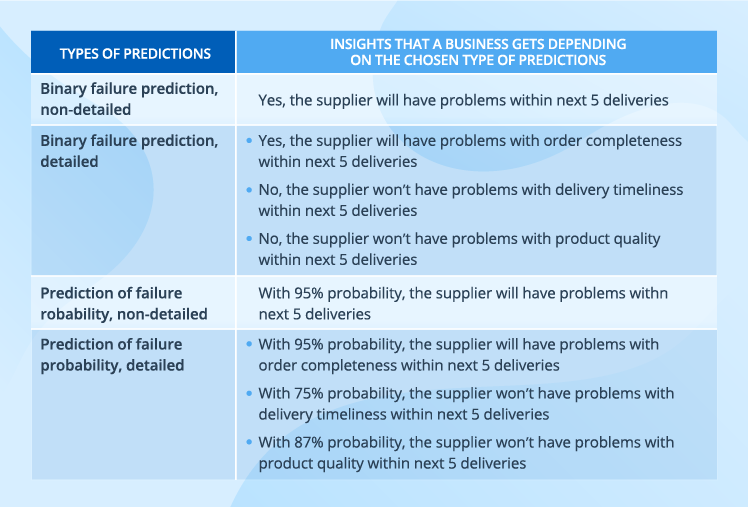
Data science allows analyzing this diverse data and converting it into one of the prediction types like in the table below.
predicting-supplier-failure

The essence of a data science-based solution

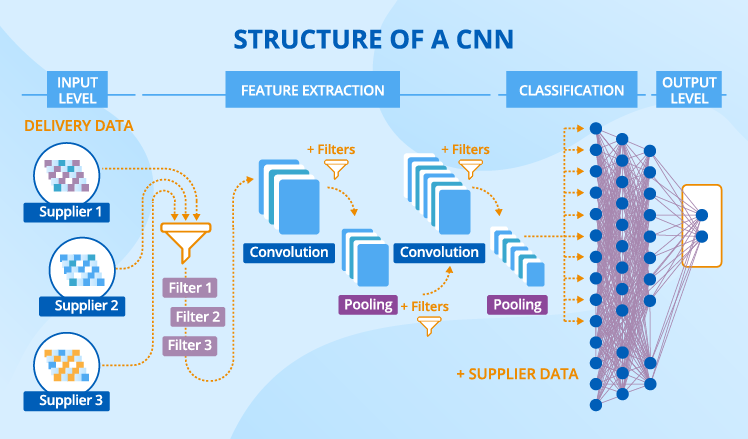
Based on our experience, we suggest using a convolutional neural network (CNN) for the solution. Let’s go through its constituent parts.
cnn-strusture

A CNN has a complex structure consisting of several layers. Their number can vary depending on what criteria a business identifies as meaningful in their specific case, as well as on the output that they expect to receive. We’ll take the data from our example to illustrate how the CNN works. And the expected output is a binary non-detailed prediction of whether a supplier will fail within 3 and within 20 next deliveries.

Ingesting data

Let’s put supplier data aside for a while – we’ll need it a bit later – and focus on delivery data. For a CNN to consume it, delivery data should be represented as channels, where each channel corresponds to a certain delivery property, for example, delivery criticality.
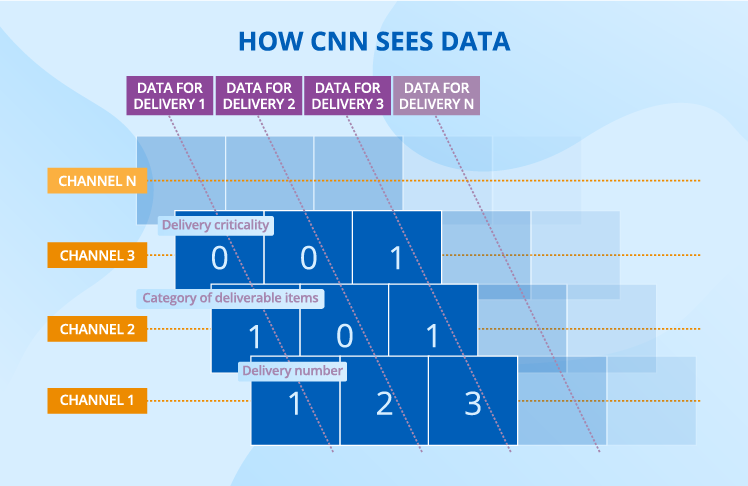
how-cnn-sees-data

In every channel, each cell (or a ‘neuron’ if we use data science terms) takes a certain value in accordance with the encoding principle chosen. For example, we may choose the following gradation to describe the timeliness property: -1 for ‘very early’, -0.5 for ‘early’, 0 for ‘in time’, 0.5 for ‘late’ and 1 for ‘very late’.

Extracting features

In deep learning, a feature is a repetitive pattern in data that serves as a foundation for predictions. For delivery data, a feature can be a certain combination of values for delivery criticality, batch size and timeliness.

As compared with other machine learning algorithms, a CNN has a strong advantage – it identifies features on its own. Though feature extraction skills are inherent to CNNs, they would come to nothing without special training. When a CNN learns, it examines a plethora of labeled data (the historical data that contains both the details about suppliers and deliveries and the info whether a supplier has failed) and extracts distinctive patterns that influence the output.

When features are known, a CNN performs a number of convolution and pooling operations on the newly incoming data. During convolution, a CNN tries each feature (which serves as a filter) to every possible fragment of the delivery data. Very simple math happens at this stage: each value of the fragment gets multiplied by the corresponding value of the filter, and the sum of these results is divided by their number. After this operation, each initial fragment with delivery data turns into a set of new (filtered) fragments, which are smaller than the initial one, still they preserve all its features. During convolutions, the CNN extracts first low-level features then high-level features, increasing the scale at each new layer. For example, low-level features cover 3 deliveries, while high-level features may cover 100 deliveries.

During pooling, a CNN takes another filter (called ‘a window’). Contrary to feature filters, this one is designed by data scientists. A CNN slides the window filter over a convoluted fragment and chooses the highest value each time. As a result, the number of fragments does not change, but their size decreases dramatically.

Classifying into failure/non-failure

After the last pooling operation, the neurons get flattened to form the first layer of a fully connected neural network where each neuron of one layer is connected with each neuron of the following layer. This is another part of a CNN, which is in charge of making predictions.

It’s time to recall our supplier data, as we add it to the neurons with the results received during feature extraction, to improve the quality of predictions.

At the classification stage, we don’t have filters anymore. Instead, we have weights. To understand the nature of weights, it would be useful to regard them as coefficients that are applied to each neuron’s value to influence the output.

These multiple data transformations end with the output layer, where we have two neurons that say whether the supplier will fail within 5 and within 20 next deliveries. Two neurons are required for our binary non-detailed prediction, while other prediction types may require a different structure of the output layer.

A few extra words about how a CNN learns

When a CNN starts learning, all its filters and weights are random values. Then the labeled data flows through the CNN and all the filters and weights are applied. Finally, the CNN produces a certain output, for example, this supplier will fail both short-term and long-term. Then it compares the predictions with what really happened to calculate the error it made. Say, in reality, the supplier delivered on their commitments, both short- and long-term. After that, the CNN adjusts all the filters and weights to reduce the error and recalculates the prediction with newly set weights. This process is repeated many times until the CNN finds the filters and weights that produce the minimum error.

Why the data science-based approach is good and not so good

Based on the example of the described solution, we can draw a conclusion about some benefits and drawbacks of the data science-based approach.

Advantages

  • An unbiased view of a supplier

A CNN leaves no room for subjective opinions – it sets its filters and weights and no buyer can influence the transformations that happen. Contrary to the traditional approach, a solution based on data science allows for unified assessment of supplier risks as it relies on data, not on personal opinions of category or buyers.

  • Captured everyday performance

Instead of deciding on a supplier’s reliability once and for all, data-driven businesses get regular updates about each of their supplier’s performance. If, say, the supplier is late or the order is incomplete or something else is wrong with the delivery, an entry appears in the ERP system and this information is soon fed into a CNN to influence the predictions.

  • A detailed view of a supplier’s performance

Generalized assessment that a traditional approach offers is insufficient for risk management. We assume that a supplier has occasional problems with product quality. But does this mean that a business will face this problem during the supplier’s next delivery? A data science-based approach has a probabilistic answer to this and other questions as it considers numerous delivery properties and supplier details.

  • Identified non-linear dependencies

Linear dependencies are rare for business environment. For instance, if the number of critical deliveries for a certain supplier increased by 10% and this led to a 15% rise in short-term failures, this wouldn’t mean that the increase of critical deliveries by 10% for another supplier will also lead to 15% more short-term failures. A CNN, like any deep learning algorithm, is built around capturing both linear and non-linear dependencies – the neurons of the classification part have non-linear functions at their core.

Limitations

Though a data science-based approach to measuring supplier risks offers many advantages, it also has some serious limitations.

  • Dependence on data amount and quality

In order to get trained and build predictions that can be trusted, a data science-based solution needs big amount of data. Therefore, the solution is not suitable for companies that have a scarce supplier base and/or a very diverse supplier set that doesn’t contain any stable pattern. Frequency of deliveries is an important limitation, too – the approach won’t work for suppliers who deliver rarely.

  • Need for professional data scientists

The accuracy of predictions is in data scientists’ hands. They make a lot of fundamental decisions, for instance, on the solution’s architecture, the number of convolution layers and neurons, and the size of window filters.

  • Serious efforts required for adoption

It’s insufficient just to design and implement a solution based on data science. A business should always think about measures to take to introduce the change smoothly. Without dedicated training on deep learning basics in general and on the solution in particular, category managers or buyers won’t trust the predictions and will continue with their traditional practices of working with Excel tables.

To keep with the tradition or to advance with data science?

Neither traditional nor data science-based approaches to supplier risk assessment are flawless, but their limitations are of different nature. While the traditional approach is relatively simple in terms of implementation but quite modest in terms of business insights, the data science-based approach is its exact opposite. On the one hand, it’s extremely dependent on the amount and quality of data, it requires the involvement of professional data scientists and serious efforts for adoption. But on the other hand, it can produce different types of accurate predictions that consider each supplier’s daily performance. And this can be an effective prevention of many diseases triggered by unreliable suppliers.


Bringing data science on board is promising, yet difficult. We’ll solve all the challenges and let you enjoy the advantages that data science offers.