Demand Forecasting Using Data Science


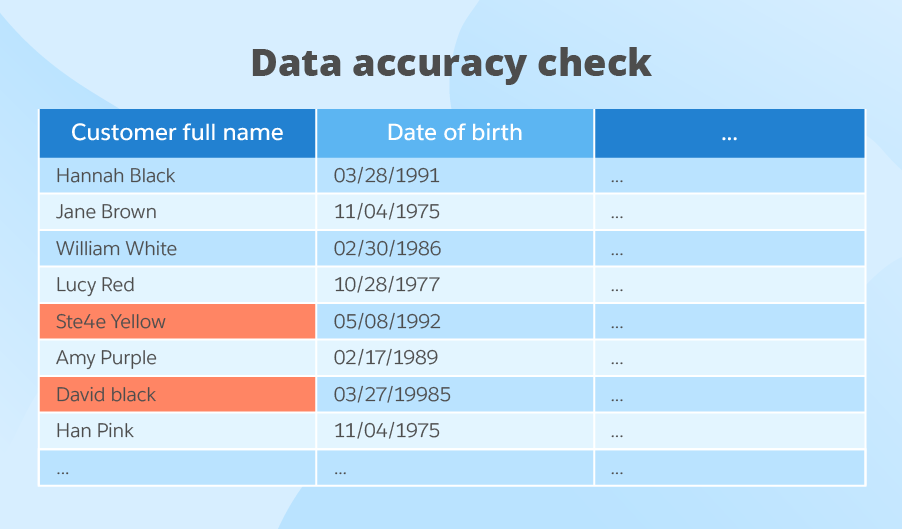
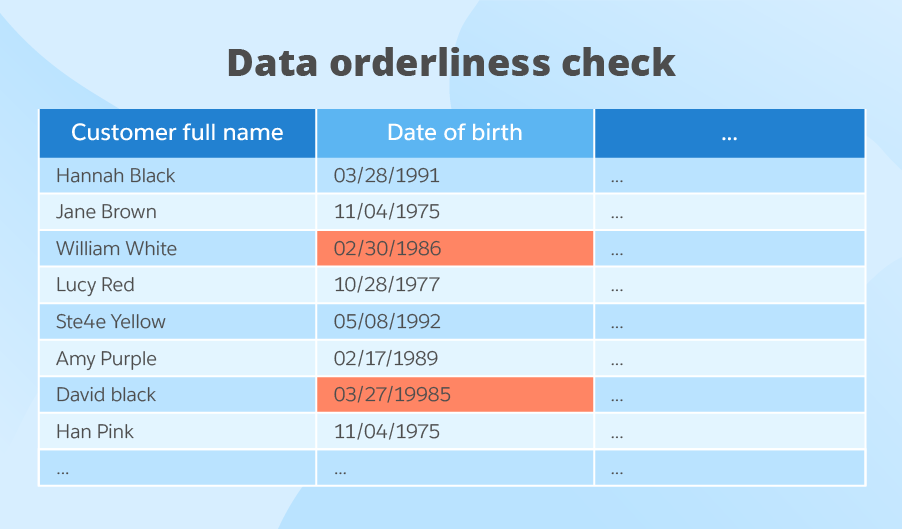
From our consulting practice, we know that even the companies that have put significant effort into demand forecasting can still go the extra mile and improve the accuracy of their predictions. So, if you’re one of the companies who want reliable demand forecasts on their radars, this is the right page for you.

Though a 100% precision is impossible to achieve, we believe data science can get you closer to it, and we’ll show how. Our data scientists have chosen the most prominent demand forecasting methods based on both traditional and contemporary data science to show you how they work and what their strengths and limitations are. We hope that our overview will help you opt for the right method, which is one of the essential steps to creating a powerful demand forecasting solution.

Demand forecasting using data science

Traditional data science: The ARIMA model

A well-known traditional data science method is the autoregressive integrated moving average (ARIMA) model. As the name suggests, its main parameters are autoregressive order (AR), integration order (I) and moving average order (MA).

The AR parameter identifies how the values of the previous period influence the values of the current period. For example, tomorrow the sales for SKU X will be high if the sales for SKU X were high during the last three days.

The I parameter defines how the difference in the values of the previous period influence the value in the current period: tomorrow the sales for SKU X will be the same if the difference in sales for SKU X was minimal during the last three days.

The MA parameter identifies the model’s error based on all the observed errors in its forecasts.

Strengths of the ARIMA model

  • ARIMA works well when the forecast horizon is short-term and when the number of demand-influencing factors is limited.

Limitations of the ARIMA model

  • ARIMA is unlikely to produce accurate long-term forecasts as it doesn’t store insights for long time periods.
  • ARIMA assumes that your data doesn’t show any trend or seasonal fluctuations, while these conditions are sure not to be met in real life.
  • ARIMA requires extensive feature engineering efforts to capture root causes of data fluctuations and that is a lengthy and labor-intensive process. For example, a data scientist should mark particular days of the month as weekends for ARIMA to take into account this factor. Otherwise, it won’t recognize the impact of a particular day on sales.
  • The model can be time-consuming as every SKU or subcategory requires separate tuning.
  • It can only handle numerical data, such as sales values. This means that you can’t take into account such factors as weather, store type, store location and promotion influence.
  • It fails to capture non-linear dependencies, and that’s the kind of dependencies that is most frequent. For example, with 5% off promotion, toys from Frozen witnessed a 3% increase in sales. If the discount becomes twice higher – 10%, this doesn’t mean that the company should expect a double increase in sales to 6%. Besides, if they run a 5% promotion for Barbie dolls, their sales can increase by 9% as promotion influences various categories differently.

Contemporary data science: Deep neural networks

Since there are so many limitations to traditional data science, it’s natural that there are other, more reliable approaches, namely contemporary data science. There’s no better candidate to represent contemporary data science than a deep neural network (DNN). Recent research papers show that DNNs outperform all the other forecasting approaches in terms of effectiveness and accuracy of predictions. To usher you into the promising world of deep learning, our data scientists composed a 5-minute introduction to DNNs that comprises both the theory part and the practical example.

What are DNNs made of?

Deep neural network architecture

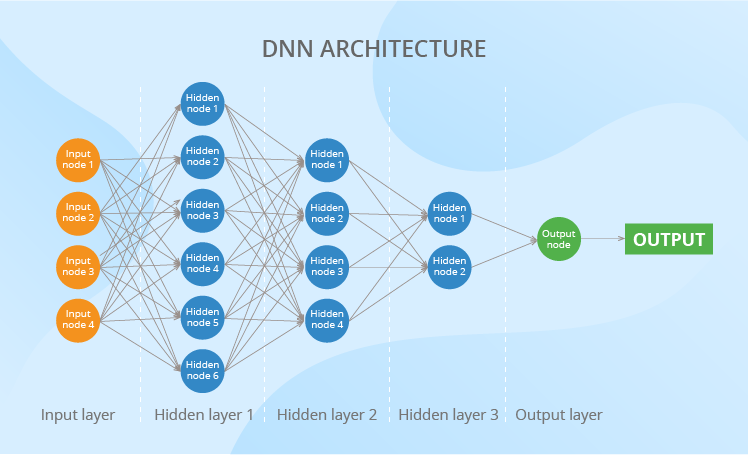
Here’s the architecture of a standard DNN. To read this scheme, you should know just 2 terms – a neuron and a weight. Neurons (also called ‘nodes’) are the main building blocks of a neural network. They are organized in layers to transmit the data along the net, from its input layer all the way to the output one.

As to the weights, you can regard them as coefficients applied to the values produced by the neurons of the previous layer. Weights are of extreme importance as they transform the data along its way through a DNN, thus influencing the output. The more layers a DNN has or the more neurons each layer contains, the more weights appear.

What data can DNNs analyze?

DNNs can deal equally well with numerical and categorical values. In the case with numerical values, you give the network all needed figures. And in case with categorical values, you’ll need to use ‘0-1’ language. It usually works like this: if you want to input a particular day of the week (say, Wednesday), you should have seven neurons, and you’ll give 1 to the third neuron (which will mean Wednesday) and zeroes to all the rest.

The vast diversity of data that a DNN is able to ingest and analyze allows considering multiple factors that can influence demand, thus improving the accuracy of forecasts. The factors can be internal, such as store location, store type and promotion influence, and external ones – weather, changes in GDP, inflation rate, average income rate, etc.

And now, a practical example. Say, you are a manufacturer who uses deep neural networks to forecast weekly demand for their finished goods. Then, you may choose the following diverse factors and data for analysis.

Factors to analyze What each factor reflects Number of neurons for the input layer
8 previous weeks’ sales figures Latest trends 8
Weeks of the year Seasonality 52 (according to the number of weeks in a year)
SKUs Patterns specific to each SKU 119 (according to the number of SKUs in your product portfolio)
Promotion The influence of promotion 1 (Yes or No)
    Total number of input neurons: 180

In addition to showing the diversity of data, the table also draws the connection between the business and technical aspects of the demand forecasting task. Here, you can see how factors are finally converted into neurons. This information will be useful for understanding the sections that follow.

Where does DNN intelligence come from?

There are two ways for a DNN to get intelligence, and they peacefully coexist. Firstly, this intelligence comes from data scientists who set the network’s hyperparameters and choose most suitable activation functions. Secondly, to put its weights right, a DNN learns from its mistakes.

Activation functions

Each neuron has an activation function at its core. The functions are diverse and each of them takes a different approach to converting the values they take in. Therefore, different activation functions can reveal various complex linear and non-linear dependencies. To ensure the accuracy of demand forecasts and not to miss or misinterpret exponential growth or decline, surges and temporary falls, waves, and other patterns that data shows, data scientists carefully choose the best set of activation functions for each case.

Hyperparameters

There are dozens of hyperparameters, but we’d like to focus on a more down-to-earth one, such as the number of hidden layers required. Choosing this parameter right is critical for making a DNN able to identify complex dependencies. The more layers, the more complex dependencies a DNN can recognize. Each business task, and consequently, each DNN architecture designed to solve this task, requires an individual approach to the number of its hidden layers.

Suppose in our example, data scientists decided that the neural network requires 3 hidden layers. They also came up with the coefficients that change the number of neurons in the hidden layers (these coefficients are always applied to the number of neurons in the input layer). Here are their findings:

Layer Coefficient Number of neurons in the layer
Input layer   180
Hidden layer 1 1.5 270
Hidden layer 2 1 180
Hidden layer 3 0.5 90
Output layer   1
    Total number of neurons in the network: 721

Usually, data scientists create several neural networks and test which one shows better performance and higher accuracy of predictions.

Weights

To work properly, a DNN should learn which of its actions is right and which one is wrong. Let’s look at how the network learns to set the weights right. At this stage, regard it as a toddler who learns from their personal experience and with some supervision of their parents.

The network takes the inputs from your training data set. This data set is, in fact, your historical sales data broken down to SKU and store level, which may also contain store attributes, prices, promotions, etc. Then, the network lets this data pass through its layers. And, at first, it applies random weights to it and uses predefined activation functions.

However, the network doesn’t stop when it produces an output – a weekly demand for SKU X. Instead, it uses loss function to calculate to which extent the output the network got differs from the one that your historical data shows. Then, the network triggers optimization algorithms to reassign the weights and starts the whole process from the very beginning. The network repeats this as many times (can be thousands and millions) as needed to minimize the mistake and produce an optimal demand.

To let you understand the scale of it all: the number of weights that a neural network tunes can reach hundreds of thousands. In our example, we’ll deal with 113,490 weights. No serious math is required to get this figure. You should just multiply the number of neurons in one layer by the number of neurons in the layer that follows and sum it all up: 180×270 + 270×180 + 180×90 + 90×1 = 113,490. Impressive, right?

Demand forecasting challenges that DNNs overcome

New product introduction

Challenge: Historical data is either limited or doesn’t exist at all.

Solution: A DNN allows clustering SKUs to find lookalikes (for instance, based on their prices, product attributes or appearance) and use their sales histories to bootstrap forecasting.

The thing is that you have all the historical data for the lookalikes because they are your tried-and-tested SKUs. So, you can take their weekly sales data and use it as a training data set to estimate the demand for a new product. As discussed earlier, you can also add external data to increase the accuracy of demand predictions – for example, social media data.

Another scenario here could be: a DNN is tuned to cluster new products according to their performance. This helps to predict how a newly launched product will perform based on its behavior at the earliest stages compared to the behavior of other new product launches.

Complex seasonality

Challenge: For some products (like skis for the winter or sunbathing suits for the summer), the seasonality is obvious, while for others, the patterns are not so easy to spot. If you are looking for multiple seasonal periods or high-frequency seasonality, you need something more efficient than trivial methods.

Solution: Just like with new product introductions, the task of identifying complex seasonality can be solved with the help of clustering. A DNN sifts through hundreds and thousands of sales patterns of each SKU to find similar ones. If particular SKUs belong to the same cluster, they are likely to show the same sales patterns in the future.

Weighing the pros and cons of DNNs

Now that we know how a DNN works, we can consider the upsides and downsides of this method.

Strengths of DNNs

Compared to traditional data science approaches, DNNs can:

  • Consider multiple factors based on diverse data (both external and internal, numerical and categorical), thus increasing the accuracy of forecasts.
  • Capture complex dependencies in data (both linear and non-linear) thanks to multiple activation functions embedded into the neurons and cleverly set weights.
  • Successfully solve typical demand forecasting challenges, such as new product introductions and complex seasonality.

Limitations of DNNs

Although DNNs are the smartest data science method for demand forecasting, they still have some limitations:

  • DNNs don’t choose analysis factors on their own. If a data scientist disregards some factor, a DNN won’t know of its influence on the demand.
  • DNNs are greedy for data to learn from. The size of the training data set should not be less than the number of weights. And, as we have already discussed, you can easily end up with hundreds of thousands of weights. Correspondingly, you’ll need as many data records.
  • If a DNN is trained incorrectly, it can fail to distinguish erroneous data from the meaningful signals. As a result, such a network can produce accurate forecasts on the training data but bring up distorted outputs while dealing with new incoming data. This problem is called overfitting, and data scientists can fight it using a dropout technique.
  • Non-technical audience tends to perceive DNNs as ‘magic boxes’ that produce ungrounded figures. You should put some effort into making your account managers trust DNNs.
  • DNNs still can’t take into account force majeure, like natural disasters, government decisions, etc.

So, where does your heart lie?

From our consulting experience, we see that contemporary data science in most cases outperforms traditional methods, especially when it comes to identifying non-linear dependencies in data. However, this doesn’t mean that traditional data science methods should be completely disregarded. They still can be considered for producing short-term forecasts. For example, recently we successfully delivered sales forecasting for an FMCG manufacturer, where we applied linear regression, ARIMA, median forecasting, and zero forecasting.


Bringing data science on board is promising, yet difficult. We’ll solve all the challenges and let you enjoy the advantages that data science offers.

Hire Data Scientists Efficiently with Our 3 Tips


Optimized supply chains, improved production efficiency, personalized customer experience, and boosted sales effectiveness are just some of the gains that our customers pursue when they turn to data science consulting services. Facing the growing demand for data science talent, we, at ScienceSoft, decided to cover a burning topic of how to hire data scientists. Here, we answer 3 main questions: what skills a data scientist should possess, how to assess those skills, and where to search for the right person.

how to hire a data scientist

What data scientist do you need?

To narrow the initial list of candidates down and make the shortlisting pipeline more efficient, we recommend that you clearly define a needed data scientist’s profile. With a vast variety of skills that a data scientist is expected to possess (including the endless list of big data technologies and machine learning algorithms), you can never find a data science unicorn who handles all these things with the same mastery.

So, you can devise an ideal data scientist’s profile on your own or find the appropriate option among the existing classifications. For example, ScienceSoft adheres to a classification that recognizes 2 data scientists types: analysts and technicians.

How to assess data scientists’ skills?

The approach to skills assessment depends on which of the 3 scenarios listed below your company favors:

  1. Growing in-house data science capabilities (this scenario also covers team augmentation).
  2. Resorting to data science consulting services (when you hire an external consultant for knowledge transfer to boost the development of your internal data science capabilities).
  3. Outsourcing data science (when you don’t plan to develop in-house data science capabilities).

Approach 1. When you search to grow in-house data science capabilities.

  • Check the candidates’ CVs.
  • Challenge a candidate with a test to validate their skills.
  • (Optional) Organize an in-house data challenge (for example, the way Airbnb does).

Approach 2. When you search for a consulting/outsourcing partner.

  • Check a candidate company’s competence and experience: study their portfolio of implemented projects, check the attained partnerships and certificates.
  • Ask to deliver a proof of concept (for complex projects).

Where to find a data scientist?

Now, when you know whom to chase, let’s discuss where to search for. Job sites, recruitment agencies, and professional networks like LinkedIn is the triad that easily comes to mind. However, considering the shortage of data scientists, these traditional resources may turn out to be insufficient. In addition, these channels are mainly tuned to hiring data scientists for growing in-house teams. If you consider data science consulting or outsourcing rather than team augmentation, ScienceSoft recommends turning your attention to three extra sources:

  • Tech communities like GitHub and Stack Overflow – you’ll find the profiles of data scientists there.
  • Listings, like this one featuring the best data science consultancies.
  • Homepages of data science consulting and outsourcing companies where you can check the service and project portfolio of a certain vendor.

Let the effective search for data scientists begin!

Now, you know what these fantastic data scientists are and where to find them. We hope that our tips will help you make your hunt for data scientists efficient and fast, and your data science-powered projects a true success.


Bringing data science on board is promising, yet difficult. We’ll solve all the challenges and let you enjoy the advantages that data science offers.

Ecommerce Business Intelligence: Features, Gains, Costs


SAP BusinessObjects Business Intelligence

Oracle Business Intelligence

Basic ecommerce BI capabilities

Advanced visualization capabilities

Native: with other SAP products.

Via SAP Translator Program or RFC interface: with third-party software.

Native: with other Oracle products.

Via Oracle connectors: with third-party software.

Native: with Microsoft products.

Via APIs: with third-party software.

Seamless integration with any required business solution (including legacy software) and third-party systems.

Compliance with global data security standards.

Compliance with global data security standards.

Compliance with global data security standards.

Compliance with all required global and regional ecommerce data protection regulations.

Pricing 50 users/ 3 years of use

Upon request to the vendor

Expect to pay initial setup fees + configuration, customization, and integration fees + maintenance and support fees.

~$370,000 depending on the use of data integration functionality.

NB: Updates and maintenance costs as well as analytics server administrator rights fees are not included.

$200,000 with data-sharing rights for all users.

NB: may require updates and maintenance costs.

Upfront investments of $50,000$1,000,000, depending on solution complexity.

Unlimited number of users, integrations, and any required advanced capabilities included.

No additional fees.

Making Use of the Alliance


Having implemented a business intelligence solution long ago, you keep monitoring recent trends to understand what the market can offer. While doing your research, you must have noticed that business intelligence often goes side by side with data analytics. Does this mean that you can enrich your existing BI solution by following promising data analytics trends? Is the synergy of BI and DA possible? Let’s find this out.

BI and data analytics

Business intelligence and data analytics – two sides of the same coin          

A quick search on the internet is enough to understand that these two terms are used inconsistently: different vendors, service providers and other market players keep to their internal definitions. That is why, some sources consider business intelligence and data analytics two different concepts, while the others use these terms interchangeably. We define them as follows:

Business intelligence (BI) is a technology-based process of analyzing data and presenting actionable insights to help business users make informed decisions. The implementation of BI includes three main stages:

  • Developing a data warehouse
  • Designing online analytical processing (OLAP) cubes
  • Visualizing data.

Data analytics is a catchall term that encompasses business intelligence as well as advanced approaches and methods to collecting, processing and analyzing data sets to identify trends, dependencies and correlations. The term is broad and is applicable to both business and science. Data analytics includes:

  • Data mining
  • Predictive and prescriptive analytics
  • Big data analytics, etc.

How to achieve the synergy of BI and DA

Usually invisible to end business users, data analytics uses complicated algorithms and statistical approaches to provide extra insights, which then can enrich habitual reports. Here, we share some illustrative examples of how business intelligence and data analytics can work together.

  1. Cohort analysis allows considering online store visitors not as a whole, but broken down into different user groups that show similar behavior patterns. Such groups may become a dimension for the OLAP cube. Business decision makers can compare them by sales, profit, the number of orders per month, etc. to design personalized marketing activities.
  2. Regression analysis allows identifying the relationship between variables. The dependency (or the lack of dependency) between them can provide companies with extra insights, as opposed to historical data alone. For instance, it is interesting to look at the total number of complaints and top-10 complaints. But with regression analysis, you may also find out whether the wait time and the number of complaints are connected.
  3. Time series analysis is applied to historical data to create forecasts. Let’s say, you want to predict sales. For this, you need to have sales figures for several previous years, split by month. Based on this data, an analytical system will identify past trends, monthly growth/decline rates, repeating patterns, if any, and will make the best possible estimate for the future.

Data analytics trends are definitely worth attention

Let’s look at some data analytics trends and find out how they can help enrich your existing BI solution. By the way, you may find the same trend in both BI and data analytics lists (do you remember the inconsistency of the terms we mentioned above’). The implementation of some initiatives will cause little pain, while others may require significant changes in the technology stack, approaches and methods.

1. Machine-learning based artificial intelligence

Let’s talk here about the problem of customer churn. Traditional BI solutions help you understand how many customers left you last week/quarter/month. Looking at the churn rates, you naturally start thinking about how to return these customers. Still, the moment is gone – the customers have already switched to your competitors, and now you’ll have to do your best to win them back.

With machine learning-based AI, businesses can identify high-risk customer segments well in advance. The analytical system can assess customers’ activities across all channels and signal if their behavior looks like they are going to leave. For example, a customer contacts the support center more frequently than the average customer does, or they start using your services less often, or their average spend significantly decreases. Of course, the set of symptoms will be specific to each industry. And you need to identify the ones that are essential for your business, score each symptom and let your analytical system learn. As a result, your system will inform you about a possible churn well in advance for you to take actions, such as targeted marketing campaigns.

2. Predictive analytics

Having timely and accurate reports that depict historical data is great. However, many businesses may find this insufficient. In fact, companies also need to understand what is likely to happen in the future to take preventive actions today. Here, predictive analytics comes to rescue.

Imagine a manufacturer of outdoor clothing who is planning their range for the next winter season. They may look at past sales split by category and plan production volumes accordingly. But will it be insightful? Alternatively, they may apply a time series analysis that we have described above.

As fashion is fast-paced, the manufacturer needs even more insights to forecast customer demand, decide on the winter range and plan the production volume for every item. For example, the producer can additionally analyze weather forecasts (the colder the winter, the less three-quarter coats should be in the range) and the trends that are becoming popular on social media.

3. Big data

If your business is on the brink of an important change that will require collecting, processing and analyzing big data (such as installing sensors to your machinery to foster preventive maintenance or launching an e-store in addition to brick-and-mortar ones, etc.), your analytical system should also be able to handle this new challenge. A traditional BI solution should be extended. Big data requires a dedicated technology stack, such as Apache Hadoop, Apache Hive, Apache Spark, etc. To get valuable insights from big data sets, you have a wide variety of data analytics methods and techniques at your disposal, for instance, pattern matching.

On a final note

If you have a BI solution implemented, this does not mean that you have hit the ceiling. The market is always developing and offering new business intelligence services. There are always ways to improve the existing solution.

While checking the recent trends, don’t limit yourselves to business intelligence only. Check out the list available for data analytics, as well. For some businesses, traditional business intelligence may suffice, but some companies may find it reasonable to enrich the existing solution with data analytics to get more insights.


Are you striving for informed decision-making? We will convert your historical and real-time data into actionable insights and set up forecasting.

How Big Data Influences Your IoT Solution


The number of Internet connected devices is projected to triple by 2025. Correspondingly, IoT is joining the line of important big data sources. This makes data practitioners turn their attention to IoT big data.

IoT big data nature

The nature of IoT big data

IoT big data is distinctly different from other big data types. To form a clear picture, imagine a network of sensors that continuously generate data. In manufacturing, for example, it can be the temperature values of a particular machinery part, as well as vibration, lubrication, humidity, pressure and more. So, IoT big data is machine-generated, not created by humans. And it mainly represents the flow of numbers, not chunks of text.

Now, imagine that each sensor produces 5 measurements per second and, overall, you have 1,000 sensors installed. And this high-volume data is incessantly flowing (by the way, such data has a special name – streaming data). Definitely, pure data collection is not your ultimate goal – you need valuable insights, some of which as close as possible to real-time. If the pressure starts suddenly plunging to the critical level, you won’t be happy to know about this only in a couple of hours. By that time, your maintenance team might have already been trying to repair a broken machinery unit.

Besides, IoT data is location and time specific. While examples can be numerous, here we’ll mention only a couple: location data is critical to understand which of the sensors communicates the readings that are likely to signal an upcoming failure, while a timestamp is essential to identify a particular pattern that is likely to cause a machinery breakdown. For instance, every ten seconds a temperature value increases by 5 F still without surpassing a threshold, which leads to increasing pressure by 1,000 Pa for one minute.

Storage, preprocessing and analysis of IoT big data

Of course, it’s your business objectives that always lay the foundation for the solution’s architecture. Still, the nature of IoT big data leaves its mark on data storage, preprocessing and analysis. So, let’s take a closer look at the specific features of each process.

IoT big data storage

As you’ll have to deal with high volumes of quickly arriving structured and unstructured data in different formats, a traditional data warehouse will not meet your requirements – you need a data lake and a big data warehouse. A data lake may be split into several zones such as a landing zone (for raw data in their original format), a staging zone (for the data after a basic cleaning and filtering applied and for raw data from other data sources), as well as analytics sandbox (for data science and exploratory activities). A big data warehouse is required to extract the data from a data lake, transform it and store in a more organized way.

IoT big data preprocessing

It’s important to decide whether you would like to store raw or already preprocessed data. In fact, answering this question right is one of the challenges connected to IoT big data. Let’s return to our example with a sensor that communicates 5 temperature values per second. One option is to store all 5 readings, while the other is to store only one value such as their average/median/mode per aggregation period of one second. To clearly visualize what difference such an approach makes to the required storage capacity, you should multiply the overall number of sensors by their expected running time and then by their reading frequency.  

If you belong to 70% of the organizations that value managing data in real time, and a part of your plan is getting real-time insights, it’s still possible to have real-time alerts without sending all the readings to the data storage. For example, your system is able to ingest the whole flow of data, and you’ve set critical thresholds or deviations that trigger instant alerts. Still, only some filtered or compressed data is sent to the data storage.

Ways to avoid data losses

It’s also necessary to think in advance what if the flow of readings stops for some reason, let’s say due to a temporary failure of a sensor or a loss of its connection with the gateway.

Here, two approaches are possible:

  • Using robust algorithms that are reliable to data omissions.
  • Using redundant sensors, for example, having several sensors to measure the same parameter. On the one hand, this increases reliability: if one sensor fails, the others will continue sending their readings. On the other hand, this approach requires more complicated analytics, as the sensors may generate slightly different values what should be processed by analytical algorithms.

IoT big data analysis

IoT big data demands two types of analytics: batch and streaming. Batch analytics is inherent in all big data types, and IoT big data is not an exception. It is widely used to run a complex analysis on the captured data to identify trends, correlations, patterns and dependencies. Batch analytics involves sophisticated algorithms and statistical models applied to historical data.

Streaming analytics perfectly covers all the specifics of IoT big data. It is designed to deal with high-speed flows of data generated within small time intervals and to provide near real-time insights. For different systems, this ‘real-time’ parameter will vary. In some cases, it can be measured in milliseconds, while in others – in several minutes. To get insights as fast as possible, the captured data can be analyzed at the system’s edge or even in a data streaming processor.

To sum it up

By nature, IoT big data is machine-generated, high-volume, streaming, location and time specific. Big data consulting practice proves how important it is to have these features considered prior to designing and developing an IoT solution. We are sure that you don’t want to run out of storage space in just a couple of months, or miss real-time insights just because your solution does not support streaming analytics, or face any other problem that undermines the robustness of your IoT solution. To avoid this, it’s necessary to clearly identify your short-term and long-term business requirements, as well as carefully choose an optimal big data architecture and technology stack from multiple options.


Big data is another step to your business success. We will help you to adopt an advanced approach to big data to unleash its full potential.

twins or just strangers with similar looks?


Apache Cassandra and Apache HBase are much like two strangers whom you meet in the street and think to be twins. You don’t really know them, but their similar height, clothes and hairstyles make you see no differences between them. However, after having a closer look, you realize that these two looked identical only at a distance.

Having numerous similarities, like being NoSQL wide-column stores and descending from BigTable, Cassandra and HBase do differ. For instance, HBase doesn’t have a query language, which means that you’ll have to work with JRuby-based HBase shell and involve extra technologies like Apache Hive, Apache Drill or something of the kind. While Cassandra can boast its own CQL (Cassandra Query Language), which Cassandra specialists find most helpful.

Cassandra vs. HBase

1. Data model

HBase

HBase data model

Here we have a table that consists of cells organized by row keys and column families. Sometimes, a column family (CF) has a number of column qualifiers to help better organize data within a CF.

A cell contains a value and a timestamp. And a column is a collection of cells under a common column qualifier and a common CF.

Within a table, data is partitioned by 1-column row key in lexicographical order, where topically related data is stored close together to maximize performance. The design of the row key is crucial and has to be thoroughly thought through in the algorithm written by the developer to ensure efficient data lookups.

Cassandra

Cassandra data model

Here we have a column family that consists of columns organized by row keys. A column contains a name/key, a value and a timestamp. In addition to a usual column, Cassandra also has super columns containing two or more subcolumns. Such units are grouped into super column families (although these are rarely used).

In the cluster, data is partitioned by a multi-column primary key that gets a hash value and is sent to the node whose token is numerically bigger than the hash value. Besides that, the data is also written to an additional number of nodes that depends on the replication factor set by Cassandra practitioners. The choice of additional nodes may depend on their physical location in the cluster.

HBase vs. Cassandra (data model comparison)

The terms are almost the same, but their meanings are different. Starting with a column: Cassandra’s column is more like a cell in HBase. A column family in Cassandra is more like an HBase table. And the column qualifier in HBase reminds of a super column in Cassandra, but the latter contains at least 2 subcolumns, while the former – only one.

Besides, Cassandra allows for a primary key to contain multiple columns and HBase, unlike Cassandra, has only 1-column row key and lays the burden of row key design on the developer. Also, Cassandra’s primary key consist of a partition key and clustering columns, where the partition key also can contain multiple columns.

Despite these ‘conflicts,’ the meaning of both data models is pretty much the same. They have no joins, which is why they group topically related data together. They both can have no value in a certain cell/column, which takes up no storage space. They both need to have column families specified while schema design and can’t change them afterwards, while allowing for columns’ or column qualifiers’ flexibility at any time. But, most importantly, they both are good for storing big data.

2. Architecture

Cassandra has a masterless architecture, while HBase has a master-based one. This is the same architectural difference as between Cassandra and HDFS.

This means that HBase has a single point of failure, while Cassandra doesn’t. An HBase client does communicate directly with the slave-server without contacting the master, which gives the cluster some working time after the master goes down. But, this can hardly compete with the always-available Cassandra cluster. So, if you can’t afford any downtimes, Cassandra is your choice.

However, to ensure availability, Cassandra replicates and duplicates data, which leads to data consistency problems. This makes Cassandra a bad choice if your solution depends heavily on data consistency, unlike the strongly consistent HBase. Because the latter writes data only to one place and always knows where to find it (data replication is done ‘externally’ in HDFS).

Besides, Cassandra’s architecture supports both data management and storage, while HBase’s architecture is designed for data management only. By its nature, HBase relies heavily on other technologies, such as HDFS for storage, Apache Zookeeper for server status management and metadata. And again, it needs extra technologies to run queries.

3. Performance

Cassandra’s and HBase’s on-server write paths are very much alike. There’re only slight differences: names for data structures and the fact that, unlike Cassandra, HBase doesn’t write to the log and cache simultaneously (it makes writes slower).

On the higher architectural level, HBase has even more disadvantages:

  1. Before getting to the needed server, the client has to ‘ask’ Zookeeper which server has the hbase:meta table containing info about all tables’ locations in the cluster. Then, the client asks the meta-table-holding server ‘who’ stores the actual table it needs to write to. And only after that the client writes the data to the needed place. If such writes (and also reads) are frequent, this info is of course cached. But if a table region is moved to another server, the client needs to do the full round again. While Cassandra’s data distribution and partitioning based on consistent hashing is much cleverer and quicker than that.
  2. As soon as the in-HBase write path ends (cached data gets flushed to the disk), HDFS also needs time to physically store the data.

Cassandra vs. HBase write

Moreover, the actual measurements of Cassandra’s write performance (in a 32-node cluster, almost 326,500 operations per second versus HBase’s 297,000) also prove that Cassandra is better at writes than HBase.

If you need lots of fast and consistent reads (random access to data and scans), then you can opt for HBase. It writes only on one server, so there is no need to compare different nodes’ data versions. HBase servers also don’t have too many data structures to check before finding your data. You may think that HBase’s read is inefficient since the data is actually stored in HDFS, and HBase needs to get it out of there every time. But HBase has a block cache that has all frequently accessed HDFS data, plus bloom filters with all other data’s approximate ‘addresses,’ which speeds up data retrieval. Essentially, HBase and HDFS’s index system is multi-layered, which is much more efficient than Cassandra’s indexes (check out our article on Cassandra performance to find out more about reads).

If you’ve read that Cassandra is also very good at reads, you may be bewildered by the conclusion that HBase is better. Especially if you saw this benchmarking experience where Cassandra handles 129,000 reads per second against HBase’s just 8,000 (in a 32-node cluster). The thing is, these reads are targeted (based on known primary keys) and, chances are, they are also quite inconsistent. So, Cassandra’s huge numbers fade, if we’re speaking about scans and consistency.

4. Security

Like all NoSQL databases, HBase and Cassandra have their security issues (the main one being that securing data spoils performance making the system heavy and inflexible). But it’s safe to say that both databases have some features to ensure data security: authentication and authorization in both and inter-node + client-to-node encryption in Cassandra. HBase, in its turn, provides the much-needed means for secure communication with other technologies it relies upon.

A bit more detail:

Both Cassandra and HBase provide not just database-wide access control but allow a certain level of granularity. Cassandra enables row-level access and HBase goes as deep as cell-level. Cassandra defines user roles and sets conditions for these roles which later determine whether a user can see particular data or not. While HBase has an inverse ‘move.’ Its administrators assign a visibility label to data sets and then ‘tell’ users and user groups what labels they can see.

5. Application areas

Judging by how Cassandra and HBase organize their data models, they are both really good with time-series data: sensor readings in IoT systems, website visits and customer behavior, stock exchange data, etc. They both store and read such values nicely. Besides that, scalability is the property they both have: Cassandra – linear, HBase – linear and modular ones.

However, when it comes to scanning huge volumes of data to find a small number of results, due to having no data duplications, HBase is better. For instance, this reason applies to HBase’s ability to handle text analysis (based on web pages, social network posts, dictionaries and so on). Plus, HBase can do well with data management platforms and basic data analysis (counting, summing and such; due to its coprocessors in Java).

Cassandra is good for huge volumes of data ingestion, since it’s an efficient write-oriented database. With it, you’ll build a reliable and available data store. In addition, Cassandra enables you to create data centers in different countries and keep them running in sync. Besides, if you couple Cassandra with Spark, you can also achieve good scan performance.

But the main difference between applying Cassandra and HBase in real projects is this. Cassandra is good for ‘always-on’ web or mobile apps and projects with complex and/or real-time analytics. But if there’s no rush for analysis results (for instance, doing data lake experiments or creating machine learning models), HBase may be a good choice. Especially if you’ve already invested in Hadoop infrastructure and skill set.

Cassandra vs. HBase – a recap

Cassandra is a ‘self-sufficient’ technology for data storage and management, while HBase is not. The latter was intended as a tool for random data input/output for HDFS, which is why all its data is stored there. Besides, HBase uses Zookeeper as a server status manager and the ‘guru’ that knows where all metadata is (to avoid immediate cluster failures, when the metadata-containing master goes down). Consequently, HBase’s complex interdependent system is more difficult to configure, secure and maintain.

Cassandra is good at writes, whereas HBase is good at intensive reads. Cassandra’s weak spot is data consistency, while HBase’s pain is data availability, although both try to mitigate the adverse consequences of these problems. Also, both don’t stand frequent data deletes and updates.

So, Cassandra and HBase are definitely not twins but just two strangers with a similar hairstyle. To choose between the two, you should thoroughly analyze your tasks. And then, try to find a way to strengthen the database’s weak spots without affecting its performance.


Need professional advice on big data and dedicated technologies? Get it from ScienceSoft, big data expertise since 2013. 

How to translate a corporate strategy into KPIs


Imagine a spine-chilling scenario: a corporate strategy that was supposed to bring a company to success, lies on a shelf forgotten by its creators and collects dust. At first glance, this scenario is unlikely, as a strategy is the cornerstone of any business. However, BI consulting practitioners have the opposite opinion: this is exactly what happens if a corporate strategy is not supported with the right KPIs.

A strategy may be brilliant, still its execution is likely to fail if the team lacks understanding of how their daily efforts influence the final target. Besides, if a company does not reflect its strategy in KPIs, it is easy to lose focus and step aside, especially at the very beginning when the progress is not obvious. Without right KPIs, a company may lack focus in its actions and consistency in its messages and activities.

Corporate strategy in KPIs

Defining KPIs metrics: examples of doing it right and wrong

Let’s take a look at a great real-life example. In 2015, Walmart was brave to declare their intentions publicly through posting their 3-year growth plan on their website. Together with a simple and straightforward goal of turning omnichannel and delivering a seamless shopping experience at scale, Walmart indicated the target of $45-60B new sales to measure the success. Besides, Walmart indicated 5 growth areas and listed relevant KPIs for each.

Thanks to KPIs, Walmart ensured that everybody spoke the same language, understood the priorities, and knew how to measure the progress. For example, Delivering value goes with price leadership and private brands KPIs; the strategic objective of Providing convenience aims at e-commerce, online grocery and smaller formats; key geographies are narrowed down to the North America and China.

Unlike Walmart, companies usually leave their targets for internal use only. However, it does not mean that they fail to set the right KPIs. For instance, Procter and Gamble also published their strategic objectives, albeit with no targets indicated on their website. At the same time, it is clear that the company did a great job of defining KPIs, such as operating total shareholder return for the Value creation strategy, the number of product categories under focus for Portfolio transformation, etc.

However, even large and well-known companies can make mistakes. Wells Fargo’s notorious case is an example. The bank selected cross-selling as one of their strategic initiatives and developed a relevant motivation scheme with a catchy slogan Eight is great. The idea was to incentivize the employees to reach a target of 8 products sold per customer. Years later, it turned out that Wells Fargo chose a wrong KPI. The KPI motivated to boost sales, even if it did not increase the revenue.  Besides, it was widely unrealistic, and employees opened 2 million fake accounts to reach their targets.

How business intelligence helps

Let’s find out how business intelligence can help while defining and executing a company’s strategy.

BI for defining a strategy

In a market economy with numerous players, companies tend to choose strategies that will strengthen their competitive advantages. Naturally, the first step is to identify these. At such an important stage, what matters is a fact-based opinion, not a gut feeling. To get much-needed insights, companies should analyze both internal and external data. Market research findings coupled with historical data reveal trends and opportunities to seize. For example, a FMCG manufacturer would be able to choose the markets to expand, customers’ behavior at those markets, the best-fitting product portfolio to offer (say, organic food).

BI for setting KPIs

Once a strategy is approved, the next stage is to define KPIs that will be challenging yet attainable. To do this, business analysts go for historical data analysis and forecasting. Besides, business analysts should develop a hierarchy of non-conflicting KPIs: company-based, departmental and individual. With a hierarchy of KPIs, everybody will focus on their piece of work, but all team members will be working towards a common goal. For instance, the NASA brilliantly put this principle into practice: when John F. Kennedy asked the NASA’s janitor about his job, the latter replied, ‘I am helping to put a man to the moon.’

BI for progress monitoring

When KPIs are defined and communicated to the team, performance monitoring starts. Comparing targets vs. facts and tracking the progress is essential to understand how the company advanced in executing its strategy. To make this monitoring possible, business analysts should develop a set of reports and dashboards, identify how often end users need each report, and what data (input and output) should be there. You are welcome to check our BI demo to see how such dashboards may look like.

To sum it up

Any company should support its corporate strategy with the right KPIs and constantly track the progress. Otherwise, a strategy execution is likely to fail. At all stages of strategic management, business intelligence consulting can bring the synergy. For instance, a company can benefit from data analysis services that are helpful to define a corporate strategy, set the right KPIs and monitor the progress.


We offer BI consulting services to answer your business questions and make your analytics insightful, reliable and timely.

Metrics, Process and Best Practices


Editor’s note: In the article, Irene reveals some tips on how a company can measure and improve the quality of their data. If you want to organize your data management process promptly and correctly, we at ScienceSoft are ready to share and implement our best practices. For more information, check our data management services.

One of the crucial rules of using data for business purposes is as simple as this: the quality of your decisions strongly depends on the quality of your data. However, simply knowing it isn’t extremely helpful. To get tangible results, you should measure the quality of your data and act on these measurements to improve it. Here, we throw some light on complicated data quality issues and share tips on how to excel in resolving them.

How to define data quality: attributes, measures and metrics

It would be right to start this section with a universally recognized definition of data quality. But here comes the first trouble: there is none. In this respect, we can rely on our 34-year experience in data analytics and take the liberty to offer our own definition: data quality is the state of data, which is tightly connected with its ability (or inability) to solve business tasks. This state can be either “good” or “bad”, depending on to what extent data corresponds to the following attributes:

  • Consistency
  • Accuracy
  • Completeness
  • Auditability
  • Orderliness
  • Uniqueness
  • Timeliness.

To reveal what’s behind each attribute, our data management team put together this table and filled it with illustrative examples based on customer data. We also mentioned sample metrics that can be chosen to get quantifiable results while measuring these data quality attributes. 

Data quality attributes

An important remark: for big data, not all the characteristics are 100% achievable. So, if you are a big data company, you may be interested in checking the specifics of big data quality management.

Why low data quality is a problem

Do you think that the whole problem of poor data quality is exaggerated and the attributes considered above are not worth the attention they’ve been given? We’re going to provide real-life examples of what impact low-quality data can have on business processes.

Unreliable info

A manufacturer thinks that they know the exact location of the truck transporting their finished products from the production site to the distribution center. They optimize routing, estimate delivery time, etc. And it turns out that the location data is wrong. The truck arrives later, which disrupts the normal workflow at the distribution center. Not to mention routing recommendations that turned out useless.

Incomplete data

Say, you are working to optimize your supply chain management. To assess suppliers and understand which ones are disciplined and trustworthy and which ones are not, you track the delivery time. But unlike scheduled delivery time, the actual delivery time field is not mandatory in your system. Naturally, your warehouse employees usually forget to key it in. Not knowing this critical information (having incomplete data), you fail to understand how your suppliers perform.

Ambiguous data interpretation

A machinery maintenance system may have a field called “Breakdown reason” intended to help identify what caused the failure. Usually, it takes the form of a drop-down menu and includes the “Other” option. As a result, a weekly report may say that in 80% of cases the machinery failure was caused by the “Other” reason. Thus, a manufacturer can experience low overall equipment efficiency without being able to learn how to improve it.

Duplicated data

At a first glance, duplicated data may not pose a challenge. But in fact, it can become a serious issue. For example, if a customer appears more than once in your CRM, it not only takes up additional storage but also leads to a wrong customer count. Additionally, duplicated data weakens marketing analysis: it disintegrates a customer’s purchasing history and, consequently, makes the company unable to understand customer needs and segment customers properly.

Outdated information

Imagine that a customer once completed a retailer’s questionnaire and stated that they did not have children. However, time passed – and now they have a newborn baby. The happy parents are ready to spend their budget on diapers, baby food and clothes, but is our retailer aware of that? Is this customer included in “Customers with babies” segment? No to both. This is how obsolete data may result in wrong customer segmentation, poor knowledge of the market and lost profit.

Late data entry/update

Late data entries and updates may negatively affect data analysis and reporting, as well as your business processes. An invoice sent to the wrong address is a typical example to illustrate the case. And to spice the story up even more, here’s another example on asset tracking. The system can state that the cement mixer is unavailable at the moment only because the responsible employee is several hours late with updating its status. 

Want to avoid the consequences of poor data quality?

ScienceSoft offers services ranging from consulting to implementation to help you tune your data quality management process and ensure your decision-making won’t suffer from low data quality.

Best practices of data quality management

As the consequences of poor data quality can appear disruptive, it’s critical to learn what the remedies are. Here, we share best practices that can help you improve the quality of your data.

  • Making data quality a priority

The first step is to make data quality improvement a high priority and ensure that every employee understands the problems that low data quality brings. Sounds quite simple. However, incorporating data quality management into business processes requires multiple serious steps:

  1. Designing an enterprise-wide data strategy.
  2. Creating clear user roles with rights and accountability.
  3. Setting up a data quality management process (we’ll explain it in detail later in the article).
  4. Having a dashboard to monitor the status quo.

Data quality management dashboard

A typical root cause for poor data quality is manual data entries: by employees, by customers or even by multiple users. Thus, companies should think how to automate data entry processes in order to reduce human error. Whenever the system can do something automatically (for example, autocompletes, call or e-mail logs), it is worth implementing.

  • Preventing duplicates, not just curing them

A well-known truth is that it is easier to prevent a disease than cure it. You can treat duplicates in the same way! On the one hand, you can just regularly clean them. On the other hand, you can create duplicate detection rules. They allow identifying that a similar entry already exists in the database and forbid creating another one or suggest merging the entries.

  • Taking care of both master and metadata

Nursing your master data is extremely important, but you shouldn’t forget about your metadata either. For example, without time stamps that metadata reveals, companies won’t be able to control data versions. As a result, they could extract obsolete values for their reports, instead of updated ones.

Data quality management: process stages described

Data quality management is a setup process, which is aimed at achieving and maintaining high data quality. Its main stages involve the definition of data quality thresholds and rules, data quality assessment, data quality issues resolution, data monitoring and control.

To provide as clear an explanation as possible, we’ll go beyond theory and explain each stage with an example based on customer data. Here is a sample snippet from a database:

Data quality management database sample

1. Define data quality thresholds and rules

If you think there’s only one option – perfect data that is 100% compliant with all data quality attributes (in other words, 100% consistent, 100% accurate, and so on) – you may be surprised to know that there are more scenarios than that. First, reaching 100% everywhere is an extremely cost- and effort-intensive endeavor, so normally companies decide what data is critical and focus on several data quality attributes that are most applicable to this data. Second, a company not always needs 100% perfect data quality, sometimes they can do with the level that is ‘good enough.’ Third, if you need various levels of quality for various data, you may set various thresholds for different fields. Now, you may have a question: how to measure if the data meets these thresholds or not? For that, you should set data quality rules.

Now, when the theory part is over, we’re switching to a practical example.

Say, you decide that the customer full name field is critical for you, and you set a 98% quality threshold for it, while the date of birth field is of lesser importance, and you’ll be satisfied with 80% threshold. As a next step, you decide that customer full name must be complete and accurate, and the date of birth must be valid (that is to say, it should comply with the orderliness attribute). As you’ve chosen several data quality attributes for the customer full name, all of them should hit a 98% quality threshold.

Now you set data quality rules that you think will cover all the chosen data quality attributes. In our case, these are the following:

  • Customer full name must not be N/A (to check completeness).
  • Customer full name must include at least one space (to check accuracy).
  • Customer name must consist only of letters, no figures allowed (to check accuracy).
  • Only first letters in customer name, middle name (if any) and surname must be capitalized (to check accuracy).
  • Date of birth must be a valid date that falls into the interval from 01/01/1900 to 01/01/2010.

2. Assess the quality of data

Now, it’s time to have a look at our data and check whether it meets the rules we set. So, we start profiling data or, in other words, getting statistical information about it. That’s how it works: we have 8 individual records (although your real data set is certainly much bigger than that) that we check against our first rule Customer full name must not be N/A. All the records comply with the rule, which means that data is 100% complete.

To measure data accuracy, we have 3 rules:

  • Customer full name must include at least one space.
  • Customer name must consist only of letters, no figures allowed.
  • Only first letters in customer name, middle name (if any) and surname must be capitalized.

Again, we do data profiling, for each of the rules, and we get the following results: 100%, 88% and 88% (below, we’ve highlighted the records non-compliant to the data accuracy rule). In total, we have only 92%, which is also under our 98% threshold.

Data quality management accuracy check

As for the date of birth field, we’ve identified two data records that don’t comply with the rule we set. So, data quality for this field is as high as 75%, which is also below the threshold.

Data quality management orderliness check

3. Resolve data quality issues

At this stage, we should think what caused the issues to eliminate their root cause. In our example, we identified several problems for the customer full name field that can be solved by introducing clear standards for manual data entries, as well as data quality-related key performance indicators for the employees responsible for keying data into a CRM system.

In the example with the date of birth field, the data entered was not validated against the date format or range. As a temporary measure, we clean and standardize the data. But to avoid such mistakes in the future, we should set a validation rule in the system that will not accept a date unless it complies with the format and range.

4. Monitor and control data

Data quality management is not a one-time effort, rather a non-stop process. You need to regularly review data quality policies and rules with the intent to continuously improve them. This is a must, as the business environment is constantly changing. Say, one day a company may opt for enriching their customer data by purchasing and integrating an external data set that contains demographic data. So, probably, they’ll have to come up with new data quality rules, as an external data set can contain the data they haven’t dealt with so far.

Categories of data quality tools

To address various data quality issues, companies should consider not one tool but a combination of them. For example, Gartner names the following categories:

  • Parsing and standardization tools break the data into components and bring them to a unified format.
  • Cleaning tools remove incorrect or duplicated data entries or modify the values to meet certain rules and standards.
  • Matching tools integrate or merge closely related data records.
  • Profiling tools gather stats about data and later use it for data quality assessment.
  • Monitoring tools control the status-quo of data quality.
  • Enrichment tools bring in external data and integrate it into the existing data.

Currently, the market can boast a long list of data quality management tools. The trick is that some of them focus on a certain category of data quality issues, while others cover several aspects. To pick the right tools, you should either dedicate significant time to research or let professional consultants do this job for you.

Boundless data quality management squeezed into one paragraph

Data quality management guards you from low-quality data that can totally discredit your data analytics efforts. However, to do data quality management right, you should keep in mind many aspects. Choosing the metrics to assess data quality, selecting the tools, and describing data quality rules and thresholds are just several important steps. Hopefully, this complicated task can be fulfilled with professional assistance. At ScienceSoft, we are happy to back up your data quality management project at any stage, just let us know.


Don’t allow low-quality data or faulty ETL processes discredit your business decisions. Make sure that your data is reliable, integrated and secure.

All about Customer Churn Analysis in just 3 Minutes


To prevent losing customers through customer attrition, companies turn to churn analytics. This type of analytics helps them measure, monitor and reduce the churn rate. The need for customer churn analytics is one of the reasons our clients turn to our BI implementation services. In this article, our BI experts summarize the main benefits customer churn analysis can bring and explain how to conduct it.

Customer Churn Analysis

Why analyze customer churn?

To boost profit

As churn analysis provides you with meaningful insights into how to retain your customers, there appears an opportunity for additional profit. Just look at these numbers: increasing customer retention rates by 5% can boost your profits by as much as 25% and even more. We believe that it is already convincing enough to start analyzing customer churn.

To create a better customer experience

Effective churn analysis contributes to a deeper understanding of customer journeys. Considering the point where customers are likely to leave, companies can develop a set of retention activities to create a more comfortable customer experience and fulfill customer needs much better. This creates the conditions for growing a community of loyal customers who will share their positive experiences and become brand advocates.

To optimize products and services proactively

Customer churn analysis gives companies a quite accurate prediction about customer preferences: key attributes they are looking for in products/services, features they are dissatisfied with, triggers that make customers more likely to churn, etc. Empowered with such insights, companies have valuable data, which contributes to optimizing the existing product or creating one anew.

How to calculate customer churn?

Calculating customer (=subscription) churn alone is not informative enough for most businesses, as the percentage of all customers who choose to cease the relationship with your company does not reflect its impact on your bottom line.

Customer churn rate

To learn how customer churn affects business, you also need to calculate gross revenue churn (the percentage of revenue that is lost during a targeted period)

Gross revenue churn

or employ more complex calculating methods.

How does customer churn analytics work?

Once you’ve rated your customer churn, customer data analytics and BI tools empower you to analyze it. To define triggers that cause customers to quit, you need to segment the leaving customers (through cohort analysis, analyses of churn rates by customer life cycle stages and behavior). The triggers empower you to define the likeliness of churn for every customer and set thresholds for defining at-risk customers. This way you can step in and take remedial actions for the sake of churn prevention. To create a predictive customer churn model, we recommend adding big data technologies into the analytical mix.

Stop your customers from turning their backs on you

By 2020, great customer experience is predicted to become the primary brand differentiator. And customer churn analysis allows businesses to continually improve customer experience and the overall brand image. Do you want to be among those companies? Drop a line to our BI implementation experts to stop giving out your revenue to the competition.


Empower your business by replacing guesswork with informed decision-making. We’ll guide you through this challenging but value-bringing process.

Big data security: issues, challenges, concerns


While the snowball of big data is rushing down a mountain gaining speed and volume, companies are trying to keep up with it. And down they go, completely forgetting to put on masks, helmets, gloves and sometimes even skis. Without these, it’s terribly easy to never make it down in one piece. And putting on all the precaution measures at a high speed can be too late or too difficult.

Prioritizing big data security low and putting it off till later stages of big data adoption projects isn’t always a smart move. People don’t say “Security’s first” for no reason. At the same time, we admit that ensuring big data security comes with its concerns and challenges, which is why it is more than helpful to get acquainted with them.

And as ‘surprising’ as it is, almost all security challenges of big data stem from the fact that it is big. Very big.

Big data security

Short overview

Problems with security pose serious threats to any system, which is why it’s crucial to know your gaps. Here, our big data experts cover the most vicious security challenges that big data has in stock:

  1. Vulnerability to fake data generation
  2. Potential presence of untrusted mappers
  3. Troubles of cryptographic protection
  4. Possibility of sensitive information mining
  5. Struggles of granular access control
  6. Data provenance difficulties
  7. High speed of NoSQL databases’ evolution and lack of security focus
  8. Absent security audits

Now that we’ve outlined the basic problem areas of big data security, let’s look at each of them a bit closer.

#1. Vulnerability to fake data generation

Before proceeding to all the operational security challenges of big data, we should mention the concerns of fake data generation. To deliberately undermine the quality of your big data analysis, cybercriminals can fabricate data and ‘pour’ it into your data lake. For instance, if your manufacturing company uses sensor data to detect malfunctioning production processes, cybercriminals can penetrate your system and make your sensors show fake results, say, wrong temperatures. This way, you can fail to notice alarming trends and miss the opportunity to solve problems before serious damage is caused. Such challenges can be solved through applying fraud detection approach.

#2. Potential presence of untrusted mappers

Once your big data is collected, it undergoes parallel processing. One of the methods used here is MapReduce paradigm. When the data is split into numerous bulks, a mapper processes them and allocates to particular storage options. If an outsider has access to your mappers’ code, they can change the settings of the existing mappers or add ‘alien’ ones. This way, your data processing can be effectively ruined: cybercriminals can make mappers produce inadequate lists of key/value pairs. Which is why the results brought up by the Reduce process will be faulty. Besides, outsiders can get access to sensitive information.

The problem here is that getting such access may not be too difficult since generally big data technologies don’t provide an additional security layer to protect data. They usually tend to rely on perimeter security systems. But if those are faulty, your big data becomes a low hanging fruit.

#3. Troubles of cryptographic protection

Although encryption is a well-known way of protecting sensitive information, it is further on our list of big data security issues. Despite the possibility to encrypt big data and the essentiality of doing so, this security measure is often ignored. Sensitive data is generally stored in the cloud without any encrypted protection. And the reason for acting so recklessly is simple: constant encryptions and decryptions of huge data chunks slow things down, which entails the loss of big data’s initial advantage – speed.

#4. Possibility of sensitive information mining

Perimeter-based security is typically used for big data protection. It means that all ‘points of entry and exit’ are secured. But what IT specialists do inside your system remains a mystery.

Such a lack of control within your big data solution may let your corrupt IT specialists or evil business rivals mine unprotected data and sell it for their own benefit. Your company, in its turn, can incur huge losses, if such information is connected with new product/service launch, company’s financial operations or users’ personal information.

Here, data can be better protected by adding extra perimeters. Also, your system’s security could benefit from anonymization. If somebody gets personal data of your users with absent names, addresses and telephones, they can do practically no harm.

#5. Struggles of granular access control

Sometimes, data items fall under restrictions and practically no users can see the secret info in them, like, personal information in medical records (name, email, blood sugar, etc.). But some parts of such items (free of ‘harsh’ restrictions) could theoretically be helpful for users with no access to the secret parts, say, for medical researchers. Nevertheless, all the useful contents are hidden from them. And this is where talk of granular access starts. Using that, people can access needed data sets but can view only the info they are allowed to see.

The trick is that in big data such access is difficult to grant and control simply because big data technologies aren’t initially designed to do so. Generally, as a way out, the parts of needed data sets, that users have right to see, are copied to a separate big data warehouse and provided to particular user groups as a new ‘whole’. For a medical research, for instance, only the medical info (without the names, addresses and so on) gets copied. Though, the volumes of your big data grow even faster this way. Other complex solutions of granular access issues can also adversely affect the system’s performance and maintenance.

#6. Data provenance difficulties

Data provenance – or historical records about your data – complicates matters even more. Since its job is to document the source of data and all manipulations performed with it, we can only image what a gigantic collection of metadata that can be. Big data isn’t small in volume itself. And now picture that every data item it contains has detailed information about its origin and the ways it was influenced (which is difficult to get in the first place).

For now, data provenance is a broad big data concern. From security perspective, it is crucial because:

  1. Unauthorized changes in metadata can lead you to the wrong data sets, which will make it difficult to find needed information.
  2. Untraceable data sources can be a huge impediment to finding the roots of security breaches and fake data generation cases.

#7. High speed of NoSQL databases’ evolution and lack of security focus

This point may seem as a positive one, while it actually is a serious concern. Now NoSQL databases are a popular trend in big data science. And its popularity is exactly what causes problems.

Technically, NoSQL databases are continuously being honed with new features. And just like we said in the beginning of this article, security is being mistreated and left in the background. It is universally hoped that the security of big data solutions will be provided externally. But rather often it is ignored even on that level.

#8. Absent security audits

Big data security audits help companies gain awareness of their security gaps. And although it is advised to perform them on a regular basis, this recommendation is rarely met in reality. Working with big data has enough challenges and concerns as it is, and an audit would only add to the list. Besides, the lack of time, resources, qualified personnel or clarity in business-side security requirements makes such audits even more unrealistic.

But don’t be scared: they are all solvable

Yes, there are lots of big data security issues and concerns. And yes, they can be quite crucial. But it doesn’t mean that you should immediately curse big data as a concept and never cross paths with it again. No. The thing you should do is carefully design your big data adoption plan remembering to put security to the place it deserves – first. This may be a tricky thing to do, but you can always resort to professional big data consulting to create the solution you need.


Big data is another step to your business success. We will help you to adopt an advanced approach to big data to unleash its full potential.