Data Lake Implementation: 2 Alternative Approaches


Is your company determined to implement a data lake for your big data? That’s definitely exciting and great news! However, you have challenging times ahead, as you have so many fundamental issues to clarify and decide upon. At this stage, you are most likely interested in a data lake architecture and the required technology stack. To make your journey smooth and comfortable, our big data consultants have prepared the overview of alternative implementation approaches.

Zones in a data lake

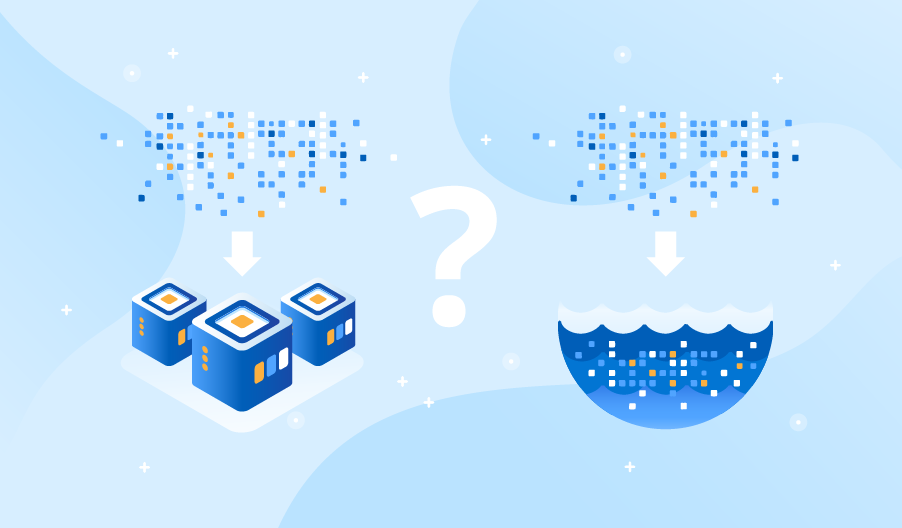
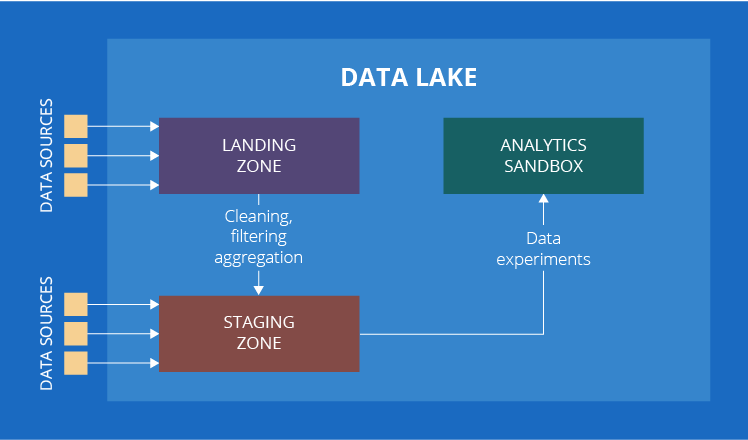
A data lake is a repository intended for storing huge amounts of data in its native format. Data lake implementation will allow you to derive value out of raw data of various types. Unlike a data warehouse, a data lake has no constraints in terms of data type – it can be structured, unstructured, as well as semi-structured. In terms of architecture, a data lake may consist of several zones: a landing zone (also known as a transient zone), a staging zone and an analytics sandbox. Of all the zones mentioned, only staging is the obligatory one, while all the others are optional. To find out what each zone is for, let’s take a closer look at them.
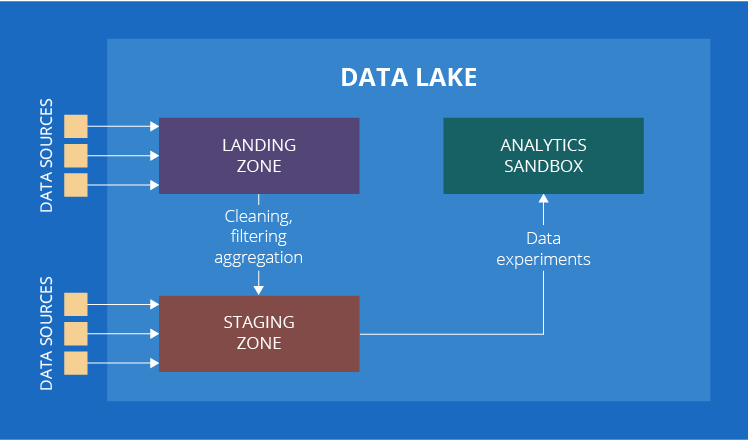
Big data lake implementation

1. Landing zone

Here comes the data (structured, unstructured and semi-structured) that undergoes preliminary cleaning and/or filtering. For example, you collect IoT data from sensors. If one of the sensors is sending abnormally high values while the other sensors that measure the same parameter have not registered anything unusual, a processing engine deployed within this zone will mark the values as erroneous.

2. Staging zone

There are two ways for data to appear in the staging zone. First, it can come from the landing zone (if any), like the sensor data from our previous example. Secondly, we can get data, which does not require any preprocessing, from other internal or external data sources. Customer comments in social networks will be a good example to illustrate this case.

3. Analytics sandbox

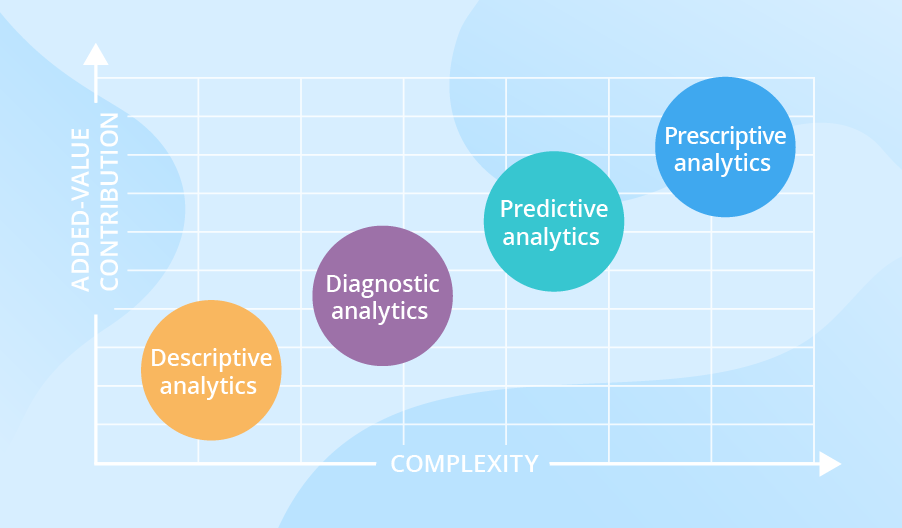
This is the zone for data experiments driven by data analysts. It is different from the analytics as we know it, as its findings (if any) are not directly used by business. By the way, we deliberately specified this if any. It happens quite often that analysts apply some models or algorithms to raw data (which may also be coupled with the data from a big data warehouse or from other internal or external data sources) and get no valuable findings. For exploratory data analytics, this is normal.

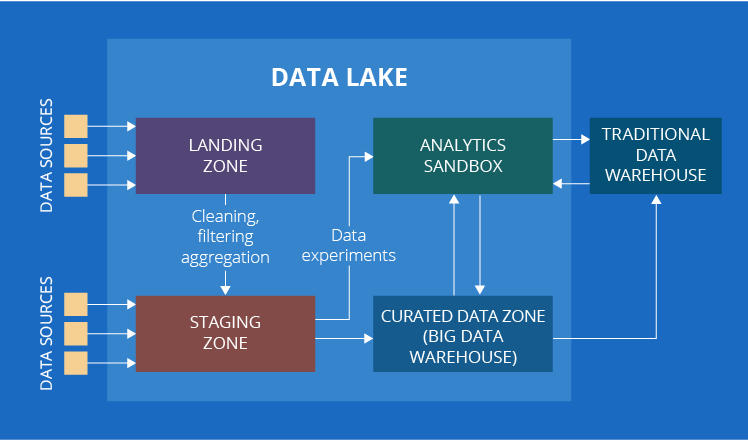
4. And one more zone under question – curated data zone

By now, our list should have been over, if there weren’t one slight hitch. In some sources, you may come upon one more component of a data lake – the curated data zone. This is the zone with organized data ready for data analysis.

There exist different opinions about whether the curated data zone should be considered a part of a data lake or not. While both approaches are reasonable, we think that it should rather not. However, prior to providing the arguments to support our point of view, let’s put the terminology to order.

Have another look at the description of the curated data zone. Doesn’t it look very similar to a good old traditional data warehouse? It absolutely does! The only difference is that a traditional data warehouse deals with traditional data only, while the curated data zone – with both traditional and big data. To neutralize the influence of data types, let’s extend the name to a big data warehouse.

Big data lake implementation

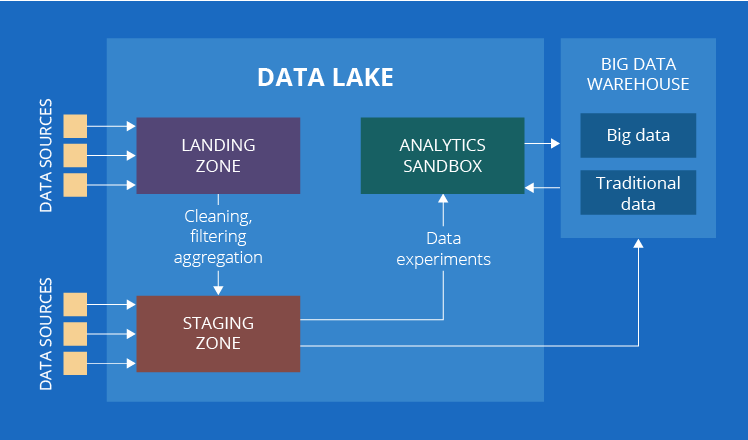
Now, after we clarified that the curated data zone can as well be called a big data warehouse, let’s discuss why we consider that it’s outside a data lake. The data stored in a big data warehouse is fundamentally different from the data in any zone of a data lake – it is more organized, and it is already the source of insights for business users.

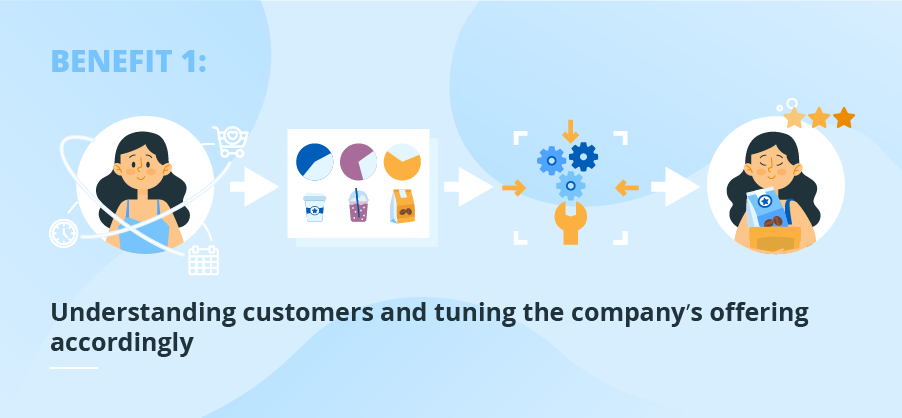
Besides, at this stage of data journey, the differentiation between traditional and big data becomes uncritical. Both types peacefully coexist and complement each other to fulfill its purpose – to provide business users with insights. For example, to segment customers, you can analyze a lot of data among which there will be big data such as surfing history on the website and the activities in customer mobile apps. Later you can run reports on sales or profit per customer segment, which is pure traditional business intelligence.

If you wonder why then a big data warehouse is sometimes considered a part of a data lake, we have an explanation for this as well. Most businesses that decide to take the advantage of big data already have a traditional data warehouse in place. So, they usually choose to extend their analytical solution by building a data lake around it. In this case, a traditional data warehouse remains a habitual important element and all new elements are associated with a data lake.

Big data lake implementation

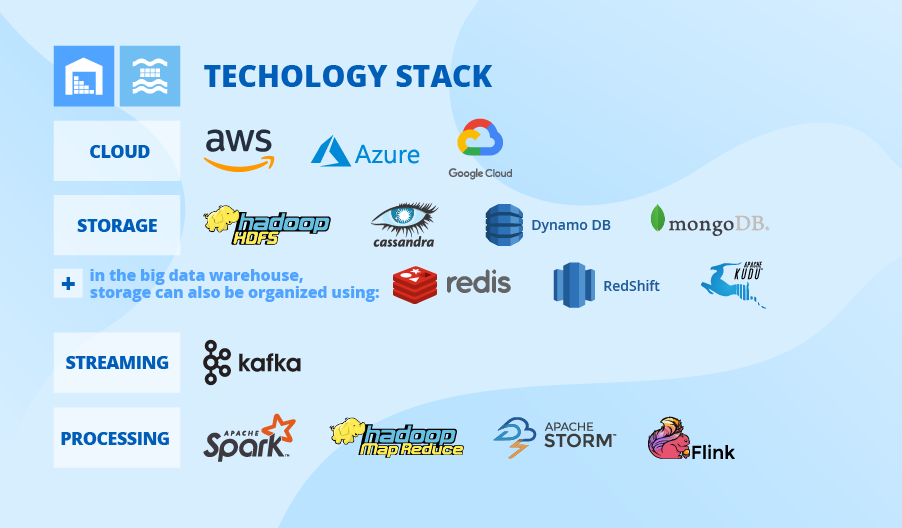
Technological alternatives for implementing a data lake

The list of technologies for big data storage includes a myriad of names: Hadoop Distributed File System, Apache Cassandra, Apache HBase, Amazon S3, MongoDB are just a few most popular ones. Undoubtedly, while selecting a technology stack for a data lake, one will think first of the technologies that enable big data storage. The foundation is the right one, though you need to think about processing as well. So, the list of technologies should be further extended with Apache Storm, Apache Spark, Hadoop MapReduce, etc. No wonder if you are puzzled what combination is the best choice for your data lake!

1. Defining factors to choose a technology stack

Despite each case is individual, we’ve summed up five important factors that will become a starting point of your discussion with your big data consultants:

  • Data to be stored and processed: IoT big data, texts, video, etc.
  • Required architecture of a data lake
  • Scalability
  • In-cloud or on-premises solution
  • Integration with the existing components of IT architecture.

Is there a leading technology?

According to general big data consulting practice, Hadoop Distributed File System (HDFS) is the most popular among the multitude of possible technologies for a big data lake. The reasons are as follows:

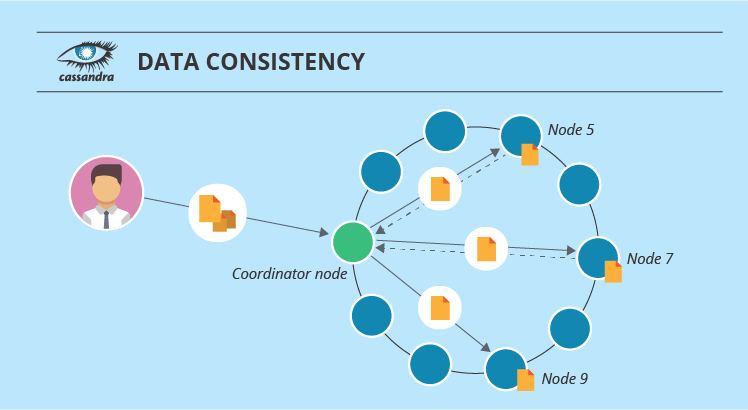
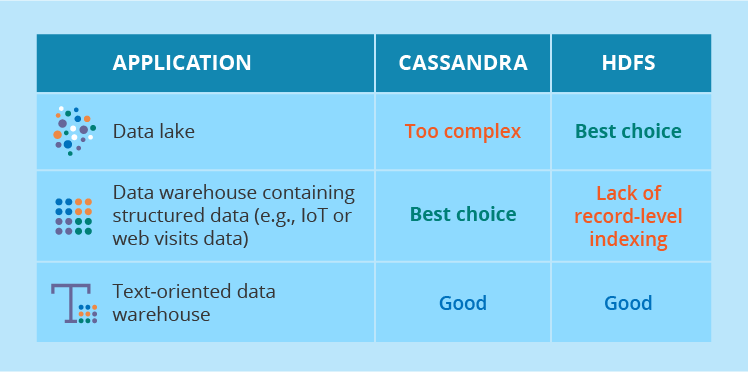
  • HDFS is extremely good at handling the diversity of data in a big data lake. IoT big data, video and audio files and text records – with HDFS you can store every data type. If we compare, Apache Cassandra is good for storing IoT big data, while MongoDB – texts.
  • HDFS supports a wide range of processing techniques. HDFS is one of the elements of Apache Hadoop ecosystem that includes multiple other components such as Hadoop MapReduce, Hadoop YARN, Apache Hive, Apache HBase, etc. As they belong to the same family, it’s natural that each of them is highly compatible with HDFS. Besides, HDFS has proved to be highly compatible with Apache Spark which gives an opportunity to perform big data processing quickly.

Of course, you can also consider other technologies to implement a data lake. An important criterion is to know how to bypass their limitations. For example, after comparing HDFS and Cassandra, you can decide to run a data lake on the latter. Why not, if you are planning a data lake exclusively as a staging area for IoT data, and you know how to compensate Cassandra’s lack of joins?

2. Data lake as a service

Amazon Web Services, Microsoft Azure, Google Cloud Platform have a relevant offer – a data lake as a service. In fact, it would be difficult for a newbie to spot the differences among these three offers. In essence, they are quite similar: you need an AWS/Azure/GCP account, your data and willingness to pay for the service. In return, you get a predefined set of technologies deployed in the cloud and get rid of a maintenance headache. Under-the-hood technology stack is, of course, different, though the functions they perform are habitual ones: storage, processing, streaming and analytics. We are planning to write a separate blog post revealing the pros and cons of these three offers. So, stay tuned.

Let’s briefly recap

What are the main factors that influence the choice of technologies for a data lake?

  • The types of data to be stored and processed
  • The zones of a data lake (only a staging zone or a landing zone and an analytics sandbox)
  • Scalability
  • In-cloud or on-premises solution
  • Integration with the existing components of IT architecture.

In the end, should we opt for one technology only?
No, you shouldn’t. Our practice shows that data lake solutions are implemented based on several technologies. To solve a business task, big data consultants can choose a separate technology for each zone of a data lake.

Is there a preferred technology for a data lake?
Hadoop Distributed File System is the most popular, yet not the only technology available. However, be careful and rely on your business goals and, correspondingly, requirements to your future analytical solution rather than on a framework’s popularity.

If I do not want to implement a data lake from scratch, can I opt for a ready-to-use solution?
Yes, you can. Amazon Web Services, Microsoft Azure and Google Cloud Platform offer a data lake as a service. What is needed from you – your data and your subscription and service fees. And you get a data lake that it easy and fast to deploy.


Big data is another step to your business success. We will help you to adopt an advanced approach to big data to unleash its full potential.

Why You Don’t Have To Choose


Editor’s note: When you implement a big data solution, choosing the right storage is the first order of business. Read on to learn about the big data solution options and don’t hesitate to explore our approach delivering to big data services, if you need to back up your big data project.

When ScienceSoft’s clients need to design their big data solution, we offer them to structure it with two storage elements: a data lake and a big data warehouse, which we distinguish from a traditional enterprise data warehouse. Here, looking ahead, we should say that a big data warehouse, unlike a data lake, is an obligatory element of a full-scale big data analytical solution. But, first things first, let us show you how data lakes and big data warehouses are different from each other in terms of architecture and their functional purpose.

big data warehouse vs data lake

The differences between a data lake and a data warehouse

Data state

ScienceSoft’s big data experts employ data lakes for storing all kinds of data – structured, unstructured and semi-structured. As for a big data warehouse, we use it as a storage for structured data.

The approach to storing data

A big data warehouse stores data according to the schema-on-write approach: before loading into the big data warehouse, data needs to be transformed into a unified structure to be fit for the big data warehouse.

A data lake stores data according to the schema-on-read approach: raw data is loaded into the data lake as it is and applied to the schema only when it is read. Thus, storing data in a data lake requires less effort.

Architecture

When speaking of a data lake, its flexible architecture may involve three elements:

  • A landing zone – a transient area, where data undergoes preliminary filtering.
  • A staging zone – a storage repository.
  • An analytics sandbox – the area where data analysts perform experiments for exploratory data analytics.

When developing a data lake solution, our experts consider the staging zone the only obligatory element. If you want to learn more about the data lake zones and why we consider the landing zone and the analytical sandbox optional, study this article, here our data analytics researcher, Irene Mikhailouskaya, dwells on the data lake architecture.

As concerns the big data warehouse, it has a rigid architecture. Its elements are highly structured and obligatory as they are tied to business processes for the big data warehouse to correctly analyze and report data.

Storage costs

Drawing on our experience in rendering big data services, we have to admit that storing data in a big data warehouse is costly as you cannot load data unless it is of the required structure. And such a preparatory process is rather time- and resource-consuming. Thereby, we usually recommend our clients to consider integrating a data lake into the big data warehouse architecture as a cost-effective alternative: storing data in the data lake involves minimum or no data structuring before being loaded.

Users

Big data warehouses cater to the needs of business users and data analysts who use big data strategically to improve the decision-making process. Data lakes are mainly used as temporary storage of big data and the zone for data scientists and analysts to drive experiments.

Technologies

As both the big data warehouse and the data lake deal with big data, there is no difference in the technology stack to employ for storing, streaming and processing data:

big data technologies
Security

The use of big data is associated with certain security challenges. When developing big data solutions, ScienceSoft’s experts pay special attention to the high granularity of access control, when users’ access is limited depending on their roles. This measure prevents sensitive data leakage.

As opposed to big data warehouses, data lakes lack security focus due to the nature of stored data and its functional purpose. As only a limited number of users are granted the access, a data lake is protected as a whole, following the “all-or-nothing” approach.

Don’t know how your big data solution should look?

ScienceSoft’s team is ready to advise you on how to leverage big data potential with a tailor-made solution.

The synergy of the data lake and the big data warehouse

Many big data project sponsors we talk to wonder if they can use a data lake or a big data warehouse alone in a data analytics solution. Our answer is it’s not an either-or choice: a data lake alone is never enough to design a full-scale big data analytics solution. We often recommend having the synergy of both. This is the case of businesses who need to both store large amounts of raw data to conduct experiments, and deliver intelligence to decision-makers. One of the telling examples when both elements function in sync within the one big data solution is an IoT solution, where the initial sensor data is stored in its raw format in the data lake, and then it undergoes the ETL\ELT process to be stored in the big data warehouse for further analysis. Such an alliance allows leveraging big data potential time- and cost-effectively.

How to start your big data journey?

Now, that you know your options, you need to decide whether your big data solution’s architecture will involve a big data warehouse and a data lake, or just a big data warehouse. To choose which way to go, you need to define:

  • For what purposes your data will be used.
  • What your requirements to data quality, speed of the data flow and the need for analytical experiments are.
  • Who will use the data.

There are many factors to take into account and balance when deciding on the high-level big data architecture. We saw how long-drawn-out architectural decisions delayed actual big data implementation for years. And, unfortunately, we’ve witnessed how a wrong decision may result in massive rework later. ScienceSoft’s big data team would be happy to help with consulting or architecture design.


Big data is another step to your business success. We will help you to adopt an advanced approach to big data to unleash its full potential.

Big Data in Oil & Gas: Adoption, Use Cases, Benefits


Use cases

  • Drilling processes optimization.
  • Predictive and preventive maintenance.
  • Equipment maintenance planning.
  • Remote equipment monitoring and control.
  • Inventory management optimization.

How it works: Sensors installed on the drilling equipment send temperature, pressure, vibration, flow, position, torque, and other readings. Gathered and analyzed by the big data solution, this data powers real-time insights into drilling processes (e.g., drilling direction, drilling fluid composition and pressure, drilling bit position) and intelligent software-to-equipment commands (e.g., adjusting drilling bit position to target specific formations or avoid obstruction).

Big data software also gathers equipment operational data (e.g., the rotation speed of the drilling bit, drilling fluid temperature) and equipment metadata (e.g., model, operational settings). This data is used to build accurate AI/ML models that help generate alerts on abnormal events and identify failure-causing equipment usage patterns. This allows O&G companies to minimize NPT (non-productive time), optimize inventory management processes and equipment maintenance schedules, extend equipment lifespan, and more.

Drilling and equipment data can also be coupled with real-time and historical geological data (e.g., rock formation evaluation, mud properties) to build and adjust drilling models, predict anomalies, and prevent unwanted events like kicks and blowouts.

How BI technology can help


Imagine that in 2017 someone is still actually posting letters because they think email is difficult and costly. Each time they have to bring their letters to a post office, where later a postman collects them to deliver. Delivery then takes at least a few days, while emails could be exchanged instantly. Inefficient and time-consuming, isn’t it? It’s surprising, but this is what some companies do when they overlook software for cash flow analysis and choose to carry on with Excel-based manual data processing.

BI consulting practitioners break the stereotype that only big companies need tech-based cash flow analysis and forecasting. In fact, midsized businesses need them too to keep track of their cash, and do it efficiently. Long gone the time when companies had no other alternatives than to go through the effort of using several Excel files, matching and filtering them manually to get a comprehensive picture. Now, the technology is convenient and affordable.

Cash flow analysis: How BI technology can help

What can be analyzed?

A cash flow analysis answers a range of questions. For example, a real estate developer can check if there is enough cash to invest in a new project; a manufacturer whether external funding is needed to revamp the plant machinery; a retailer how much money is buried in stock; a bank if the cash flow is adequate to meet the liquidity coverage ratio.

These are just practicalities. The main question is whether a cash flow is sustainable.

To enable a comprehensive cash flow analysis and forecasting, a company can aggregate data from numerous sources:

  • Cash flow history
  • Planned and actual operating expenses and capital expenditures
  • Accounts receivables/payable balances
  • General ledger data

Besides, all the figures can be taken directly from the ERP modules (finance, accounting, sales, human resources, etc.). This means that all the values are kept up-to-date and can automatically turn from forecasted to actual, whenever confirmed.

The challenges solved with technology

Cash flow planning and forecasting

Cash flow analysis software will equip managers with timely, accurate and easy-to-use reports and charts giving an overview by geography, branches, bank account, etc. Cash forecasts can be generated automatically as frequent as necessary (daily, weekly, quarterly or monthly), as well as on demand. With such forecasts, financial managers will get an advance warning of cash shortage or surplus and will have time to take some actions (for instance, invest in company’s growth if there is free cash).

Project-level view

Big projects, both internal and for customers beyond the organization, may influence cash flow dramatically. Financial managers cannot treat big projects as black boxes, they need to look inside. For any project, it is necessary to know its duration, cost of each stage, terms of payment (prepayment or payment determent; a lump sum or by installments). Data analysis contributes to both an accurate cash plan and successful project implementation.

Risk management

With cash flow analysis software, a company has a reliable tool to manage risks. For example, a manufacturing company operates at a profit (its P&L says so) and wants to increase its production volume. However, the company’s cash flow forecast shows that there is not enough cash. Additionally, the software makes a quick projection with increased cost of goods produced, which shows that the company will only be losing money in a long-term perspective. A quick liquidity analysis helps to make the right decision.

A point of truth from different angles – instantly

Another advantage of a tech-based cash flow analysis is that the data from different sources is aggregated at the data warehouse level. For end users, this means fast response and a quick glance from different perspectives, as the system already has an answer to any question and just waits for a query. For example, financial managers can switch between the cash flow from operations to the cash flow from investing and then to the cash flow from financing all in a few clicks.

To sum up

Cash flow management is crucial to ensure that a business is healthy. A company that leaves its cash flow uncontrolled, risks to end up with insolvency and to ruin its reputation. Business intelligence services is there to help companies adopt the cash flow analysis technology that brings value, eliminates a big chunk of manual work, accelerates decision-making and solves such challenges as cash flow planning and forecasting, project-level view, risk management, and analysis from different perspectives in a few clicks.


Empower your business by replacing guesswork with informed decision-making. We’ll guide you through this challenging but value-bringing process.

The Most Comprehensive Overview You’ll Ever See


Apache Cassandra obviously can’t tell the future. It can only enable you to organize data storage (or at least make it as organized as it can get in a distributed system). But how good is Cassandra at it? Find all the needed details below so that Cassandra performance is not all Greek to you anymore.

Cassandra performance

Terms you may not know yet

Down below, our Cassandra specialists use quite a lot of specific terms that you may encounter for the first time. Here, you may find all these terms briefly explained.

Token is a somewhat abstract number assigned to every node of the cluster in an ascending manner. All the nodes form a token ring.

Partitioner is the algorithm that decides what nodes in the cluster are going to store data.

Replication factor determines the number of data replicas.

Keyspace is the global storage space that contains all column families of one application.

Column family is a set of Cassandra’s minimal units of data storage (columns). Columns consist of a column name (key), a value and a timestamp.

Memtable is a cache memory structure.

SSTable is an unchangeable data structure created as soon as a memtable is flushed onto a disk.

Primary index is a part of the SSTable that has a set of this table’s row keys and points to the keys’ location in the given SSTable.

Primary key in Cassandra consists of a partition key and a number of clustering columns (if any). The partition key helps to understand what node stores the data, while the clustering columns organize data in the table in ascending alphabetical order (usually).

Bloom filters are data structures used to quickly find which SSTables are likely to have the needed data.

Secondary index can locate data within a single node by its non-primary-key columns. SASI (SSTable Attached Secondary Index) is an improved version of a secondary index ‘affixed’ to SSTables.

Materialized view is a means of ‘cluster-wide’ indexing that creates another variant of the base table but includes the queried columns into the partition key (while with a secondary index, they are left out of it). This way, it’s possible to search for indexed data across the whole cluster without looking into every node.

Data modeling in Cassandra

Cassandra’s performance is highly dependent on the way the data model is designed. So, before you dive into it, make sure that you understand Cassandra’s three data modeling ‘dogmas’:

  1. Disk space is cheap.
  2. Writes are cheap.
  3. Network communication is expensive.

These three statements reveal the true sense behind all Cassandra’s peculiarities described in the article.

And as to the most important rules to follow while designing a Cassandra data model, here they are:

  • Do spread data evenly in the cluster, which means having a good primary key.
  • Do reduce the number of partition reads, which means first thinking about the future queries’ composition before modeling the data.

Data partitioning and denormalization

To assess Cassandra performance, it’s logical to start in the beginning of data’s path and first look at its efficiency while distributing and duplicating data.

Cassandra partitioning

Partitioning and denormalization: The process

While distributing data, Cassandra uses consistent hashing and practices data replication and partitioning. Imagine that we have a cluster of 10 nodes with tokens 10, 20, 30, 40, etc. A partitioner converts the data’s primary key into a certain hash value (say, 15) and then looks at the token ring. The first node whose token is bigger than the hash value is the first choice to store the data. And if we have the replication factor of 3 (usually it is 3, but it’s tunable for each keyspace), the next two tokens’ nodes (or the ones that are physically closer to the first node) also store the data. This is how we get data replicas on three separate nodes nice and easy. But besides that, Cassandra also practices denormalization and encourages data duplication: creating numerous versions of one and the same table optimized for different read requests. Imagine how much data it is, if we have the same huge denormalized table with repeating data on 3 nodes and each of the nodes also has at least 3 versions of this table.

Partitioning and denormalization: The downside

The fact that data is denormalized in Cassandra may seem weird, if you come from a relational-database background. When any non-big-data system scales up, you need to do things like read replication, sharding and index optimization. But at some point, your system becomes almost inoperable, and you realize that the amazing relational model with all its joins and normalization is the exact reason for performance issues.

To solve this, Cassandra has denormalization as well as creates several versions of one table optimized for different reads. But this ‘aid’ does not come without consequence. When you decide to increase your read performance by creating data replicas and duplicated table versions, write performance suffers a bit because you can’t just write once anymore. You need to write the same thing n times. Besides, you need a good mechanism of choosing which node to write to, which Cassandra provides, so no blames here. And although these losses to the write performance in Cassandra are scanty and often neglected, you still need the resources for multiple writes.

Partitioning and denormalization: The upside

Consistent hashing is very efficient for data partitioning. Why? Because the token ring covers the whole array of possible keys and the data is distributed evenly among them with each of the nodes getting loaded roughly the same. But the most pleasant thing about it is that your cluster’s performance is almost linearly scalable. It sounds too good to be true, but it is in fact so. If you double the number of nodes, the distance between their tokens will decrease by half and, consequently, the system will be able to handle almost twice as many reads and writes. The extra bonus here: with doubled nodes, your system becomes even more fault-tolerant.

The write

Cassandra write

Write: The process

After being directed to a specific node, a write request first gets to the commit log (it stores all the info about in-cache writes). At the same time, the data gets stored in the memtable. At some point (for instance, when the memtable is full), Cassandra flushes the data from cache onto the disk – into SSTables. At the same moment, the commit log purges all its data, since it no longer has to watch out for the corresponding data in cache. After a node writes the data, it notifies the coordinator node about the successfully completed operation. And the number of such success notifications depends on the data consistency level for writes set by your Cassandra specialists.

Such a process happens on all nodes that get to write a partition. But what if one of them is down? There’s an elegant solution for it – hinted handoff. When the coordinator sees that a replica node is not responding, it stores the missed write. Then, Cassandra temporarily creates in the local keyspace a hint that will later remind the ‘derailed’ node to write certain data after it goes back up. If the node doesn’t recover within 3 hours, the coordinator stores the write permanently.

Write: The downside

Still, the write is not perfect. Here’re some upsetting things:

  • Append operations work just fine, while updates are conceptually missing in Cassandra (although it’s not entirely right to say so, since such a command exists). When you need to update a certain value, you just add an entry with the same primary key but a new value and a younger timestamp. Just imagine how many updates you may need and how much space that will take up. Moreover, it can affect read performance, since Cassandra will need to look through lots of data on a single key and check whichever the newest one is. However, once in a while, compaction is enacted to merge such data and free up space.
  • The hinted handoff process can overload the coordinator node. If this happens, the coordinator will refuse writes, which can result in the loss of some data replicas.

Write: The upside

Cassandra’s write performance is still pretty good, though. Here’s why:

  • Cassandra avoids random data input having a clear scenario for how things go, which contributes to the write performance.
  • To make sure that all the chosen nodes do write the data, even if some of them are down, there’s the above-mentioned hinted handoff process. However, you should note that hinted handoff only works when your consistency level is met.
  • The design of the write operation involves the commit log, which is nice. Why? If a node goes down, replaying the commit log after it’s up again will restore all the lost in-cache writes to the memtable.

The read

Cassandra read

Read: The process

When a read request starts its journey, the data’s partition key is used to find what nodes have the data. After that, the request is sent to a number of nodes set by the tunable consistency level for reads. Then, on each node, in a certain order, Cassandra checks different places that can have the data. The first one is the memtable. If the data is not there, it checks the row key cache (if enabled), then the bloom filter and then the partition key cache (also if enabled). If the partition key cache has the needed partition key, Cassandra goes straight to the compression offsets, and after that it finally fetches the needed data out of a certain SSTable. If the partition key wasn’t found in partition key cache, Cassandra checks the partition summary and then the primary index before going to the compression offsets and extracting the data from the SSTable.

After the data with the latest timestamp is located, it is fetched to the coordinator. Here, another stage of the read occurs. As we’ve stated here, Cassandra has issues with data consistency. The thing is that you write many data replicas, and you may read their old versions instead of the newer ones. But Cassandra doesn’t ignore these consistency-related problems: it tries to solve them with a read repair process. The nodes that are involved in the read return results. Then, Cassandra compares these results based on the “last write wins” policy. Hence, the new data version is the main candidate to be returned to the user, while the older versions are rewritten to their nodes. But that’s not all. In the background, Cassandra checks the rest of the nodes that have the requested data (because the replication factor is often bigger than consistency level). When these nodes return results, the DB also compares them and the older ones get rewritten. Only after this, the user actually gets the result.

Read: The downside

Cassandra read performance does enjoy a lot of glory, but it’s still not entirely flawless.

  • All is fine as long as you only query your data by the partition key. If you want to do it by an out-of-the-partition-key column (use a secondary index or a SASI), things can go downhill. The problem is that secondary indexes and SASIs don’t contain the partition key, which means there’s no way to know what node stores the indexed data. It leads to searching for the data on all nodes in the cluster, which is neither cheap nor quick.
  • Both the secondary index and the SASI aren’t good for high cardinality columns (as well as for counter and static columns). Using these indexes on the ‘rare’ data can significantly decrease read performance.
  • Bloom filters are based on probabilistic algorithms and are meant to bring up results very fast. This often leads to false positives, which is another way to waste time and resources while searching in the wrong places.
  • Apart from the read, secondary indexes, SASIs and materialized views can adversely affect the write. In case with SASI and secondary index, every time data is written to the table with an indexed column, the column families that contain indexes and their values will have to be updated. And in case with materialized views, if anything new is written to the base table, the materialized view itself will have to be changed.
  • If you need to read a table with thousands of columns, you may have problems. Cassandra has limitations when it comes to the partition size and number of values: 100 MB and 2 billion respectively. So if your table contains too many columns, values or is too big in size, you won’t be able to read it quickly. Or even won’t be able to read it at all. And this is something to keep in mind. If the task doesn’t strictly require reading this number of columns, it’s always better to split such tables into multiple pieces. Besides, you should remember that the more columns the table has, the more RAM you’ll need to read it.

Read: The upside

Fear not, there are strong sides to the read performance as well.

  • Cassandra provides excitingly steady data availability. It doesn’t have a single point of failure, plus, it has data stored on numerous nodes and in numerous places. So, if multiple nodes are down (up to half the cluster), you will read your data anyway (provided that your replication factor is tuned accordingly).
  • The consistency problems can be solved in Cassandra through the clever and fast read repair process. It is quite efficient and very helpful, but still we can’t say it works perfectly all the time.
  • You may think that the read process is too long and that it checks too many places, which is inefficient when it comes to querying frequently accessed data. But Cassandra has an additional shortened read process for the often-needed data. For such cases, the data itself can be stored in a row cache. Or its ‘address’ can be in the key cache, which facilitates the process a lot.
  • Secondary indexes can still be useful, if we’re speaking about analytical queries, when you need to access all or almost all nodes anyway.
  • SASIs can be an extremely good tool for conducting full text searches.
  • The mere existence of materialized views can be seen as an advantage, since they allow you to easily find needed indexed columns in the cluster. Although creating additional variants of tables will take up space.

Cassandra performance: Conclusion

Summarizing Cassandra performance, let’s look at its main upside and downside points. Upside: Cassandra distributes data efficiently, allows almost linear scalability, writes data fast and provides almost constant data availability. Downside: data consistency issues aren’t a rarity and indexing is far from perfect.

Obviously, nobody’s without sin, and Cassandra is not an exception. Some issues can indeed influence write or read performance greatly. So, you will need to think about Cassandra performance tuning if you encounter write or read inefficiencies, and that can involve anything from slightly tweaking your replication factors or consistency levels to an entire data model redesign. But this in no way means that Cassandra is a low-performance product. If compared with MongoDB and HBase on its performance under mixed operational and analytical workload, Cassandra – with all its stumbling blocks – is by far the best out of the three (which only proves that the NoSQL world is a really long way from perfect). However, Cassandra’s high performance depends a lot on the expertise of the staff that deals with your Cassandra clusters. So, if you choose Cassandra, nice job! Now, choose the right people to work with it.


Cassandra Consulting and Support

Feel helpless being left alone with your Cassandra issues? Hit the button, and we’ll give you all the help you need to handle Cassandra troubles.

5 Main Benefits of Business Intelligence Shown on a Real-Life Example


So why is business intelligence important? Business analysts often say that the main advantage of a BI solution is “eliminating guesswork from your business processes”. This becomes possible because business intelligence is used to analyze data and present actionable insights to stimulate informed decision making within an enterprise.

We employ our experience in BI implementation services to explain what advantages a company can get leveraging business intelligence. To add practicality, we’ll show how these major benefits of business intelligence are rocked by Starbucks, an early BI adopter and savvy user of data-driven business analytics.

Benefit 1. Understanding customers and tuning the company’s offering accordingly

understanding customers with bi

BI tools enable companies to process customer data from multiple sources and create a 360-degree customer profile. As one of the goals of business intelligence is to present business-critical data in an easy-to-understand manner, companies can clearly understand their customers’ needs and behavior. As a result, they are empowered to tune their offering accordingly and deliver top-notch products and services.

Launching new product lines

Starbucks used BI to analyze industry reports about at-home beverage consumption and data about how customers order products while in a Starbucks shop. The company employed this info to create K-Cups and bottled beverages to sell in grocery stores. This let the company prevent customers from using other coffee brands at home.

Defining store locations

Since 2008, Starbucks has used Atlas, BI mapping software, to locate their new stores. The platform allows the company to estimate the economic viability of a new store location by evaluating massive amounts of data, such as area population density, average income of the residents, traffic patterns and proximity to other Starbucks locations. Thus, the company opens stores exactly where customers need them, which boosts sales without hurting the business in other locations.

Benefit 2. Boosting sales and marketing activities

boosting sales with bi

With BI solutions, companies take a closer look at multidimensional retail data (from transactions to social media) to forecast customer needs and define sales and marketing activities to meet the demand.

Anticipating customer demand

Using predictive analytics, Starbucks successfully beefs up sales with analytics-powered in-store digital boards. The boards display items based on time of the day, weather, social trends and more: for example, breakfast items in the morning, hot drinks in colder weather, holiday specialties, dairy-free alternatives, etc. Such a data-driven approach allows Starbucks to entice customers with a more appealing offering.

Customizing order suggestions

Starbucks’ mobile app with more than 16 million active users presents the wealth of data on customers’ purchasing habits. To make use of that data correctly, the company uses a reinforcement learning platform to offer customers tailor-made order suggestions based on their popular selections, order history and the inventory of a local store. Through providing such personalized experience for customers, the company boosts both customer loyalty and sales.

Watch BI in action!

ScienceSoft shows how a couple of customized dashboards can tell you the whole story about your company’s health and performance.

Benefit 3. Optimizing back-end operations

optimizing operations with bi

A BI solution can analyze data to advance a company’s internal business processes, such as order management, scheduling, staffing, inventory management, and supply chain management.

Staffing and staff scheduling in a smart way

Due to staff scheduling optimization, it takes about three minutes from the time when a Starbucks customer gets in line until the order is delivered – regardless of the part of the day they come in. BI tools help store managers constantly monitor store performance against labor efforts to identify how well the store is doing with the current staff. With these tools, managers can optimize the work by growing or downsizing staff and rescheduling some duties (cleaning work areas, coffee machines, etc.) to perform them in quiet periods or after hours. That way, baristas are not overloaded and have the time for small talk with a customer or, for example, drawing a balloon on a cup for a birthday person. Such personalized approach increases customer satisfaction, which lies in the heart of the company’s customer-centric policy.

Optimizing supply chain management

Starbucks’ supply chain has no room for waste and inefficiency due to the centralized BI practice. BI software enables on-demand access to constantly updated information on stock inventory, transport scheduling and storage capacity. Based on real-time reports, the company manages to react with agility to, for example, poor quality of raw products by finding alternative suppliers while maintaining competitive prices.

Benefit 4. Keeping a close eye on the competition

benchmarking with bi

As a part of a BI solution, benchmarking delivers practical insights on how to outperform competitors. Competitive analysis allows continuously improving a company’s performance.

Finding new ways of service delivery

Competitive benchmarking empowered Starbucks to uncover the need to reconfigure their third place strategy, which presupposed stores that provide both take-away and eat-in options. Following in the footsteps of McDonald’s, Luckin Coffee and other competitors, Starbucks launched food delivery service and opened pick-up only stores. The company’s efforts seem to be working: they managed to reach customers beyond those who already include Starbucks as part of their morning or afternoon routine.

And this all leads to – Benefit 5. Revenue increase and cost reduction

increase revenue with bi

Businesses effectively employing BI software earn more by analyzing customers and their demands, boosting marketing and sales activities, optimizing business-supporting operations and benchmarking.

As for Starbucks, successfully employed BI and data analytics practices empower them not only to attract customers, consequently boosting the volume of sales, but also to follow the ever-changing consumers’ behavior to the extent that few companies have yet been able to accomplish.

How to gain from BI?

ScienceSoft can help you leverage the BI benefits that Starbucks and many other companies already enjoy. Turn to our BI consultants as a first step to introducing a BI solution to your business.

Start your BI implementation journey


BI expertise since 2005. Full-cycle services to deliver powerful BI solutions with rich analysis options. Iterative development to bring quick wins.

Real-Time Big Data Analytics: A Comprehensive Guide


While real-time analytics and big data are both trending, it seems that real-time big data analytics, which is their combination, should be a very promising initiative, and many businesses should be desirous of it. Let’s find out if this is really so.

You will find this article richly supplied with the examples of real-time customer big data analytics. We’ve done so for the reasons of ease and consistency. Though there are more areas where real-time data analytics can be applied.

Real-time big data analytics

Let’s start from defining the term

If you are going to skip this section because you think there can’t be two definitions of real-time, please don’t be surprised – there are. In fact, the definition of real-time is extremely vague, and it differs a lot from company to company or, to be more exact, from business task to business task.

Our big data consulting team has come up with the following definition:

Real-time big data analytics means that big data is processed as it arrives and either a business user gets consumable insights without exceeding a time period allocated for decision-making or an analytical system triggers an action or a notification.

As real-time is often confused with instantaneous, let’s clarify the time frames for data input and response. As far as data input is concerned, the real-time processing engine can be designed to either push or pull data. The most widespread example is a push option with an incessantly flowing high-volume data (also known as streaming). However, the real-time processing engine is not always capable of ingesting streaming data. Alternatively, it can be designed to pull data by asking if any new data has arrived. The time between such queries depends on business needs and can vary from milliseconds to hours.

Correspondingly, the response time also varies. For instance, a self-driving car requires a very fast response time – just several milliseconds. If we deal with sensors installed, say, on a wind turbine, and they communicate a slowly growing gearbox oil temperature, which is still below the critical level but higher than normal, we need one-minute response time to change blade pitch, thus offloading the turbine and preventing machine breakdown or even fire. However, a bank’s analytical system would allow several minutes to assess the creditworthiness of an applicant; and a retailer’s dynamic pricing can take up to an hour to update. Still, all these examples are considered real-time.

Real-time big data analytics as a competitive advantage

Although in general organizations value managing data in real time, not all the companies go for real-time big data analytics. The reasons could be different: the lack of expertise or insufficient funds, the fear of the associated challenges or overall management team’s reluctance. However, those companies who implement real-time analytics can gain a competitive advantage.

Real-time big data analytics as a competitive advantage: use case

Let’s say you are a fashion retailer who would like to take the advantage by delivering a top-notch customer service. Analyzing big data in real time can help bring this great initiative into life. For example, once a customer is passing by a retailer’s store, they get a push notification on their smartphones that serves to incentivize them to enter. Usually, it’s a personalized promo offer that is based on the customer’s purchasing or even surfing history on the website. Once a customer is in the store, the staff gets a notification in their mobile apps. This makes them aware of the customer’s latest purchases, overall style preferences, interest in promotions, a typical spend, etc. It looks like a win-win situation for both customers and retailers, doesn’t it?

An ecommerce retailer can also achieve better performance by analyzing big data in real time. For instance, they can reduce the number of abandoned carts.  Say, a customer has gone that far, but for some reason, they’ve decided not to finalize their purchase. Still, there are good chances to incentivize them to change their mind. The system is turning to the customer’s profile data, as well as the purchasing and surfing history to compare the customer’s behavior with the conduct of other customers from the same segment and their response to different actions in a similar situation. Based on the analysis results, the system chooses the most suitable of all the possible actions – for example, offers a discount.

A typical architecture for real-time big data analytics

Let’s have a look at how a typical real-time big data analytics solution works. To make the explanation more vivid, we will accompany it with an example that is illustrative for everybody, as, now and again, we all assume the role of a customer.

Real-time big data analytics architecture

Imagine a retailer that is aiming to deliver a personalized customer experience. The first step on this long road is to recognize a customer, once they are in the store. A retailer can achieve this in multiple ways, for example, by implementing face recognition.

With this only data source, the retailer can do a simple analysis, like calculate how many male and female customers are currently in the store. However, the retailer will not satisfy themselves with one data source only. Even to know how many of the customers have come for the first time and how many are regulars, another data source is needed, for example, CRM. The general context will also be helpful, for instance, the information about the store’s opening hours.

After processing, real-time data finds its way to a real-time dashboard or turns into either a notification or a system’s action. We’ve already provided the example for the first case, when the retailer can understand how many customers are in the store at the moment. Let’s look at another option in detail. Say, a customer has formed a shopping list in the mobile app and is moving around the store. Based on the customer’s current location data (gathered by beacons and processed by the same real-time analytics), the app can prompt the most optimal way along the sales floor so that they can grab everything that is on their list.

Let’s continue with the above mentioned example to explain the contribution of machine learning. By the way, machine learning itself does not happen in real time. It’s an elaborate process, and the system requires significant time to analyze an enormous volume of data, which usually covers the period of 1+ year, from different angles to come up with valuable models and patterns. These models help the system to make real-time decisions. Now, to the example: the system has already analyzed customer profiles and segments they belong to, their behavior model, the purchasing history, the response to marketing campaigns, etc. and built a model that enables personalized recommendations. And while the customer is walking in the aisles, the system can notify them about promo offers or related products that the customer will find interesting.

The concept of machine learning also requires model verification applications, as they enable a constant improvement of the models’ accuracy. Additionally, they improve the quality of the input data by allowing a basic filtering from erroneous or noisy data.

Now let’s turn our eyes to data storage. It consists of two components: a data lake and a data warehouse. The former is the place to store all the raw data or the data that has undergone a very simple processing. A data warehouse allows making big data 2-10 times smaller by extracting, transforming and loading only some data from the data lake.

In a word, a retailer cannot live by real-time analytics alone. You can see some other important components of the scheme that fall out of real-time. Still, they are critical if the retailer wants to get valuable and deep insights. For example, a data analytics module, which we haven’t mentioned yet, is responsible for running complex analysis by applying elaborate algorithms and statistical models driven by data analysts. Indeed, this process can take hours or more, but the results are worth waiting. Correspondingly, the retailer’s analytical dashboards will always contain not only real-time but also historical data.

To sum it up

If thoroughly planned and properly implemented, real-time big data analytics definitely can become a competitive advantage. Taking into account how different the interpretations of real-time can be, it’s important to have a clear understanding of the company’s requirements to the analytical system.

In the article, we’ve described a typical architecture for real-time data analytics solution. Before taking it as an example, check whether it will cover your short-term and long-term business needs. If for some reasons, it does not, you may always turn for professional advice on how to tailor it.


Big data is another step to your business success. We will help you to adopt an advanced approach to big data to unleash its full potential.

Which big data framework to choose


With multiple big data frameworks available on the market, choosing the right one is a challenge. A classic approach of comparing the pros and cons of each platform is unlikely to help, as businesses should consider each framework from the perspective of their particular needs. Facing multiple Hadoop MapReduce vs. Apache Spark requests, our big data consulting practitioners compare two leading frameworks to answer a burning question: which option to choose – Hadoop MapReduce or Spark. 

Spark vs. Hadoop MapReduce: Which big data framework to choose

A quick glance at the market situation

Both Hadoop and Spark are open source projects by Apache Software Foundation and both are the flagship products in big data analytics. Hadoop has been leading the big data market for more than 5 years. According to our recent market research, Hadoop’s installed base amounts to 50,000+ customers, while Spark boasts 10,000+ installations only. However, Spark’s popularity skyrocketed in 2013 to overcome Hadoop in only a year. A new installation growth rate (2016/2017) shows that the trend is still ongoing. Spark is outperforming Hadoop with 47% vs. 14% correspondingly.

To make the comparison fair, we will contrast Spark with Hadoop MapReduce, as both are responsible for data processing.

The key difference between Hadoop MapReduce and Spark

In fact, the key difference between Hadoop MapReduce and Spark lies in the approach to processing: Spark can do it in-memory, while Hadoop MapReduce has to read from and write to a disk. As a result, the speed of processing differs significantly – Spark may be up to 100 times faster. However, the volume of data processed also differs: Hadoop MapReduce is able to work with far larger data sets than Spark.

Now, let’s take a closer look at the tasks each framework is good for.

Tasks Hadoop MapReduce is good for:

  • Linear processing of huge data sets. Hadoop MapReduce allows parallel processing of huge amounts of data. It breaks a large chunk into smaller ones to be processed separately on different data nodes and automatically gathers the results across the multiple nodes to return a single result. In case the resulting dataset is larger than available RAM, Hadoop MapReduce may outperform Spark.
  • Economical solution, if no immediate results are expected. Our Hadoop team considers MapReduce a good solution if the speed of processing is not critical. For instance, if data processing can be done during night hours, it makes sense to consider using Hadoop MapReduce.


Tasks Spark is good for:

  • Fast data processing. In-memory processing makes Spark faster than Hadoop MapReduce – up to 100 times for data in RAM and up to 10 times for data in storage.
  • Iterative processing. If the task is to process data again and again – Spark defeats Hadoop MapReduce. Spark’s Resilient Distributed Datasets (RDDs) enable multiple map operations in memory, while Hadoop MapReduce has to write interim results to a disk.
  • Near real-time processingIf a business needs immediate insights, then they should opt for Spark and its in-memory processing.
  • Graph processing. Spark’s computational model is good for iterative computations that are typical in graph processing. And Apache Spark has GraphX – an API for graph computation.
  • Machine learning. Spark has MLlib – a built-in machine learning library, while Hadoop needs a third-party to provide it. MLlib has out-of-the-box algorithms that also run in memory. But if required, our Spark specialists will tune and adjust them to tailor to your needs.
  • Joining datasets. Due to its speed, Spark can create all combinations faster, though Hadoop may be better if joining of very large data sets that requires a lot of shuffling and sorting is needed.


Interested how Spark is used in practice? Check how we implemented a big data solution for IoT pet trackers.

View the project

Examples of practical applications

We analyzed several examples of practical applications and made a conclusion that Spark is likely to outperform MapReduce in all applications below, thanks to fast or even near real-time processing. Let’s look at the examples.

  • Customer segmentation. Analyzing customer behavior and identifying segments of customers that demonstrate similar behavior patterns will help businesses to understand customer preferences and create a unique customer experience.
  • Risk management. Forecasting different possible scenarios can help managers to make right decisions by choosing non-risky options.
  • Real-time fraud detection. After the system is trained on historical data with the help of machine-learning algorithms, it can use these findings to identify or predict an anomaly in real time that may signal of a possible fraud.
  • Industrial big data analysis. It’s also about detecting and predicting anomalies, but in this case, these anomalies are related to machinery breakdowns. A properly configured system collects the data from sensors to detect pre-failure conditions.

Which framework to choose?

It’s your particular business needs that should determine the choice of a framework. Linear processing of huge datasets is the advantage of Hadoop MapReduce, while Spark delivers fast performance, iterative processing, real-time analytics, graph processing, machine learning and more. In many cases Spark may outperform Hadoop MapReduce. The great news is the Spark is fully compatible with the Hadoop eco-system and works smoothly with Hadoop Distributed File System, Apache Hive, etc.


Need professional advice on big data and dedicated technologies? Get it from ScienceSoft, big data expertise since 2013. 

Apache Cassandra vs. Hadoop Distributed File System: When Each is Better


Apache Cassandra and Apache Hadoop are members of the same Apache Software Foundation family. We could have contrasted these two frameworks, but that comparison would not be fair because Apache Hadoop is the ecosystem that encompasses several components. As Cassandra is responsible for big data storage, we have chosen its equivalent from the Hadoop’s ecosystem, which is Hadoop Distributed File System (HDFS). Here, we’ll try to find out if Cassandra and HDFS are like twins who are identical in appearance and just bear different names, or they are rather a brother and a sister who may look similar, but still are very different.

Cassandra vs HDFS

Master/slave vs. masterless architecture

Before we dwell on the features that distinguish HDFS and Cassandra, we should understand the peculiarities of their architectures, as they are the reason for many differences in functionality. If you look at the picture below, you’ll see two contrasting concepts. HDFS’s architecture is hierarchical. It contains a master node, as well as numerous slave nodes. On the contrary, Cassandra’s architecture consists of multiple peer-to-peer nodes and resembles a ring.

Cassandra vs. Hadoop architecture

5 Key functional differences

1. Dealing with massive data sets

Both HDFS and Cassandra are designed to store and process massive data sets. However, you would need to make a choice between these two, depending on the data sets you have to deal with. HDFS is a perfect choice for writing large files to it. HDFS is designed to take one big file, split it into multiple smaller files and distribute them across the nodes. In fact, if you need to read some files from HDFS, the operation is reverse: HDFS has to collect multiple files from different nodes and deliver some result that corresponds to your query. By contrast, Cassandra is the perfect choice for writing and reading multiple small records. Its masterless architecture enables fast writes and reads from any node. This makes IT solution architects opt for Cassandra if it is required to work with time series data, which is usually the basis for the Internet of Things.

While in theory HDFS and Cassandra look mutually exclusive, in real life they may coexist. If we continue with the IoT big data, we can come up with a scenario where HDFS is used for a data lake. In this case, new readings will be added to Hadoop files (say, there will be a separate file per each sensor). At the same time, a data warehouse may be built on Cassandra.

2. Resisting to failures

Both HDFS and Cassandra are considered reliable and failure resistant. To ensure this, both apply replication. Simply put, when you need to store a data set, HDFS and Cassandra distribute it to some node and create the copies of the data set to store on several other nodes. So, the principle of failure resistance is simple: if some node fails, the data sets that it contained are not irretrievably lost – their copies are still available on other nodes. For example, by default, HDFS will create three copies, though you are free to set any other number of replicas. Just don’t forget that more copies mean more storage space and longer time to perform the operation. Cassandra also allows choosing the required replication parameters.

However, with its masterless architecture, Cassandra is more reliable. If HDFS’s master node and secondary node fail, all the data sets will be lost without the possibility of recovery. Of course, the case is not frequent, but still this can happen.

3. Ensuring data consistency

Data consistency level determines how many nodes should confirm that they have stored a replica so that the whole write operation is considered a success. In case of read operations, data consistency level determines how many nodes should respond before the data is returned to a user.

In terms of data consistency, HDFS and Cassandra behave quite differently. Let’s say, you ask HDFS to write a file and create two replicas. In this case, the system will refer to Node 5 first, then Node 5 will ask Node 12 to store a replica and finally Node 12 will ask Node 20 to do the same. Only after that, the write operation is acknowledged.

Data consistency scheme for HDFS

Cassandra does not use HDFS’s sequential approach, so there is no queue. Besides, Cassandra allows you to declare the number of nodes you want to confirm the success of operation (it can range from any node to all nodes responding). One more advantage of Cassandra is that it allows varying data consistency levels for each write and read operation. By the way, if a read operation reveals inconsistency among replicas, Cassandra initiates a read repair to update the inconsistent data.

Data consistency scheme for Cassandra

4. Indexing

As both systems work with enormous data volumes, scanning only a certain part of big data instead of a full scan would increase the system’s speed. Indexing is exactly the feature that allows doing that.

Both Cassandra and HDFS support indexing, but in different ways. While Cassandra has many special techniques to retrieve data faster and even allows creating multiple indexes, HDFS’s capabilities go only to a certain level – to the files the initial data set was split into. However, record-level indexing can be achieved with Apache Hive.

5. Delivering analytics

Both designed for big data storage, Cassandra and HDFS still have to do with analytics. Not by themselves, but in combination with specialized big data processing frameworks such as Hadoop MapReduce or Apache Spark.

Apache Hadoop’s ecosystem already includes MapReduce and Apache Hive (a query engine) along with HDFS. As we described above, Apache Hive helps overcome the lack of record-level indexing, which enables to speed up an intensive analysis where the access to records is required. However, if you need Apache Spark’s functionality, you can opt for this framework, as it is also compatible with HDFS.

Cassandra also runs smoothly together with either Hadoop MapReduce or Apache Spark that can run on top of this data storage.

HDFS and Cassandra in the framework of CAP theorem

According to the CAP theorem, a distributed data store can only support two of the following three features:  

  • Consistency: a guarantee that the data is always up-to-date and synchronized, which means that at any given moment any user will get the same response to their read query, no matter which node returns it.
  • Availability: a guarantee that a user will always get a response from the system within a reasonable time.
  • Partition tolerance: a guarantee that the system will continue operation even if some of its components are down.

If we look at HDFS and Cassandra from the perspective of the CAP theorem, the former will represent CP and the latter – either AP or CP properties. The presence of consistency in Cassandra’s list can be quite puzzling. But, if needed, your Cassandra specialists may tune the replication factor and data consistency levels for writes and reads. As a result, Cassandra will lose the Availability guarantee, but gain a lot in Consistency. At the same time, there’s no possibility to change the CAP theorem orientation for HDFS.

In a nutshell

If you are to make a choice between Apache Cassandra and HDFS, the first thing to take into account is the nature of your raw data. If you have to store and process large data sets, you can consider HDSF, if multiple small records – Cassandra may be a better option. Besides, you should form your requirements towards data consistency, availability and partition tolerance. To make a final decision, it’s critical to understand the exact use of big data storage.

Big data storage: Cassandra vs HDFS

Even if Cassandra seems to outperform HDFS in most cases described, this does not mean that HDFS is weak. Based on your business needs, a professional Hadoop consulting team may suggest a combination of frameworks and technologies with HDFS and Hive or HBase at core that would enable great and seamless performance.


Need professional advice on big data and dedicated technologies? Get it from ScienceSoft, big data expertise since 2013. 

4 Types of Data Analytics to Improve Decision-Making


Editor’s note: If, despite all your efforts, your decision-making is still gut-feeling-based rather than informed, check whether you use the right mix of data analytics types. Read on and turn to our data analytics consultants for tailored recommendations.

Back in the 17th century, John Dryden wrote, “He who would search for pearls must dive below.” Although the author did not have advanced data analytics in mind, the quote perfectly describes its essence. Together with ScienceSoft, let’s find out how deep one should go into data in search of much-needed and fact-based insights.

Types of data analytics

There are 4 different types of analytics. Here, we start with the simplest one and go further to the more sophisticated types. As it happens, the more complex an analysis is, the more value it brings.

4 types of data analytics

Descriptive analytics

Descriptive analytics answers the question of what happened. Let us bring an example from ScienceSoft’s practice: having analyzed monthly revenue and income per product group, and the total quantity of metal parts produced per month, a manufacturer was able to answer a series of ‘what happened’ questions and decide on focus product categories.

Descriptive analytics juggles raw data from multiple data sources to give valuable insights into the past. However, these findings simply signal that something is wrong or right, without explaining why. For this reason, our data consultants don’t recommend highly data-driven companies to settle for descriptive analytics only, they’d rather combine it with other types of data analytics.

Diagnostic analytics

At this stage, historical data can be measured against other data to answer the question of why something happened. For example, you can check ScienceSoft’s BI demo to see how a retailer can drill the sales and gross profit down to categories to find out why they missed their net profit target. Another flashback to our data analytics projects: in the healthcare industry, customer segmentation coupled with several filters applied (like diagnoses and prescribed medications) allowed identifying the influence of medications.

Diagnostic analytics gives in-depth insights into a particular problem. At the same time, a company should have detailed information at their disposal, otherwise, data collection may turn out to be individual for every issue and time-consuming.

Looking for Tailored Recommendations on Data Analytics?

Get a clear picture of your data analytics needs after a free 30-minute consultation with ScienceSoft’s experts.

Predictive analytics

Predictive analytics tells what is likely to happen. It uses the findings of descriptive and diagnostic analytics to detect clusters and exceptions, and to predict future trends, which makes it a valuable tool for forecasting. Check ScienceSoft’s case study to get details on how advanced data analytics allowed a leading FMCG company to predict what they could expect after changing brand positioning.

Predictive analytics belongs to advanced analytics types and brings many advantages like sophisticated analysis based on machine or deep learning and proactive approach that predictions enable. However, our data consultants state it clearly: forecasting is just an estimate, the accuracy of which highly depends on data quality and stability of the situation, so it requires careful treatment and continuous optimization.

Prescriptive analytics

The purpose of prescriptive analytics is to literally prescribe what action to take to eliminate a future problem or take full advantage of a promising trend. An example of prescriptive analytics from our project portfolio: a multinational company was able to identify opportunities for repeat purchases based on customer analytics and sales history.

Prescriptive analytics uses advanced tools and technologies, like machine learning, business rules and algorithms, which makes it sophisticated to implement and manage. Besides, this state-of-the-art type of data analytics requires not only historical internal data but also external information due to the nature of algorithms it’s based on. That is why, before deciding to adopt prescriptive analytics, ScienceSoft strongly recommends weighing the required efforts against an expected added value.

What types of data analytics do companies choose?

To identify if there is a prevailing type of data analytics, let’s turn to different surveys on the topic for the period 2016-2019.

For the 2016 Global Data and Analytics Survey: Big Decisions, more than 2,000 executives were asked to choose a category that described their company’s decision-making process best. Further, C-suite was questioned with what type of analytics they relied on most. The results were the following: descriptive analytics dominated (58%) in the “Rarely data-driven decision-making” category; diagnostic analytics topped the list (34%) in the “Somewhat data-driven” category; predictive analytics (36%) led in the “Highly data-driven” category.

The survey findings are in line with ScienceSoft’s hands-on experience as they show the need for one or the other type of analytics at different stages of a company’s development. For example, the companies that strived for informed decision-making found descriptive analytics insufficient and added up diagnostics analytics or even went as far as predictive one.

For another survey, BARC’s BI Trend Monitor 2017, 2,800 executives shared their opinion on the growing importance of advanced analytics. The term advanced analytics was the umbrella term for predictive and prescriptive analytics types.

According to the 2018 Advanced and Predictive Analytics Market Research, advanced analytics was for the first time considered “critical” or “very important” by a majority of respondents.

Within the BARC’s BI Trend Monitor 2019 survey, C-suite still named advanced analytics among the most important business intelligence trends.

What types of data analytics does your business need?

To define the right mix of data analytics types for your organization, we recommend answering the following questions:

  • What’s the current state of data analytics in my company?
  • How deep do I need to dive into the data? Are the answers to my problems obvious?
  • How far are my current data insights from the insights I need?

The answers to these questions will help you settle on a data analytics strategy. Ideally, the strategy should allow incrementally implementing the analytics types, from the simplest to more advanced. The next step would be to design the data analytics solution with the optimal technology stack, and a detailed roadmap to implement and launch it successfully.

You may try to complete all these tasks with the efforts of an in-house team. In this case, you’ll need to find and train highly qualified data analytics specialists, which will most probably turn lengthy and pricey. To maximize the ROI from implementing data analytics in your organization, we advise you to turn to an experienced data analytics provider with a background in your industry. A mature vendor will share the best practices and take care of everything, from the analysis of your current data analytics state and selection of the right mix of data analytics to bringing the technical solution to life. If the described approach resonates with you, our data analytics services are at your disposal.


Don’t Remain in the Dark When Your Data Can Tell You Everything

Get business visibility with our data analytics services: see what happened in the past, identify root causes, enjoy reliable forecasts.