Use Cases + Guide on How To Start


Editor’s note: In the article, Alex Bekker, Head of Data Analytics Department at ScienceSoft, explains how big data analytics can help a company drive revenue and reduce operational costs. Read on to learn how to start your big data journey and be welcome to explore ScienceSoft’s offer in big data services to learn what approach we follow to help our clients embrace big data potential.

As Head of Data Analytics, I enjoy studying the experiences of renowned companies who drive great value from big data initiatives, so that my team can offer our customers similar and even better results. Here, I’ve selected impressive big data use cases from the manufacturing industry, including, from ScienceSoft’s practice, that I hope will inspire you to embark on a big data journey.

Big data use cases manufacturing

#1. Production optimization

Extracting process improvement

A vertically integrated precious-metal manufacturer’s ore grade declined. The only logical way to avoid loss was to improve metal extracting and refining processes. Using sensor data, the manufacturer’s big data solution identified what factors influenced output the most. And the dominant parameter turned out to be oxygen level. With this insight, the team slightly changed the leaching process and increased the yield by 3.7%. Thanks to big data analysis, the manufacturer now earns $10-20 million additionally every year. Quite a gain, considering the ore grade deterioration rate was 20%.

Chemical yield perfection

A leading European chemicals manufacturer sought to improve yield. Using sensors, their big data solution analyzed how each input factor influenced production output. It analyzed temperatures, quantities, carbon dioxide flow and coolant pressures and compared their influence rates to one another. As a result, they revealed that carbon dioxide flow rates hugely affect the yield. And by slightly changing the parameters, they achieved a significant decrease in raw materials waste (by 20%) and energy costs (by 15%), and impressively improved the yield.

Vaccine yield improvement

A huge pharmaceutical company needed to find a way to improve the yield of their vaccines. To do that, the company’s big data solution analyzed their equipment sensor data, revealed interdependencies between various production parameters and compared how each of them affected the yield. Then, 9 most crucial parameters were identified, reviewed and adjusted to optimize the manufacturing process. It improved vaccines’ yield by 50%. Now, the company additionally makes $5-10 million a year per one substance.

Sugar-sweet optimization

High humidity levels and low-quality raw materials badly affected the taste of sugar of a large sugar manufacturer. To fight it, data science came in use to analyze sensor data and find correlations between the parameters contributing to the best sugar quality. Fortunately, with this insight the manufacturer managed to find a way to quickly influence product quality and achieve a unified sugar standard regardless of external factors. It allowed them to reduce production costs, increase customer satisfaction and simplify workloads.

#2. Quality assurance

Early-stage vehicle quality assurance

As early as 2014, BMW used big data to detect vulnerabilities in their new car prototypes. Data was collected from sensors on the tested prototypes and cars already in use. Due to big data analysis, BMW’s solution (probably integrated with their vehicle design and modelling software) spotted weaknesses and error patterns in the prototypes and in cars already in use. It enabled engineers to remove uncovered vulnerabilities before the prototypes actually went into production and helped reduce recalls of cars already in use. As a result, BMW can not only ensure higher quality at early stages, but also reduce warranty costs, boost brand reputation and probably save lives.

Jet engine design

Rolls-Royce uses big data extensively. And one of their most interesting manufacturing big data experiences is connected with modelling new aircraft engines. At the design stage, their software (integrated with a big data tool) creates simulations of new jet engines and analyzes terabytes of big data to see whether the new models are any good. This allows the company to find weaknesses before the model gets to production, which reduces defect-related costs and helps design the product of a much higher quality. Very smart, don’t you think?

#3. Enterprise management

Data-driven enterprise growth

Using big data analytics in manufacturing, companies can tackle global development challenges, such as transferring production to other countries or opening new factories in new locations. Companies’ historical and external data analysis can establish whether it’s still profitable to run factories in current locations or at current scopes by building predictive models and what-if scenarios. Besides, in the right hands, big data can help explore oceans of unseen opportunity, such as offering new products or even conquering new markets.

Accessible raw materials

To avoid costs connected with supply chain failures, an enterprise needed a better way to manage raw materials delivery. They decided to use their suppliers’ route details as well as weather and traffic data provided by trustworthy external sources to identify the probability of delivery delays. To do that, their big data tool (quite possibly integrated with their MRP) used predictive analytics and calculated possible delays and raw materials shortages. Based on these calculations, the enterprise worked out a supply-related emergency plan and is now able to run their production uninterrupted and avoid excessive downtime costs.

Predictive maintenance

Intel’s factory equipment live-streams IoT-generated data into their big data solution (probably integrated with MES). The analytics solution uses this data for pattern recognition, fault detection and visualization. It allows engineers to see what tendencies require their immediate attention and what actions are needed to prevent serious breakdowns on the shop floor. Such predictive maintenance reduces reaction time from 4 hours to 30 seconds and cuts costs. In 2017, thanks to big data and IoT, Intel predicted saving $100 million. This doesn’t look surprising at all: according to the research, predictive maintenance has appeared on companies’ radars exactly in 2017 and has got straight to top 3 big data use cases.

#4. After sales

Connected car vehicles

One of ScienceSoft’s customers from the connected car industry uses big data to provide after-sales support to their clients and ensure continuous improvement. The customer’s operational centers analyze in real time tons of data fed from car sensors (diagnostics data, mileage, geolocation, etc.) and generate insights into the product’s performance. The analysis of this data allows the company to monitor the product’s state, note and even predict some malfunctions and offer maintenance service early enough to avoid serious breakdowns. Such approach allows the customer to increase the product quality and enhance customer experience.

Hull cleaning

As a standard after-sales procedure, Caterpillar Marine was requested by one if their clients to do an analysis of how hull cleaning impacts fleet performance. Caterpillar’s big data solution (integrated with their Asset Intelligence platform) analyzed data from sensors on ships running with and without cleaned hulls. Then, it found correlations between the client’s hull-cleaning investments and fleet performance. Soon, Caterpillar concluded that their client needed to clean hulls more often (every 6.2 months, not 2 years) and that related investments paid off. As to the manufacturer, big data allowed them to ensure the most efficient exploitation of their products and improve the company’s image.

Wind farm optimization

As a proponent of after-sales with a personalized approach to customers in manufacturing, General Electric helps power producers use big data at 4 levels.

Level 1. Wind turbine’s sensor data analytics enables power producers to optimize turbine’s blade pitch and energy conversion automatically.

Level 2. Wind farm monitoring software compares sensor data to predicted values and recognizes performance patterns, which helps power producers perform preventive maintenance at the farms.

Level 3. Power producers use historical and real-time data to build predictive models, find correlations, detect faults and recognize patterns to optimize the farm’s work.

Level 4. The data is visualized and presented to top management for global-scale informed decision making.

Are you inspired to start leveraging big data potential?

ScienceSoft’s team of big data experts is ready to design, implement or support your big data project to ensure considerable ROI on your big data investments.

A guide on how to start

If the examples of successful big data initiatives triggered your interest, I’ll gladly share a roadmap my colleagues at ScienceSoft and I devised for our customers to set off on a big data journey safely and effectively.

Ready… Set…

big data in manufacturing find approach

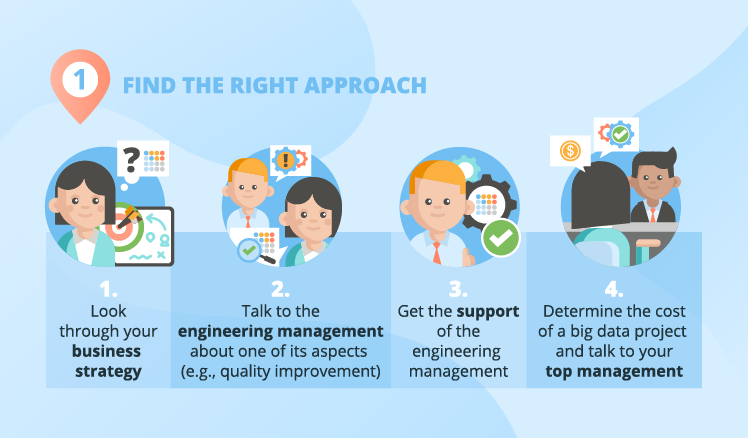
To prepare for a big data adoption project, the first thing crucial for success is finding the right approach. Rather than getting obsessed with the idea of big data, dashing to get the budget and then failing to extract value from it, first, you should lay the groundwork for the possible future ‘novelty.’ Let me show you the steps that will help you achieve business-IT alignment:

Step 1. I always advise big data project sponsors to start with reading about the possibilities of big data, then look at the business strategy and define what goals in it can be achieved with big data’s help.

Step 2. You should get more details on your company’s manufacturing problems and needs. The best way to do it is talking to the engineering management at your enterprise and asking them how the quality improvement process is going. Chances are, the process is problematic and no solution has yet been found, which is where you explain that such challenges can be solved with a thing called big data analytics.

Step 3. Try to get the consent of the engineering management to prove (if needed) to the company’s top management that they do need big data. And also warn them that their involvement will be necessary later to help data analysts understand the needed details of the manufacturing process.

Step 4. Determine a certain range of how much a particular big data project costs and talk to your top management about big data adoption and big data benefits. In our other article, my colleague, Olga Baturina, provided some telling statistics of big data gains.

If you need more details on how to ensure business IT-alignment, you can have a look at the guide written by my colleague, Boris Shiklo, CTO of ScienceSoft.

Go!

plan your big data adoption

I always warn big data project sponsors against applying big data capabilities to complex tasks right from the start. Just like you can’t go to space a few days after deciding to become an astronaut. So, my advice to manufacturing companies is to start out with a simple project (for example, trying to achieve a stable output quality at a vaccine factory). A simple starting project allows you to see how big data can solve your problems with low risks and investments. Which, in its turn, is likely to positively affect your top management’s opinion on big data and encourage them to plan further big data investments (for more serious analytical projects).

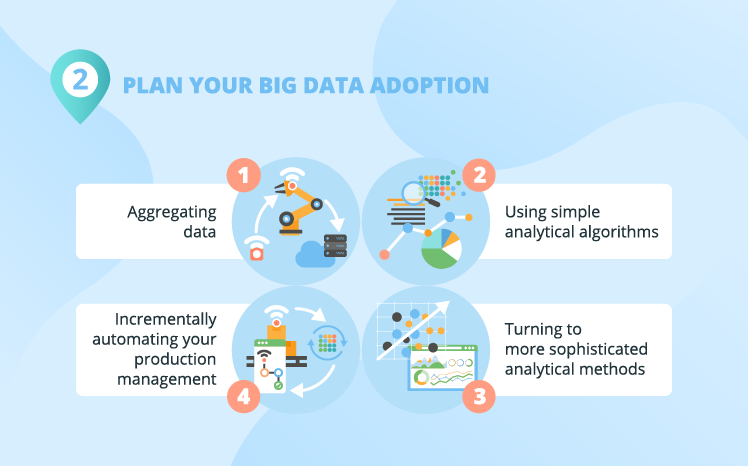
At ScienceSoft, we usually break a big data project down into ‘digestible’ phases that are to be approached separately. Here are the sample phases of a big data project for manufacturing:

  • Aggregating data.
  • Using simple analytical algorithms.
  • Turning to more sophisticated analytical methods.
  • Incrementally automating your production management.

Aggregating data

Before any analysis can happen, you have to start aggregating data. In some cases, it’s not a problem at all: you just deploy/add sensors on your manufacturing equipment, prepare data storing facilities and enjoy the flow of ‘freshly-cut’ data.

In other cases, such as if your production cycle is months- or even years-long, it can prove difficult because you may lack the info on how your production process parameters influence output. And without knowing it, it’s all really a shot in the dark. But don’t get upset: there are ways to fight it. For example, in ScienceSoft’s projects, we recommend our customers to focus on one part of their manufacturing process, rather than on the entire process. That way they can improve the overall process by analyzing and adjusting its constituent parts.

Making analytical baby steps and advancing to big data strides

At ScienceSoft, we usually define the next stages of revealing big data insights:

  1. At first, you can perform relatively simple big data analysis to make targeted changes in your manufacturing processes (to improve product quality, for instance).
  2. Then, you can dig your data deeper to find ways to change your business processes. For example, you used to perform reactive maintenance and, with big data, you start preventive maintenance.
  3. When the time comes, you can even transform your business model, finding a better way to do it through big data analysis (say, you decide to get closer to the customer by making the cars you produce a smart connected product; you deploy sensors on them, analyze data from cars in use and provide after sales services).

The situation, I most commonly encounter, is that at early stages, customers only need the most usual analytical methods, such as correlations and regression analysis. As their big data competences and needs grow, analytical methods become more elaborate, and they start employing predictive analytics and machine learning in search of new business opportunities.

Production management automation

Automation of your production management is probably the most sophisticated way of using big data in manufacturing processes. The concept of automated production management is fairly simple: your historical and incoming sensor data is analyzed in real time and the control apps send targeted commands to actuators on your equipment.

A good example of production management automation is the case with General Electric’s wind turbines. Sensors provide data on energy generation and wind direction, according to which the blade pitch is changed to optimize the wind turbine’s efficiency.

An example to make it clear

Let me share an example of a generalized customer from my practice – a company who produces baby food and decides to go big data. They start with data aggregation (deploy/add data sensors on the production floor and prepare data storage).

For the sake of the example, let’s imagine that systematically, a few times a month, the baby food batches substantially drop in quality. Now, the big data team (together with the engineering team, R&D, product control managers) can find out what causes these quality drops. And together we realize that the manufacturing process doesn’t allow for the variations in the quality of raw material (baby food ingredients). If the ingredients’ quality is lower, the machinery isn’t ‘tuned’ to get a better quality output (say, you don’t adjust temperature and cooking times). And besides that, we also find a way to cut the production cycle duration. This big data application (better quality assurance) can be a good first project.

Getting valuable insights quickly and cheaply makes the company more interested in further big data capabilities and more complex analytical algorithms. And in a while, the enterprise starts running predictive analytics, equipment wear-out analysis and machine learning. Among other things, it allows them to perform predictive maintenance, which enables the staff to react to alarming trends on the manufacturing floor before any real damage is caused.

And as the company expands globally, we help the company to use big data powers to assure and control baby food quality across all the franchisees.

Now, survive

watch for management challenges

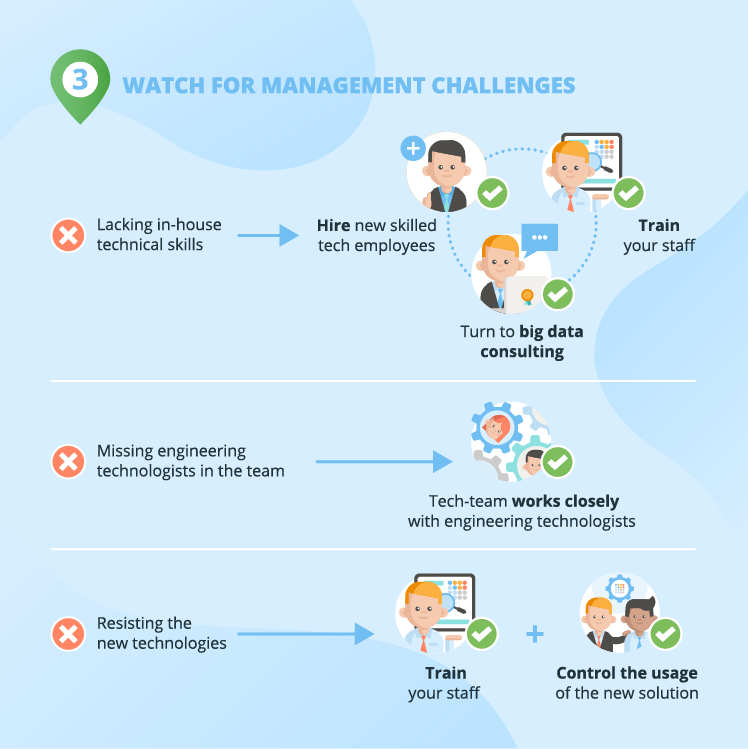
Yes, while starting big-data-adoption action, there are always impediments. Big data project sponsors I talk to commonly voice the following concerns:

  1. Lacking in-house technical skills.

I believe, not every business needs complete outsourcing. For example, at early stages, when you’ll need to experiment a lot, it’s simply easier, if your ‘domestic’ people are involved, thus it’s natural to hire new skilled tech employees or retrain old ones.

  1. Lacking the understanding of big data potential

In case of outsourcing a big data project, your vendor will need to work closely with your team (the engineering team, R&D, product control managers, etc.) to ensure the deep understanding of manufacturing processes. Together with a vendor who has a solid approach to cooperation, you’ll be able to see elaborate ways to improve production and its management with big data potential.

  1. Resisting the new technologies.

Some employees – let’s hope the lesser part – will probably resist big data. And there’s nothing personal about it: for creatures of habit, it’s just more convenient to use the old technologies. Training your staff as well as controlling their usage of the new solution can help deal with this challenge.

You are now ready

The manufacturing use cases show that big data can bring big money and big value. They also show that big data is most widely used for production optimization. And it’s quite logical: big data solutions are really good at finding correlations. While production changes based on sensibly selected correlations can improve yield enormously.

To reap the benefits that big data offers and start using big data in your manufacturing organization, you need to carefully plan your actions. So, let’s rehearse them. You should:

– Find the right approach to your big data. Carefully analyze your business needs, find a way to fulfill them with big data.

– Prudently plan your big data adoption. Don’t jump to the most difficult part right off the start. Find a small-scale project to test big data on. Aggregate data, test simple algorithms and then try more daring ones.

– Watch for management challenges. Gain a thorough big data understanding, don’t rush into outsourcing the project completely and engage a needed number of engineering technologists.

But before starting some real action, I advise you to turn to big data consulting, since it can ease the hardships of big data projects and contribute to big data understanding. If you want to know more about our big data consulting services, reach out to me.


Big data is another step to your business success. We will help you to adopt an advanced approach to big data to unleash its full potential.

Business Intelligence & Analytics Examples: 3 Industries in Focus


In the business world, initiatives are usually locked unless they promise a decent return on investment. According to this scenario, BI initiatives have a high chance of being implemented. Judge for yourselves: ‘BI initiatives drive an average return on investment of 11% and are seen to generate revenue growth and cost savings from every business function’.[1]

With a ‘bring value’ principle in their DNA, ScienceSoft’s business intelligence implementation team puts best efforts for your BI project to generate an above-the-average ROI. In this article, we’ve compiled business intelligence examples so that you could get a real feel of BI capabilities in 3 industries. For each industry, you’ll find:

  • Typical insights that a BI solution helps to get.
  • Examples of dashboards implemented on Microsoft Power BI, a self-service analysis and visualization tool.
  • Real-life examples of BI solutions that ScienceSoft developed for the retail, healthcare, and real estate development industries.

business intelligence analytics examples

Business intelligence for retail: Focus on customers and performance

Retail-specific insights

With the help of business intelligence software, retail companies can:

  • Understand customer segments, their preferences and behavior across the channels (i.e., store, web, mobile, social media).
  • Analyze sales from different angles, i.e., like-for-like sales, sales by geography, by channel, by store, by category.
  • Measure the performance of retail stores, product categories, product lines, brands, SKUs, private label products, and identify best practices.
  • Create data-driven forecasts (i.e., for sales, for new product lines).
  • Analyze the performance of an online store: traffic, conversion rates, cart abandonment, wish list, promotion efficiency.
  • Map the number of employees to the customer traffic flow, and the inventory level to sales.

An example of a retail dashboard

bi examples retail dashboard

Being that concise, the dashboard can show the retailer’s sales from different perspectives as it allows applying multiple filters. For example with a few clicks, a business user can choose a specific country, a product category and a sales channel, and see the graphs and values altered in line with their selection. To see how it works in practice, watch our BI demo.

A real-life business case for retail

For one of our customers, ScienceSoft developed a data analytics solution that enabled robust retail analytics. Aggregating data from CRM, Magento (ecommerce), and Google Analytics, the solution provided an undistorted picture of traffic and conversion rates, as well as allowed measuring the engagement of online store visitors.

Thanks to real-time analytics capabilities embedded in the solution, the customer was able to track the actual stock level both at the warehouse and in the stores, which was a huge step forward compared to the shared document previously used for that purpose.

Besides, the solution allowed for goal management and KPI tracking, which helped the customer to assess their employees’ quality of work (i.e., how much they cross-sell and up-sell).

Read also:

Business intelligence for healthcare: Focus on patients, control of financials and improvement

Healthcare-specific insights

With BI solutions, healthcare providers can aggregate electronic health records, patient-generated health data, and internal data on costs, staffing, and utilization (i.e., of beds, equipment, operating rooms) to:

  • Monitor patients’ health status, evaluate the treatment progress and reduce the rate of readmissions.
  • Analyze and improve patient outcomes (i.e., identify trends in disease development, find the dependencies between health risk factors and diagnoses, medications and outcomes).
  • Measure and control the financials, such as revenue cycle management, costs, return on investments and cash flow.
  • Improve internal processes based on analyzing medication use, equipment and bed utilization efficiency.

An example of a healthcare dashboard

bi examples healthcare dashboard

A real-life business case for healthcare

ScienceSoft implemented a BI solution for a health information exchange vendor. The solution aggregated data retrieved from the systems of multiple healthcare providers and allowed its comprehensive analysis. Our BI team also designed and implemented a set of dashboards to let the customer:

  • Check the patients’ profiles.
  • Analyze health problems the patients encountered, classify these problems (i.e., by type, time range, patients’ age), and identify the most frequent ones.
  • Track the medications used.
  • Find out dependencies, i.e., those existing between diagnoses, medications and health problems.

Business intelligence for real estate development: Focus on property and tenant management

Real estate-specific insights

With BI applications in place, real estate developers can:

  • Efficiently manage the property by analyzing property metrics, use, tenure, occupancy status.
  • Assess the location and availability of the property.
  • Improve space utilization by understanding occupancy (i.e., by geography, property type) and payable rent.
  • Monitor the financial health of the business (by tracking such KPIs as a net income, cash flow, profitability per square foot, market share growth).
  • Understand the tenants’ profiles and manage them.
  • Manage risks.

An example of a dashboard for a real estate developer

bi examples real estate dashboard

A real-life business case for real estate development

For a commercial and residential real estate developer, ScienceSoft implemented a BI solution that enabled comprehensive financial reporting based on the data aggregated from 40 diverse data sources. The reporting embraced main financial indicators like income, operating expenses, cash at the end of the period, assets and liabilities, and more, for both the entire company and its separate branches. 17 financial reports of different levels of detail provided the developer with a multifaceted view of their finances.

Though different, these BI examples have something in common

Despite a BI solution is always tailored to a certain business and its needs, we can still name two features shared by the three examples we considered:

  • Data aggregation is power: making use of data retrieved from multiple sources is a foundation for comprehensive and insightful reporting.
  • It’s convenient when a reporting tool allows for self-service business analytics with drill-down and filtering opportunities, as well as intuitive dashboards – this speeds up the path to insights.

[1] Source: Dresner Advisory Services LLC, accessed on 10/22/2019.


BI expertise since 2005. Full-cycle services to deliver powerful BI solutions with rich analysis options. Iterative development to bring quick wins.

Microsoft Certifications in Business Intelligence and Data Science


The extensive list of Microsoft certifications includes the ones in business intelligence and data science domains. As data science and business intelligence consultants, we can easily explain why these certificates are so popular: these directions are actively developing and the relevant workforce is highly demanded on the market.

Here, we take a closer look at the current situation with Microsoft certifications that prove the mastery of SQL Server, Power BI, Excel, and Azure services that relate to AI and machine learning (we’ll call them business intelligence and data science certificates) and explain what skills they verify, how to get them and what benefits they can bring.

Microsoft-bi-certifications

Benefits of having Microsoft certifications

For companies, having a Microsoft certified specialist on board means having skills that the company can make use of in real-life projects. According to the research, Microsoft certified developers are 90% more productive and nearly 60% more efficient compared to their non-certified peers.

For a vast number of BI and data science-related jobs like BI developers, data scientists and data analysts, Microsoft certifications serve as a quality mark. That’s the first-hand experience that ScienceSoft’s analytics team can share. Being Microsoft certified turns a competitive advantage and increases the holders’ chances for hiring and having a higher salary than their uncertified peers. Plus, this demonstrates their desire and ability to learn and develop.

Available Microsoft BI and data science certifications

At Inspire 2019, Microsoft announced significant changes in their certification program and the adoption of role-based certifications. For example, they are moving away from Microsoft Certified Solutions Associates and Microsoft Certified Solutions Experts (or MCSAs and MCSEs, which are still available) and introducing the ‘Microsoft Certified’ status that goes along with the job role and the level achieved within their certification framework (Fundamentals, Associate, or Expert). Besides, Microsoft will extend their list of certifications with 10+ roles in January – June 2020 with some of them possibly being from BI or data science domains.

As of September 2019, the list of available BI and data science certifications looks as follows:

Certification name The skills that the certification proves

Microsoft business intelligence certifications

Please note that according to the classification suggested by Microsoft, this group of certificates is called Data Analytics and Management.

MCSA: SQL Server 2012/2014
  • Modifying data with Transact-SQL.
  • Running queries with Transact-SQL and optimizing queries.
  • Installing and configuring SQL Server 2012/2014.
  • Backing up and restoring SQL Server 2012/2014 databases.
  • Securing SQL Server 2012/2014.
  • Designing and implementing a data warehouse with Microsoft SQL Server 2012/2014.
  • Configuring and deploying SQL Server Integration Services solutions.
MCSA: SQL 2016 Database Development
  • Managing data with Transact-SQL.
  • Querying data with Transact-SQL.
  • Designing, implementing and optimizing databases.
MCSA: SQL 2016 Database Administration
  • Configuring data access and auditing.
  • Managing backup and restore of databases.
  • Managing high availability and disaster recovery.
  • Managing and monitoring databases and instances.
  • Managing storage.
MCSA: SQL 2016 BI Development
  • Designing, implementing, and maintaining a data warehouse.
  • Designing and implementing extract, transform, and load (ETL) processes.
  • Implementing BI solutions using multidimensional and tabular data models and online analytical processing (OLAP) cubes.
  • Building data quality solutions.
MCSA: BI Reporting

Using Microsoft Power BI and Excel to perform data analysis:

  • Connecting to data sources.
  • Performing basic and advanced data transformations.
  • Cleaning data.
  • Creating and optimizing data models.
  • Visualizing data.
MCSE: Data Management and Analytics
  • Administering SQL Server Database.
  • Designing, implementing and maintaining enterprise-scale BI solutions.
  • Analyzing and visualizing data.

Microsoft data science certifications that embrace big data and machine learning

Please note that according to the classification suggested by Microsoft, this group of certificates is called Azure certification.

Microsoft Certified: Azure AI Engineer Associate
  • Designing and implementing AI solutions.
  • Monitoring and evaluating the AI environment.
Microsoft Certified: Azure Data Engineer Associate
  • Designing, implementing, managing and optimizing Azure data storage solutions.
  • Designing data processing and data security procedures.
Microsoft Certified: Azure Data Scientist Associate
  • Preparing data for modeling.
  • Performing feature engineering.
  • Developing data science models.

How to get Microsoft BI and data science certifications?

To get a certification, a candidate should make a certain path suggested by Microsoft. Mainly, this path consists of two corresponding exams. However, there are cases when a candidate should satisfy some prerequisites first. For example, to get MCSE: Data Management and Analytics, a candidate should first attain one of the relevant MSCAs in the business intelligence domain.

To show various BI and data science paths that Microsoft offers, we’ve compiled two convenient schemes:

Microsoft business intelligence certification paths

Microsoft BI certification paths

Microsoft data science certification paths

Microsoft data science certification paths

For each exam, Microsoft shares clear guidelines. They describe what skills will be tested, indicate sample tasks and the share of this kind of tasks in the overall test. Besides, Microsofts provides rich learning materials and a candidate can choose the preferred preparation option, be it instructor-led or self-paced training, studying relevant books or taking official practice tests.

How much do certifications cost?

The certification cost depends on the path that a candidate is to follow. As the cost of one exam is $165, the final cost will depend on the number of exams in a path that a candidate should take. Let’s consider the longest (and therefore the most expensive path) – earning the MCSE Data Management and Analytics certification by a candidate following the MCSA SQL Server 2012/2014 path. As the candidate has to pass four exams, the total cost of getting the MCSE is $660 (in case, a candidate passes all the exams on their first attempt). By the way, a candidate is allowed to take a certain exam no more than 5 times within 12 months.

Still, we strongly recommend clarifying the exact pricing before registering to take an exam, as Microsoft grants discounts to some candidates, for example, Microsoft Partner Network members, as well as makes promotional offers.

Do Microsoft certifications expire?

Technically, Microsoft BI certifications don’t expire. However, each certification is always bound to a specific date when it’s earned. As the technologies evolve and their fresher versions replace their predecessors, it’s natural to expect that a certification earned in 2012 may fail to create a competitive advantage in 2019. Perfectly understanding this, Microsoft regularly updates their exams. Plus, they usually offer transitional exams to help renew the certification at a discount.

To go or not to go for Microsoft BI and data science certifications?

We, at ScienceSoft, see strong arguments for obtaining Microsoft BI and data science certifications:

  • Microsoft is a world-known tech giant, and their certifications serve as a quality mark for BI and data science specialists worldwide.
  • The list of Microsoft business intelligence tools is vast, and they are widely used for data warehouses, OLAP cubes and reporting components of analytics solutions, which makes the specialists that have mastered such tools highly demanded.
  • Microsoft Azure is among the top three cloud providers in 2019, so the mastery of Azure technologies is a true competitive advantage for the specialists working in data science and big data domains.

5 Types of Artificial Intelligence That Bring Value to Business


Similar to a constellation where you can spot different stars, artificial intelligence (AI) can be brought down into different types. To help you decide what AI type will shine brightest and contribute to your business’ stellar performance, our data science consultants will define each. However, let’s first dispel the clouds to have a clear look at AI as a whole.

AI defined

Artificial intelligence enables a computer system to be trained and apply the gained knowledge to new inputs. This ability rests upon math and algorithms and is applicable only to the tasks that the system has been trained to perform.

To visualize the AI concept clearer, you may think of a chatbot whose task is to help restaurant visitors to book a table. By nature, this chatbot is a computer program that is trained on tons of booking-a-table questions and relevant answers. That’s how it learns of a typical conversation flow on the topic. After the training, the chatbot can dialogue with customers. However, if a customer deviates from the main topic of booking a table and asks for food recommendations, the chatbot in question is of little help as it is not trained to perform this task.

Types of artificial intelligence

Types of AI

To help you decide how exactly AI can be put into practical use, we offer our classification based on our 34 years of experience in data science. For each AI type, we’ll give a brief explanation, name the most prominent business use cases, as well as share real-life examples from our artificial intelligence consulting practice.

Analytic AI

Powered with machine learning (including its most advanced deep learning techniques), analytic AI scans tons of data for dependencies and patterns to ultimately produce recommendations or provide a business with insights, thus contributing to data-driven decision-making.

Sentiment analysis and supplier risk assessment are just a few examples of analytic AI in action. If you’d like to get a complete picture of how such a solution works, our experts have summarized the insights gained from their experience with two of the use cases – inventory optimization and demand forecasting.

Functional AI

Functional AI is very similar to analytic AI – it also scans huge amounts of data and searches for patterns and dependencies in it. However, instead of giving recommendations, functional AI takes actions. For instance, being the part of the IoT cloud, it can spot a machine-breakdown pattern in the sensor data received from a certain machine, and trigger a command to turn this machine off. Another example: robots that Amazon uses to bring the shelves with the goods to the pickers, thus speeding up the picking process.

Interactive AI

This type of AI allows businesses to automate communication without compromising on interactivity. To envisage this type of AI, think of chatbots and smart personal assistants whose abilities can vary from answering pre-built questions to understanding the conversation context.

Interactive AI can serve another purpose – improving a company’s internal processes. For example, one of our projects was dedicated to creating a chatbot to facilitate the corporate process of vacation booking.

Text AI

Businesses that use text AI can enjoy text recognition, speech-to-text conversion, machine translation, and content generation capabilities. Even if a company is not Google or Amazon, or any other giant company that provides text AI as a service, it can still take advantage of this AI type. For example, the company can use text AI to power an internal corporate knowledge base.

Contrary to a traditional knowledge base that rests upon a search by keywords, an AI-powered one can find the document containing the most relevant answer even if the document doesn’t have full keywords. This is possible thanks to semantic search and natural language processing, which allow AI to build semantic maps and recognize synonyms to understand the context of the user’s question.

Visual AI

With visual AI, businesses can identify, recognize, classify and sort objects or convert images and videos into insights. A computer system that helps an insurer to estimate damage based on damaged car photos or a machine that grades apples based on their color and size are the examples of visual AI. This type of AI covers computer vision or augmented reality fields.

To get the real feel of the value that visual AI can bring, you can read in more detail about a face recognition solution that we developed to help a retailer enhance and personalize their customer service; or about an application for automated inspections that allowed a manufacturer to immediately control the quality of the produced details.

In the finale

AI has become a trend that cannot be disregarded: hardly any report or survey doesn’t mention its growing importance. Gartner names AI a top priority for CIOs. Accenture Technology Vision 2019 Report cites that 89% of businesses either have already adopted or are experimenting with AI. And PWC 2019 AI Predictions Survey of 1,000 executives reveals that they expect the following value from AI investments: increased revenue and profits (48%), better customer experience (46%) and improved decision-making (40%). However, to take advantage of AI, companies have to overcome some obstacles. For example, a survey by McKinsey&Company names top 3 barriers: the lack of a clear strategy for AI (43%), the lack of the talent with appropriate skills (42%) and functional silos that constrain end-to-end AI solutions (30%).

And what about your business? We have shown the multifaceted nature of AI for you to find your way to get value from it. You can opt for any of 5 AI types – analytic, interactive, text, visual, and functional – or wisely combine several ones.


Maximize the power of artificial intelligence with our professional consulting services. Get in touch with us to embark on your path to AI-driven excellence!

The True Value of Cloud Business Intelligence + Top 3 BI Tools to Consider


Editor’s note: In this article, Maryna explains how to gain vision into your business processes with cloud business intelligence (BI). Check out the top 3 cloud BI tools according to ScienceSoft, and if you need thorough expert engagement in your BI project, consider our business intelligence services.

According to Boardroom Stats from Google Cloud, more than 40% of survey respondents plan to increase their investment in cloud-based services and products while 30% are going to migrate legacy enterprise software to the cloud. So, if right now you’re trying to figure out what makes the cloud so popular and whether it is the right place for your BI solution, keep on reading. Below, I dwell on the idea of cloud business intelligence and share my thoughts about why cloud business intelligence solutions are worth considering.

Cloud business analytics and its deployment models

Cloud-based business intelligence is the process of transforming data into meaningful insights with the help of technology, which is partially or fully conducted in the cloud environment.

Cloud BI solutions allow companies to:

  • Eliminate all hardware-related BI costs.
  • Deploy a BI solution fast as well as scale it up and down in storage and compute resources time- and cost-effectively.
  • Access data via any web browser or mobile device.
  • Ensure BI solution’s high availability and fault-tolerance.
  • Securely share actionable insights among colleagues.

cloud bi deployment models

A web-based BI solution or its part (e.g., data storage) can function within 3 cloud types:

Public cloud

A public cloud implies that the infrastructure costs are split among cloud tenants, which makes it the most affordable option for cloud BI. It’s a great option for small and mid-sized businesses with limited budget calls or companies dealing with big data workloads.

For example, in one of ScienceSoft’s projects, we hosted a big data analytics solution in Azure and AWS clouds to let a market research company accommodate and effectively process the continuously growing amount of data thanks to storage and compute cloud resources. At the same time, they were able to meet their budget requirements due to reasonable public cloud pricing.

Private cloud

If you worry about regulatory compliance or data security, I advise deploying a BI solution in a private cloud. Being the most expensive cloud option, the private cloud provides dedicated storage and compute resources exclusively at your company’s disposal.

Hybrid cloud

If you cannot afford locating the whole BI solution in the private cloud but have to comply with strict regulations (HIPAA, GLBA, GDPR, etc.), a hybrid cloud is your way to go. This computing environment combines the traits of a public cloud and a private cloud. By choosing this option, you can, say, store and analyze your sensitive data in the private cloud and experiment with big data in the public one.

Need Help with Defining Where to Host Your BI Solution?

ScienceSoft is ready to advise on the most suitable location of your BI solution so that you can gain greater visibility into your business processes and uplift your decision-making.

Cloud BI software capabilities to look for

cloud bi software capabilities

When deciding on placing BI in the cloud, many companies face the dilemma of what software to choose to structure their BI solution with. Modern BI software offers a wide range of capabilities, and, as a BI consultant, I advise you to prioritize the following ones:

  • Built-in data management capabilities – to allow extracting data from multiple sources, transforming it into the required format suitable for analysis as well as cleansing data to ensure its high quality.
  • Advanced analytics capabilities – to facilitate data mining and predictive analytics for effective root-cause analysis and accurate forecasting.
  • Rich cloud reporting and visualization capabilities – to enable every user to obtain the required analytics insights in the comprehendible format.
  • Collaborative capabilities – to share analytics with colleagues in real time for quicker decision-making and data democratization.

In case you are a bit overwhelmed with the whole variety of cloud business intelligence software, you can always resort to professional consultancy for assistance or fix the software-related issues once and for all by opting for data analytics as a service.

Top cloud business intelligence tools

With the above capabilities taken into account and drawing on our experience with cloud-based BI solutions, ScienceSoft presents you with its list of top web-based business intelligence tools.

Power BI

Power BI is a recognized leader in analytics and business intelligence platforms. Affordable pricing, intuitive interface, and the ability to address analytical challenges of different complexity make Microsoft Power BI top our list.

Services: Power BI Pro, Power BI Premium, Power BI Mobile, Power BI Embedded, Power BI Report Server.

Pricing: Power BI Mobile – free, Power BI Pro – $9.99/user/month, Power BI Premium – starting from $4,995/dedicated resources/month.

Demo: Power BI

Qlik Sense

The tool is praised for its unique associative analytics engine in combination with drag-and-drop visualization and data storytelling functionality.

Pricing: Qlik Sense Business edition – $30/user/month, Qlik Sense Enterprise: Professional User – $70/user/month, Analyzer User – $40/ user/month.

Tableau

With its user-friendly interface, Tableau offers such capabilities as vast data integration, augmented data preparation, advanced data analysis, rich visualization, secure collaboration, and much more.

Services: Tableau Prep, Tableau Server, Tableau Online, Tableau Data Management, Tableau Server Management, Tableau Mobile, Embedded Analytics.

Pricing: Tableau Creator – $70/user/month, Tableau Explorer – $35- $42/user/month (depending on the deployment model), Tableau Viewer – $15/user/month.

It’s time to benefit from the synergy of BI and the cloud!

Cloud computing is already a business requirement rather than an option because of scalability, cost-effectiveness, and high service availability it offers. So, if you want to reap the above cloud benefits with your BI solution, let your first step be choosing a reliable vendor that will help your develop your BI implementation strategy and guide you towards your project’s success. In case you are looking for competent assistance, feel free to consider ScienceSoft for this task.


We offer BI consulting services to answer your business questions and make your analytics insightful, reliable and timely.

40 Use Cases and Real-life Examples


In a world where consultancies offer a hefty list of big data services, businesses still struggle to understand what value big data actually brings and what its most efficient use can be. Before committing to big data initiatives, companies tend to search for their competitors’ real-life examples and evaluate the success of their endeavors. So, our data consultants decided to save a mile on the investigation path for those interested in big data usage and conducted secondary research based on 11 dedicated studies and reports published between 2015 and 2019. We also spiced our research up with the voices of well-known companies that shared their experience in big data adoption.

how companies use big data

How companies of different sizes use big data

In this section, we’ll refer to the following segments: small, mid-sized, large and very large organizations. This categorization is based on the number of employees in a business or an institution:

  • Small organizations (1-100 employees).
  • Mid-sized organizations (101-1,000 employees).
  • Large organizations (1,001- 5,000 employees).
  • Very large organizations (more than 5,000 employees).


Very large organizations (5,000+ employees) are the main adopters of big data: 70% of such businesses and institutions report that they already use big data. [1]


Among all organization segments, very large organizations (5,000+ employees) are most interested in using big data for data warehouse optimization. [1]


43-45% of small, mid-sized and large organizations (fewer than 5,000 employees) already use big data, and all the segments are similarly open to the future use. [1]


Top 3 big data use cases for mid-sized, large and very large organizations (fewer than 5,000 employees) are data warehouse optimization, predictive maintenance and customer analytics[1]


Of all organization segments, small organizations (up to 100 employees) are most interested in using big data for customer analytics. [1]

How different industries use big data

Three industries most active in big data usage are telecommunications, healthcare, and financial services. [2]

big data use by industry

Telecommunications

Top 3 use cases for telecoms are customer acquisition (93%), network optimization (85%), and customer retention (81%). [2]


The telecommunications industry is an absolute leader in terms of big data adoption – 87% of telecom companies already benefit from big data, while the remaining 13% say that they may use big data in the future. [1]


Telecoms plan to enrich their portfolio of big data use cases with location-based device analysis (46%) and revenue assurance (45%). The optimization of prices, call centers and networks is also among the priorities. [2]

Healthcare

Almost 60% of healthcare organizations already use big data and nearly all the remaining ones are open to adopting big data initiatives in the future. [1]


Personalized treatment (98%), patient admissions prediction (92%) and practice management and optimization (92%) are the most popular big data use cases among healthcare organizations. [2]


Healthcare organizations plan to further expand their current big data usage with patient segmentation (31%) and clinical research optimization (25%). [2]

Financial services

76% of financial services institutions are currently big data users. [1]


Financial services institutions use big data for customer analytics to personalize their offers (93%), as well as for risk assessment (89%), fraud detection (86%) and security threat detection (86%). [2]


Top 3 extra use cases that financial services institutions planned to add in 2017-2018 were location-based security analysis (66%), algorithmic trading (57%), and influencer analysis (37%). [2]


In 2017, the top area that financial services institutions were investing in was predictive analytics (38%). However, in 2018’s list of priorities, it fell to the second place (with 29%), giving way to a new leader – AI and machine learning. [3]

Education

In education, the rate of big data adoption so far is the lowest – only 25% – when compared with telecommunications (87%), financial services (76%), healthcare (60%) and technology industries (60%). However, 67% of respondents don’t rule big data out as a future possibility. [1]

Insurance

Insurers expect that big data can help most efficiently in the areas of pricing, underwriting and risk selection (92%), management decisions (84%), loss control and claim management (76%). [4]

What use cases prevail for each big data technology

What use cases prevail for each big data technology

Hadoop use cases

Runtime environment for advanced analytics, memory for raw or detailed data, and data preparation and integration are top 3 use cases for Hadoop. [5]


Customer intelligence leads the list of Hadoop projects.  [5]


While 39% of organizations use Hadoop as a data lake, the popularity of this use case will fall by 2% over the coming three years.  [6]

Spark use cases

Top 3 Spark-based projects are business/customer intelligence (68%), data warehousing (52%), and real-time or streaming solutions (45%).  [7]


55% of organizations use Spark for data processing, engineering and ETL tasks. [8]


33% of companies use Spark in their machine learning initiatives. [8]

What value big data brings

Organizations value managing data in real time (70%) and accessing relevant data rapidly (68%) most. [2]


The biggest value that big data delivers are decreased expenses (49.2%) and newly created avenues for innovation (44.3%). [10]


48.4% of organizations assess their results from big data as highly successful. [10]


While 69.4% of organizations started using big data to establish a data-driven culture, only 27.9% report successful results. [10]


84% of enterprises invest in advanced analytics to support improved business decision making. [11]


Advanced analytics (36%), improved customer service (23%) and decreased expenses (13%) are top 3 priorities for investing into big data and AI. [11]

The history of big data usage in numbers

Big data adoption is constantly growing: the number of companies using big data has dramatically increased from just 17% in 2015 to 53% in 2017. In 2018, 97.2% of companies indicated that they were investing in big data and AI.  [1], [11]


In 2015-2017, companies named data warehouse optimization as #1 big data use case, while in 2018 the focus shifted to advanced analytics.  [1][11]


Predictive maintenance has appeared on companies’ radars only in 2017 and has got straight to top 3 big data use cases.  [1]


Within 2015-2017, sales and marketing (in every industry) were the areas where data and analytics brought significant or fundamental changes. [9]

Big data stories of big companies

Check what Walmart, PepsiCo, JPMorgan Chase, Rolls-Royce, and Uber have to say about their big data experience.

“Over time, the need for more insights has resulted in over 100 petabytes of analytical data that needs to be cleaned, stored, and served with minimum latency through our Hadoop-based big data platform. Since 2014, we have worked to develop a big data solution that ensures data reliability, scalability, and ease-of-use, and are now focusing on increasing our platform’s speed and efficiency.”

Reza Shiftehfar, Hadoop Platform Team Leader at Uber

“Walmart relies on big data to get a real-time view of the workflow in the pharmacy, distribution centers and throughout our stores and e-commerce.”

Walmart Staff

“[About their big data platform Pep Worx] We were able to launch the product [Quaker Overnight Oats] using very targeted media, all the way through targeted in-store support, to engage those most valuable shoppers and bring the product to life at retail in a unique way. These priority customers drove 80% of the product’s sales growth in the first 12 weeks after launch.”

Jeff Swearingen, Senior Vice President of Marketing at PepsiCo

“Artificial intelligence, big data and machine learning are helping us reduce risk and fraud, upgrade service, improve underwriting and enhance marketing across the firm.”

Jamie Dimon, Chairman and Chief Executive Officer at JPMorgan Chase

“We have huge clusters of high-power computing which are used in the design process. We generate tens of terabytes of data on each simulation of one of our jet engines. We then have to use some pretty sophisticated computer techniques to look into that massive dataset and visualize whether that particular product we’ve designed is good or bad. Visualizing big data is just as important as the techniques we use for manipulating it.”

Paul Stein, Chief Scientific Officer at Rolls-Royce

A quick final look at big data

The findings of our secondary research are in line with our hands-on experience: businesses increasingly adopt big data, and, overall, they are highly satisfied with the results of their initiatives. Though the majority of big data use cases are about data storage and processing, they cover multiple business aspects, such as customer analytics, risk assessment and fraud detection. So, each business can find the relevant use case to satisfy their particular needs.

References

[1] 2017 Big Data Analytics Market Study by Dresner Advisory Services

[2] IDC/Dell EMC, Big Data: Turning Promise Into Reality

[3] Survey Report 2018: Big Data Analytics for Financial Services

[4] 2016 Predictive Modeling Benchmark Survey (U.S.) by Willis Towers Watson

[5] Business Application Research Center, Why Companies Use Big Data Analytics

[6] TDWI, Hadoop for the Enterprise

[7] Databricks, Apache Spark Survey 2016 Report

[8] Apache Spark Market Survey by Taneja Group

[9] McKinsey, Analytics comes of age

[10] 2017 Big Data Executive Survey by NewVantage Partners

[11] 2018 Big Data Executive Survey by NewVantage Partners


Big data is another step to your business success. We will help you to adopt an advanced approach to big data to unleash its full potential.

Teradata Storage Optimization


Introduction

Teradata is an integrated platform that provides functionality to store, access, and analyze organizational data on the Cloud as well as On-Premise infrastructure. Teradata Database provides an information repository system, along with support for various tools and utilities, making it a complete and active relational database management system.

Teradata is based on a parallel Data Warehouse with shared-nothing architecture.

  • Data is stored in a row-based format.
  • It supports a hybrid storage model in which frequently accessed data is stored in SSD whereas rarely accessed data is stored on HDD.
  • The platform supports a Table partitioning feature and enforces Primary and Secondary Indexes.
  • The Data Warehouse can scale up to 2048 nodes, thus offering data storage ability up to 94 petabytes.
  • The Data Model is designed to be fault-tolerant and be scalable with redundant network connectivity to ensure reliability for critical use case

Teradata Storage Approach and Challenges

The sizes of the Teradata systems managing relational databases range up to 2,048 CPUs and 2,048 GB of memory supporting 128 TB or larger databases. The BYNET interconnect supports up to 512 nodes.

However, the major challenges with Teradata are:

  • Huge data warehouse cost
  • Not being an agile cloud data warehouse

Teradata is on the higher end of the pricing spectrum, and so capacity management is its biggest challenge. And when no solution is presented to optimize storage, customers decide to move away from Teradata to other alternatives. Managing storage capacity effectively is the only solution to overcome this challenge

Optimization of Teradata Storage

While working with Teradata, the following database sizing considerations must be taken into account:

  • Capacity planning of system and data disks
  • Data disk space allocation
  • Determination of usable data space

Capacity Planning of System and Data Disks

  • Warm and hot data typically constitute what is often called the operational data store. One of the Teradata data warehouse’s features is its hybrid storage, where frequently used hot data is stored on very high-performance solid state drives while less frequently used cold data is placed on traditional hard disk drives. The placement and migration of data based on data temperature is fully automatic and ongoing with the Teradata Virtual Storage feature. By paying attention to data temperature, Teradata can deliver higher query throughput and more consistent response times.
  • Data compression includes both value-compression and algorithmic compression of data. When describing the compression of hash and join indexes, compression generally refers to row compression. While algorithmic compression can be either lossless or lossy, depending on the algorithm used. Compression has two principal applications: Reducing storage costs and Enhancing system performance.

Data Disk Space Allocation

  • Disk or spool space is allocated based on system needs and tends to run out quickly unless proactively planned and reserved. Some guidelines for allocating disk space optimally include:
    • Create a special database to act as a spool space reservoir.
    • Allocate 2% of the total user space in the system for this database.
    • Assign roughly 0.25% of the total space to each user as an upper limit, ensuring that each receives at least as much space as the size of the largest table they access concurrently.
  • Apart from the actual allocation of the disk space, there are other operational considerations that can optimize disk allocation:
    • Limit query size – the smaller the query, the less spool space required. If a particular user only performs small queries, then allocate less spool to that user. If a user performs many large queries, then allocate more spool to that user.
    • Optimize database size – the more AMPs in the configuration, the more thinly spread the data, so the more spool required per AMP.
    • Optimize the other factors such as average spool use per user, number of concurrent users, number of concurrent queries permitted for any one user.
  • Plan for system and table space. Consider database sizing issues such as allocating permanent space and estimating database size requirements

Determination of Usable Data Space

This looks into system and hardware-oriented considerations undertaken for capacity planning.

Here are some recommended tasks in this regard:

  • Use Teradata Viewpoint to monitor and manage the workload.
  • Collect user resource usage detail data. Heavy resource consumers over time, skewed work, and application usage trends can be identified.
  • Collect ResUsage data. The ResUsage tables report on the aggregate effect of all user requests on various system components over time, and can identify bottlenecks and capacity issues. See Resource Usage Macros and Tables for details on all ResUsage data and macros.
  • Use the Locking Logger utility. Locking logger is essential for identifying locking conflicts.
  • Use Database query logging. The Database Query Log records details on queries run, including arrival rates, response times, objects accessed, and SQL statements performed
  • Use the Priority Scheduler utility. Priority Scheduler monitor output information shows comparative CPU usage across Priority Scheduler groups. This monitor output should be collected daily, minimally at a 5 or 10-minute interval, then summarized or charted.
  • Additionally, use the following best practices:
    • Reserve 25% to 35% of total space for spool space and spool growth buffer. When you create user SysAdmin, you can leave the SPOOL parameter unspecified, so it defaults to the maximum allocation of the owning user, user DBC.
    • Allow an extra 5% of PERM space in user DBC.
    • Each time a new user or database is created, specify the maximum amount of spool space that a query submitted by that user can consume

Conclusion

Teradata is a complete and active relational database management system with a data repository as well as analytical system. However, Teradata is priced higher than its competitors and that urges customers to consider alternatives and move away from Teradata. One of the ways to combat this issue is to look at ways to optimize and provide better storage options. Managing storage capacity effectively would give Teradata the advantage it needs to retain and increase customer engagement.

Benefits, Types, Tools and More


Editor’s note: Is cloud-based data analytics a viable option for your business? To help you answer this question, Maryna dwells on what cloud analytics is and its benefits and shares a list of best tools for data analysis in the cloud according to ScienceSoft. And if you need assistance in enabling your cloud data analytics, feel free to resort to ScienceSoft’s data analytics consulting services.

The size of the global cloud-based business analytics software market is expected to reach $57.055 million by 2023, as more and more companies start to acknowledge that the cloud is the best place to run enterprise-scale analytics. As a BI consultant, I see many reasons why cloud analysis is beneficial for companies nowadays, so let me explain the essence of cloud analytics and share these reasons with you.

Cloud analytics and its types

types of cloud analytics deployment types

With cloud analytics, data analysis and the related processes (data integration, aggregation, storage, and reporting) are fully or partially conducted in the cloud.

Based on the cloud environment, where data analysis is performed, you can define three types of cloud analytics. All of them offer such advantages as the absence of hardware-related costs, scalability, and high fault tolerance, so your choice will depend on your budget, business and compliance needs:

  • Analytics conducted in the public cloud

Public cloud is the cheapest way to conduct cloud analysis, as infrastructure costs are split among cloud tenants. I recommend you to use a public cloud to handle big data workloads, store huge data sets, and leverage such innovative technologies as machine learning, artificial intelligence, etc.

  • Analytics conducted in the private cloud

In case you seek enhanced control over the IT infrastructure to meet your data compliance or data security objectives, you can opt for private cloud analytics. To allow meeting such particular needs, a private cloud is physically located either at your own data center or at a cloud provider’s site with hardware and software dedicated to your company solely. Naturally, this option is the most expensive one.

  • Analytics conducted in the hybrid cloud

If you cannot afford data analysis fully conducted in the private cloud but still need to meet your data regulatory requirements (HIPAA, GDPR, GLBA, etc.), a hybrid cloud for data analysis will satisfy your demand. By keeping some parts of an analytics solution (for example, a storage of sensitive data) in the private cloud and the rest in the public cloud, you can significantly reduce analytics costs due to cloud computing while staying compliant with internal and external regulations.

The benefits that’ll make you stay in the cloud

cloud analytics benefits

Scalability

The cloud deployment allows you to easily meet your demand in upscaling by simply buying storage and compute resources from the cloud provider whenever you need them. It is a great advantage over hosting your analytics solution on-premises, which implies an expensive upgrade of the existing IT infrastructure in case of demand in additional storage capacity.

Security

Usually, security concerns are the main deterrent for companies to deploy analysis in the cloud. However, I can assure you that such fears are void. These days, leading cloud providers (Microsoft Azure, AWS, Google Cloud Platform) apply advanced security measures to ensure high security level in the cloud. As for security measures that you can take, I advise you to fortify your analytics solution with data encryption, set up admin control, and conduct regular vulnerability assessment and penetration testing.

Data availability

Leading cloud providers guarantee 99.999% of service availability. With high-availability and fault-tolerant systems set up in the cloud, there is near-zero possibility of your analytics solution disruption even in case of unplanned downtimes due to power outages, natural disasters, etc.

Data accessibility

A web-based nature of your data analysis allows delivering insights to any device connected to the internet for you to benefit from them from anywhere and at any time. Additionally, cloud deployment contributes to increased collaboration among colleagues, who can share and view analytics results across a cloud-based analytics platform with the help of self-service software.

Don’t Let Your Company Lose Cloud Benefits!

ScienceSoft’s experts are ready to set up and tune your data analysis in the cloud to help you make the most of your data to gain a competitive advantage.

ScienceSoft’s top 5 of cloud analytics tools

At ScienceSoft, we are sure that cloud analytics software has to connect to multiple data sources, have ample data preparation and visualization capabilities, support advanced analytics, be easily manageable, secure, and much more. So, with these characteristics taken into account, we’ve chosen the top 5 cloud data analytics tools:

Services: Power BI Pro, Power BI Premium, Power BI Mobile, Power BI Embedded, Power BI Report Server.

Key features: Content packs of pre-built dashboards and reports, natural language processing, custom visualization, secure data governance, embedded analytics and collaboration, integration with Microsoft Azure Stream Analytics, support of 5 languages (DAX, Power Query, SQL, R, Python), etc.

Pricing: Power BI Mobile – free, Power BI Pro – $9.99/user/month, Power BI Premium – starting from 4,995/dedicated resources/month.

Demo: Power BI 

Services: Tableau Prep, Tableau Server, Tableau Online, Tableau Data Management, Tableau Server Management, Tableau Mobile, Embedded Analytics.

Key features: Unlimited data connectors, augmented data preparation, real-time access, natural language processing, time series analysis, role-based permissions, embedded dashboards, secure collaboration, etc.

Pricing: Tableau Creator – $70/user/month, Tableau Explorer – $35 or $42/user/month (depending on the deployment model), Tableau Viewer – $15/user/month.

  • Oracle Analytics Cloud (OAC)

Services: Data Visualization Cloud Service, Data Visualization in OAC (any edition), Business Intelligence Cloud Service, Business Intelligence in OAC (Enterprise Edition), Mobile apps Day by Day and Synopsis.

Key features: Self-service data discovery; augmented analytics; natural language processing; analytics dashboards; mobile exploration; integrated data preparation, collaboration, and publishing; governed enterprise analytics; embedded analytics, etc.

Pricing: Pricing is not publicly available.

Services: IBM Cognos Framework Manager, IBM Cognos Cube Designer, IBM Cognos Transformer.

Key features: Built-in data management and data governance features, automated data modeling, natural language-powered AI, etc.

Pricing: On Demand Plan: Standard user – $15/user/month, Plus user – $35/user/month, Premium user – $70/user/month.

Services: Qlik Sense, QlikView, Qlik Analytics Platform

Key Features: Built-in data preparation and integration, drag-and-drop visualizations, smart search feature, real-time analytics and reporting, data storytelling functionality, secure real-time collaboration, etc.

Pricing: Qlik Sense Business – $30/user/month, Qlik Sense Enterprise: Professional User – $70/user/month, Analyzer User – $40/ user/month.

Make the most of your data with cloud analytics!

As data volumes are growing exponentially, I believe that the cloud is the future of data analytics. Cloud analytics implies a quicker time to value, agility, and the pervasive use of analytics across your company, meaning more employees make timely data-driven decisions, which is a vital component of a company’s success.

With all that, deploying and conducting cloud analytics still requires dedicated efforts – starting from choosing the cloud type and cloud provider to setting up and administering analytics software or choosing a reliable vendor in case of analytics as a service. So, if you feel in need of qualified assistance with building, upgrading, supporting or outsourcing your cloud analytics solution, my colleagues at ScienceSoft and me are always ready to share our hand-on data analytics expertise, just let us know.


Are you striving for informed decision-making? We will convert your historical and real-time data into actionable insights and set up forecasting.

Managed IT Services fail mostly due to these 3 reasons


Organizations who opt for managed IT services are likely to tell you that it is a painful task to find vendors, and trust them with their IT ecosystem. Typically, businesses look out for IT vendors who can seamlessly integrate into their system. This may include vendors with

  • Good industry experience
  • Familiarity with the tools

When your organization is facing a resource crunch, and you are under tremendous pressure to ensure that all major workflows are running smoothly- and all you want is to relieve stress. Managed services is an option you would like to consider despite the bitter task of hunting for potential vendors, budget planning, attending multiple meetings etc. If it works out, it is a long-term win. Further, it is a good option when you want to focus all your tech bandwidth on core areas. However, there are a few mistakes that companies generally make that should be avoided at all costs if the dream is to scale the business while not adding to your existing pile of tasks. And they are listed as follows-

Lack of Clarity in Plan Of Action

You might be well aware, but is your team?

Misunderstandings between the vendor and your business exist because it wasn’t clearly discussed under the scope of work. And it is equally important to make sure that everyone including your IT team is aware of the same. The solution is clearly defining your goals, objectives, and scope of the project. This will ensure that both parties are in sync and there will be little confusion or room for micromanagement.

Starting Big

Even if they are a huge corporate entity, always start on a smaller project if possible. This way, it will be easier for you to understand how the vendor functions and if they are the right team to hire for all the future projects of the business. It is difficult to switch vendors in-between crucial, long-term projects.

Knowledge Transfer Gap Within Both Firms

If one person from either one of the parties leaves, how quickly can another team member replace this person and get to speed with the project?

It is a commonly ignored issue that negatively impacts the project in more than one way- slowing down operations and decreasing the productivity of the team. It is a good idea to bring this question up while talking to potential vendors and learn how they handle such issues in advance.

Conclusion

The expectations from managed services vendors are quite high. No business can easily find a vendor who is a great match for them, whom they can trust. However, once they do, they stick to a vendor for a really long time as it is not easy to manage IT processes and IT teams in general, whether in-house or outsourced.

Opting for managed services is an excellent idea under three main circumstances-

  • When you face a tech resource crunch, and all your projects still need to run smoothly
  • When you need to hire a big tech team to develop and maintain a particular IT infrastructure. This increases your overall effort in hiring and training the new resources.
  • When you want to focus only on your core activities and leave IT infrastructure management to a trusted long-term partner.

Keeping the aforementioned points in mind while hunting for managed IT services helps reduce the associated risks to a huge extent.

A Path from Laggards to Leaders


According to the stats, the manufacturing industry is among the laggards in terms of adopting BI tools. Our business intelligence implementation consultants believe that this happens mostly because manufacturers tend to be over-reliant on the capabilities of their ERP systems. Below, we explain why manufacturers should look beyond ERPs by illustrating what they are missing when not bringing BI on board.

business intelligence in manufacturing

Integrating data from disparate systems

ERP systems are powerful, though they are not tailored to analytics. Our team considers ERP as a vital, yet one of many data sources. In terms of data analysis, relying on one data source and disregarding a couple of others can result in misleading insights. We strongly believe that only a BI solution that integrates data from all the manufacturer’s systems and applications, such as ERP, CRM, SCM, and MES, can produce actionable and trustable insights.

Providing rich analysis options

Our BI team also highlights that with the help of a BI solution, manufacturers can analyze both traditional and big data and benefit from all analytics types, including advanced ones. The table below shows more details of how a certain analytics type can contribute to fact-based decision-making:

bi in manufacturing sample insights

Providing insights tailored to users

With the following 3 aspects of BI implementation considered, every employee, be they line workers or top managers, can get the insights they require in a convenient and timely manner:

Dashboards and reports tailored to different user roles

Line supervisors will make use of such KPIs as throughput, yield, and capacity utilization, for the lines they manage. In their turn, plant managers will analyze these values aggregated for all the production lines (with the possibility to drill down to individual lines if required). And top management will benefit from seeing these KPIs aggregated to the level of plants and regions.

Predefined reports and self-service analytics

With an intuitive self-service analysis and visualization tool, users can drill down to the data in search of insights, with no involvement from the IT or the data analytics department. For example, a sales manager can open a predefined report depicting total sales and easily drill down to the sales by product category in a few clicks. And this demo shows how a business user can perform root cause analysis within a couple of minutes.

Historical reports and real-time analytics, including alerts

A BI solution should also meet users’ expectations of the speed of delivering insights. For example, the purchasing department would be fine to get a weekly report on the machinery parts that most frequently go out of order and use this info to adjust the purchasing of spare parts accordingly. And when it comes to a machinery breakdown or a pre-failure condition, real-time analytics is required for a maintenance team, which should be immediately alerted to avoid or, at least, minimize equipment downtime.

So, should we expect BI adoption growth in manufacturing in the future?

We strongly believe that manufacturing will catch up with the current leading industries in BI adoption. Manufacturers just cannot stay aside and miss the opportunities that BI brings thanks to integrated data, rich analysis options, and insights tailored to users. This is especially important when manufacturers serve multiple markets, manage complicated supply chains, and set up transparent, controllable and manageable production processes.


BI expertise since 2005. Full-cycle services to deliver powerful BI solutions with rich analysis options. Iterative development to bring quick wins.