Leveraging AI for Ecommerce Marketing


In our previous blog, we discussed the advantages of implementing AI for businesses. Now it’s time to discuss leveraging AI for Ecommerce marketing in various ways.

AI-driven marketing is a well-accepted mandate for businesses who are digital. According to SalesForce, 84% percent of marketers today are reported to be using AI, a 186% increase in adoption since 2018. So much that AI is being introduced in different forms at different stages of the marketing funnel. There is AI generated content for scaling content generation and SEO ranking as well as advanced AI-powered marketing analytics to target and retain customers .

The need for Hyper-Personalization in 2022

According to a report by McKinsey, over 70% of modern consumers want businesses to deliver personalized experiences to them, and personalization generates 40% more revenue for fast-growing businesses.

This is because customer churn rates, and acquisition rates are also incredibly higher for the businesses who haven’t leveraged AI analytics for enhanced consumer experience, thereby making a strong case for relevant product recommendations using Machine Learning capabilities.

This is where Amazon has excelled over all its competitors with their flagship ecommerce store that provides every user with a tailored experience the moment they enter the app or website (based on their interests and past shopping behavior). Plus, 35% of Amazon’s revenue is generated by its advanced recommendation engine.

No business has to be Amazon to make hyper-personalization work for them but it is crucial that they adopt modern analytics strategy and solutions to aid with fast growth and industry competition.

According to IMARC, a leading market research company, the global e-commerce market reached a value of US$ 13 Trillion in 2021. To penetrate faster and enjoy a good market share would require resolving the most depressing eCommerce challenges like conversions, high customer acquisition costs, high churn rates, among many others. Customer Retention will matter more than ever before.

Customer Sentiment Analysis

The first step is to be prepared, to know your target segment in and out. This helps with audience research, identifying opportunities and scope for improvement for all your products. Customer Sentiment Analysis uses Natural Language Processing (NLP) to scan across the internet and identify customer’s perception and sentiment towards the brand.

Brands use Customer Sentiment Analysis to build new products, improve existing services, audience research, and build better content around their audience. For a more in-depth understanding of how it works, you can read our blog on customer sentiment analysis, here.

AI-powered Recommendation System

We have reasons to believe that in 2023, the demand for real-time hyper personalization may grow exponentially. A result of increasing customer expectations and trend shifts in buying behavior. There are plenty of ways to implement real-time hyper personalization for your business.

The traditional recommendation systems that many e-commerce sites use still rely on collaborative filtering techniques, which use streams of historical customer data to deliver the recommendations. This process is however slowly moving out of trend and being replaced by real-time personalized recommendation engines thanks to the recent developments in the field of AI.

An AI chatbot is another good example of real-time hyper-personalization where AI enables real-time interaction with multiple users, providing them fast, and reliable communication from the brand. This results in increased customer satisfaction and retention.

Dynamic Pricing

Plenty of Ecommerce businesses exploit dynamic pricing techniques that align with their sales strategy. Hospitality, and transport sectors also take advantage of the same. Dynamic pricing is the concept of selling the same product at different price points in response to the shifting market conditions. The process enables businesses to instantly and continually change the prices of their products in real-time. This is why it is also called real-time pricing and is widely used in logistics, the industry most affected by volatile market conditions.

Dynamic pricing is used to strategically sell to different kinds of customers, especially by seasonal planning (holiday pricing, surge in demand pricing etc.), and by product life-cycle. This enables profit maximization and wider market access for the business.

Conclusion

There is a debate that simply refuses to die out. That robots and AI will be responsible for taking over this world. There is a long way to go to ascertain such theories, however, today, AI is somewhat responsible for slowly altering the changing consumer behavior trends taking place globally. Dynamic pricing, hyper-personalization by targeted offers, product recommendations, virtual assistants, chatbots, and other means are definitely working in favor of many organizations. It is in the best interest of e-commerce companies to invest in AI early and stay ahead of the fast-changing trends.

Python Interview questions – Provide an overview of Python.


Estimated reading time: 4 minutes

So you have landed an interview and worked hard at upskilling your Python knowledge. There are going to be some questions about Python and the different aspects of it that you will need to be able to talk about that are not all coding!

Here we discuss some of the key elements that you should be comfortable explaining.

What are the key Features of Python?

In the below screenshot that will feature in our video, if you are asked this question they will help you be able to discuss.

Below I have outlined some of the key benefits you should be comfortable discussing.

It is great as it is open source and well-supported, you will always find an answer to your question somewhere.

Also as it is easy to code and understand, the ability to quickly upskill and deliver some good programs is a massive benefit.

As there are a lot of different platforms out there, it has been adapted to easily work on any with little effort. This is a massive boost to have it used across a number of development environments without too much tweaking.

Finally, some languages need you to compile the application first, Python does not it just runs.

What are the limitations of Python?

While there is a lot of chat about Python, it also comes with some caveats which you should be able to talk to.

One of the first things to discuss is that its speed can inhibit how well an application performs. If you require real-time data and using Python you need to consider how well performance will be inhibited by it.

There are scenarios where an application is written in an older version of code, and you want to introduce new functionality, with a newer version. This could lead to problems of the code not working that currently exists, that needs to be rewritten. As a result, additional programming time may need to be factored in to fix the compatibility issues found.

Finally, As Python uses a lot of memory you need to have it on a computer and or server that can handle the memory requests. This is especially important where the application is been used in real-time and needs to deliver output pretty quickly to the user interface.


What is Python good for?

As detailed below, there are many uses of Python, this is not an exhaustive list I may add.

A common theme for some of the points below is that Python can process data and provide information that you are not aware of which can aid decision-making.

Alternatively, it can also be used as a tool for automating and or predicting the behaviour of the subjects it pertains to, sometimes these may not be obvious, but helps speed up the delivery of certain repetitive tasks.

What are the data types Python support?

Finally below is a list of the data types you should be familiar with, and be able to discuss. Some of these are frequently used.

These come from the Python data types web page itself, so a good reference point if you need to further understand or improve your knowledge.

How to Become a BI-driven Company?


Editor’s note: By investing heavily in data assets without the appropriate strategy, you run the risk of making decisions resulting in unsatisfactory business intelligence ROI. Read on to learn about ScienceSoft’s propriety BI strategy, and check our offer in BI implementation services to learn how we can shoulder your BI project following this approach.

A well-developed BI solution is one of the success factors of a company’s wellbeing. It contributes to enhancing your business by enabling proactive optimization and becoming a BI-driven company. A well-thought-out business intelligence strategy ensures ROI from substantial investments into a BI solution.

According to the 2020 Global State of Enterprise Analytics survey, “only 52% of front-line employees have access to their organization’s data and analytics”, which is a hurdle to data literacy expanse among employees. In this article, we will share how to plan a BI strategy that will lead to the increased data literacy in your company and transform it into a BI-driven enterprise.

Data Warehouse Services

Since 2005, ScienceSoft advises on, develops, migrates, and supports your data warehouse. We can also provide a data warehouse as a service on a subscription fee basis.

Potential value to target with your BI strategy

To benefit from your data, you need to start with the understanding of data potential to solve your business problems. A BI solution implemented following a well-thought-out enables a company to:

  • Improve operational efficiency

You can understand and refine every operational process, creating a potential to drive revenue.

Empowered by advanced analytics, BI software allows assessing risks (be they risks in day-to-day operations or strategic decisions). In manufacturing, for example, it provides the opportunity of forecasting machine breakdowns, consequently reducing operational costs.

  • Create new products/services and enhance customer experience

You can tailor your products and services in accordance with real-time customer data (interactions, transactions, feedback, sentiment, etc.). Thus, by taking customer-centric decisions, you grow your top lines.

Your company is able to identify the opportunities for improvement by studying its competitors’ performance and adopting best practices.

  • Get autonomy for instant decision-making

A self-service BI solution powered with the 4 types of data analytics helps companies quickly react to changing business requirements and operate different business environments without the need to involve IT teams. In our BI demo, you can see how an intuitive interface of a self-service BI solution makes it easy to spot trends and patterns and answer your business questions.

Our proprietary BI strategy maturity model

BI strategy

Drawing on 16 years of experience in BI, ScienceSoft worked out its own approach to developing a BI strategy. Our maturity model allows incrementally reaping the BI benefits, starting from analytics that requires minimum investments and moving towards deeper insights:

  1. Limited ad-hoc optimization

At this stage, a company leverages the acquired data to tune its current processes. Let us set an example here: Company X launches a marketing campaign to increase the sales of a certain product, but it seems to be fruitless. The company needs to learn the reason for that and define what adjustments need to be made.

As a starting point, the company evaluates its data – what data sources are currently available and how the retrieved data can be beneficial. In other words, the company assesses the data in terms of its potential to improve its marketing campaign. The company concurrently ensures data quality by conducting data quality management. Otherwise, low-quality data can totally discredit the company’s attempts. Then, the mix of descriptive and diagnostic analytics is employed to define what exactly is wrong about the marketing campaign and the reasons for such an outcome. When the problem and its root cause are defined, the marketing campaign can be optimized accordingly.

  1. Proactive optimization

At this maturity stage, the strategy presupposes implementing a BI solution that is aimed at gaining new insights to find more elaborate ongoing optimization options. Let us return to the previously mentioned company X, which is about to launch a new marketing campaign. This time, a BI solution empowered by predictive and prescriptive analytics enabled by machine learning capabilities allows the company to tailor its marketing campaign upfront.

  1. Becoming a BI-driven company

The third maturity stage addresses the challenge of delivering insights to the right people at the right time. At this stage, company X employs self-service BI software to grant its business users (according to their user roles) independence to make quick data-driven decisions without the need to involve the IT department. That way, all-level employees can have access to the data relevant to their tasks, which contributes to data literacy expansion among the whole enterprise.

What is your BI strategy going to be?

A business intelligence strategy is a framework that enables gradually reaching the following business objectives: optimizing current business processes, creating top-notch products and services and becoming a data-driven business.

Do you want to improve the decision-making process through business intelligence? Turn to ScienceSoft to get your own roadmap to success.

I want a BI strategy


BI expertise since 2005. Full-cycle services to deliver powerful BI solutions with rich analysis options. Iterative development to bring quick wins.

Data ingestion using Snowpipe and AWS Glue


Introduction

In today’s world that is largely data-driven, organizations depend on data for their success and survival, and therefore need robust, scalable data architecture to handle their data needs. This typically requires a data warehouse for analytics needs that is able to ingest and handle real time data of huge volumes.

Snowflake is a cloud-native platform that eliminates the need for separate data warehouses, data lakes, and data marts allowing secure data sharing across the organization. For this reason, Snowflake is often the cloud-native data warehouse of choice. With Snowflake, organizations get the simplicity of data management with the power of scaled-out data and distributed processing.

Snowflake is built on top of the Amazon Web Services, Microsoft Azure, and Google cloud infrastructure. There’s no hardware or software to select, install, configure, or manage, and that makes it ideal for organizations that do not want to dedicate resources for setup, maintenance, and support of in-house servers.

What also sets Snowflake apart is its architecture and data sharing capabilities. The Snowflake architecture allows storage and compute to scale independently, so customers can use and pay for storage and computation separately. And the sharing functionality makes it easy for organizations to quickly share governed and secure data in real time.

Using Snowpipe for data ingestion to AWS

Although Snowflake is great at querying massive amounts of data, the database still needs to ingest this data. Data ingestion must be performant to handle large amounts of data., and without that, you run the risk of querying outdated values and returning irrelevant analytics.

Snowflake provides a couple of ways to load data. The first, bulk loading, loads data from files in cloud storage or a local machine. Then it stages them into a Snowflake cloud storage location. Once the files are staged, the “COPY” command loads the data into a specified table. Bulk loading relies on user-specified virtual warehouses that must be sized appropriately to accommodate the expected load.
The second method for loading a Snowflake warehouse uses Snowpipe. Snowpipe continuously loads small data batches and incrementally makes them available for data analysis. Snowpipe loads data within minutes of its ingestion and availability in the staging area. This provides the user with the latest results as soon as the data is available.

Limitations in using Snowpipe

While Snowpipe provides a data ingestion method that is continuous, its limitation is that it is not real-time. Data might not be available for querying until minutes after it’s staged. Throughput can also be an issue with Snowpipe. The writes queue up if too much data is pushed through at one time.

Import Delays

When Snowpipe imports data, it can take minutes to show up in the database and be visible. This is too slow for certain types of analytics, especially when near real-time is required. Snowpipe data ingestion might be too slow for three use categories: real-time personalization, operational analytics, and security.

Real-Time Personalization

Many online businesses employ some level of personalization today. Using minutes- and seconds-old data for real-time personalization can significantly grow user engagement. And that could be hindered by Snowpipe’s limitations in that area.

Operational Analytics

Applications such as e-commerce, gaming, and the Internet of things (IoT) commonly require real-time views of what’s happening. This enables the operations staff to react quickly to situations unfolding in real time. Lack of real-time data using Snowpipe would affect this.

Security

Data applications providing security and fraud detection need to react to streams of data in near real-time. This way, they can provide protective measures immediately if the situation warrants. These could be impacted when Snowpipe is used.

Throughput Limitations

A Snowflake data warehouse can only handle a limited number of simultaneous file imports. You can create 1 to 99 parallel threads. But too many threads can lead to too much context switching. This slows performance. Another issue is that, depending on the file size, the threads may split the file instead of loading multiple files at once. So, parallelism is not guaranteed.

Workarounds prove expensive

To overcome the limitations of speed, you can speed up Snowpipe data ingestion by writing smaller files to your data lake. Chunking a large file into smaller ones allows Snowflake to process each file much quicker. This makes the data available sooner.

Smaller files trigger cloud notifications more often, which prompts Snowpipe to process the data more frequently. This may reduce import latency to as low as 30 seconds. This is enough for some, but not all, use cases. This latency reduction is not guaranteed and can increase Snowpipe costs as more file ingestions are triggered.

One way to improve throughput is to expand your Snowflake cluster. Upgrading to a larger Snowflake warehouse can improve throughput when importing thousands of files simultaneously. But, this again comes at a significantly increased cost.

AWS Glue to Snowflake ingestion

In any data warehouse implementation, customers take an approach of either extraction, transformation, and load (ETL) or extraction, load, and transformation (ELT), where data processing is pushed to the database. For either method, you could either use a hand-coded method or leverage any number of the available ETL or ELT data integration tools.

However, with AWS Glue, Snowflake customers now have a simple option to manage their programmatic data integration processes without worrying about servers, Spark clusters, or the ongoing maintenance traditionally associated with these systems.

AWS Glue provides a fully managed environment that integrates easily with Snowflake’s data warehouse as a service. . With this, developers now have an option to more easily build and manage their data preparation and loading processes with generated code that is customizable, reusable, and portable with no infrastructure to buy, set up, or manage.

Together, these two solutions enable customers to manage their data ingestion and transformation pipelines with more ease and flexibility than ever before.

With AWS Glue and Snowflake, customers get the added benefit of Snowflake’s query pushdown, which automatically pushes Spark workloads, translated to SQL, into Snowflake. Customers can focus on writing their code and instrumenting their pipelines without having to worry about optimizing Spark performance. With AWS Glue and Snowflake, customers can reap the benefits of optimized ELT processing that is low cost and easy to use and maintain.

Conclusion

Snowflake’s scalable relational database is cloud-native. It can ingest large amounts of data by either loading it on demand or automatically as it becomes available via Snowpipe.

Unfortunately, in cases where real-time or near real-time data is important, Snowpipe has limitations. If you have large amounts of data to ingest, you can increase your Snowpipe compute or Snowflake cluster size, but at additional cost.

AWS Glue and Snowflake make it easy to get started and manage your programmatic data integration processes. AWS Glue can be used standalone or in conjunction with a data integration tool without adding significant overhead. With AWS Glue and Snowflake, customers get a fully managed, fully optimized platform to support a wide range of custom data integration requirements.

Python Dictionary Interview Questions – Data Analytics Ireland


Estimated reading time: 6 minutes

In our first video on python interview questions we discussed some of the high-level questions you may be asked in an interview.

In this post, we will discuss interview questions about python dictionaries.

So what are Python dictionaries and their properties?

First of all, they are mutable, meaning they can be changed, please read on to see examples.

As a result, you can add or take away key-value pairs as you see fit.

Also, key names can be changed.

One of the other properties that should be noted is that they are case-sensitive, meaning the same key name can exist if it is in different caps.

As can be seen below, the process is straightforward, you just declare a variable equal to two curly brackets, and hey presto you are up and running.

An alternative is to declare a variable equal to dict(), and in an instance, you have an empty dictionary.

The below block of code should be a good example of how to do this:

# How do you create an empty dictionary?
empty_dict1 = {}
empty_dict2 = dict()
print(empty_dict1)
print(empty_dict2)
print(type(empty_dict1))
print(type(empty_dict2))

Output:
{}
{}
<class 'dict'>
<class 'dict'>

If you want to add values to your Python dictionary, there are several ways possible, the below code, can help you get a better idea:

#How do add values to a python dictionary
empty_dict1 = {}
empty_dict2 = dict()

empty_dict1['Key1'] = '1'
empty_dict1['Key2'] = '2'
print(empty_dict1)

#Example1 - #Appending values to a python dictionary
empty_dict1.update({'key3': '3'})
print(empty_dict1)

#Example2 - Use an if statement
if "key4" not in empty_dict1:
    empty_dict1["key4"] = '4'
else:
    print("Key exists, so not added")
print(empty_dict1)

Output:
{'Key1': '1', 'Key2': '2'}
{'Key1': '1', 'Key2': '2', 'key3': '3'}
{'Key1': '1', 'Key2': '2', 'key3': '3', 'key4': '4'}

One of the properties of dictionaries is that they are unordered, as a result, if it is large finding what you need may take a bit.

Luckily Python has provided the ability to sort as follows:

#How to sort a python dictionary?
empty_dict1 = {}

empty_dict1['Key2'] = '2'
empty_dict1['Key1'] = '1'
empty_dict1['Key3'] = '3'
print("Your unsorted by key dictionary is:",empty_dict1)
print("Your sorted by key dictionary is:",dict(sorted(empty_dict1.items())))

#OR - use list comprehension
d = {a:b for a, b in enumerate(empty_dict1.values())}
print(d)
d["Key2"] = d.pop(0) #replaces 0 with Key2
d["Key1"] = d.pop(1) #replaces 1 with Key1
d["Key3"] = d.pop(2) #replaces 2 with Key3
print(d)
print(dict(sorted(d.items())))

Output:
Your unsorted by key dictionary is: {'Key2': '2', 'Key1': '1', 'Key3': '3'}
Your sorted by key dictionary is: {'Key1': '1', 'Key2': '2', 'Key3': '3'}
{0: '2', 1: '1', 2: '3'}
{'Key2': '2', 'Key1': '1', 'Key3': '3'}
{'Key1': '1', 'Key2': '2', 'Key3': '3'}

How do you delete a key from a Python dictionary?

From time to time certain keys may not be required anymore. In this scenario, you will need to delete them. In doing this you also delete the value associated with the key.

#How do you delete a key from a dictionary?
empty_dict1 = {}

empty_dict1['Key2'] = '2'
empty_dict1['Key1'] = '1'
empty_dict1['Key3'] = '3'
print(empty_dict1)

#1. Use the pop function
empty_dict1.pop('Key1')
print(empty_dict1)

#2. Use Del

del empty_dict1["Key2"]
print(empty_dict1)

#3. Use dict.clear()
empty_dict1.clear() # Removes everything from the dictionary.
print(empty_dict1)

Output:
{'Key2': '2', 'Key1': '1', 'Key3': '3'}
{'Key2': '2', 'Key3': '3'}
{'Key3': '3'}
{}

How do you delete more than one key from a Python dictionary?

Sometimes you may need to remove multiple keys and their values. Using the above code repeatedly may not be the most efficient way to achieve this.

To help with this Python has provided a number of ways to achieve this as follows:

#How do you delete more than one key from a dictionary
#1. Create a list to lookup against
empty_dict1 = {}

empty_dict1['Key2'] = '2'
empty_dict1['Key1'] = '1'
empty_dict1['Key3'] = '3'
empty_dict1['Key4'] = '4'
empty_dict1['Key5'] = '5'
empty_dict1['Key6'] = '6'

print(empty_dict1)

dictionary_remove = ["Key5","Key6"] # Lookup list

#1. Use the pop method

for key in dictionary_remove:
  empty_dict1.pop(key)
print(empty_dict1)

#2 Use the del method
dictionary_remove = ["Key3","Key4"]
for key in dictionary_remove:
  del empty_dict1[key]
print(empty_dict1)

How do you change the name of a key in a Python dictionary?

There are going to be scenarios where the key names are not the right names you need, as a result, they will need to be changed.

It should be noted that when changing the key names, the new name should not already exist.

Below are some examples that will show you the different ways this can be acheived.

# How do you change the name of a key in a dictionary
#1. Create a new key , remove the old key, but keep the old key value

# create a dictionary
European_countries = {
    "Ireland": "Dublin",
    "France": "Paris",
    "UK": "London"
}
print(European_countries)
#1. rename key in dictionary
European_countries["United Kingdom"] = European_countries.pop("UK")
# display the dictionary
print(European_countries)

#2. Use zip to change the values

European_countries = {
    "Ireland": "Dublin",
    "France": "Paris",
    "United Kingdom": "London"
}

update_elements=['IRE','FR','UK']

new_dict=dict(zip(update_elements,list(European_countries.values())))

print(new_dict)

Output:
{'Ireland': 'Dublin', 'France': 'Paris', 'UK': 'London'}
{'Ireland': 'Dublin', 'France': 'Paris', 'United Kingdom': 'London'}
{'IRE': 'Dublin', 'FR': 'Paris', 'UK': 'London'}

How do you get the min and max key and values in a Python dictionary?

Finally, you may have a large dictionary and need to see the boundaries and or limits of the values contained within it.

In the below code, some examples of what you can talk through should help explain your knowledge.

#How do you get the min and max keys and values in a dictionary?
dict_values = {"First": 1,"Second": 2,"Third": 3}

#1. Get the minimum value and its associated key
minimum = min(dict_values.values())
print("The minimum value is:",minimum)
minimum_key = min(dict_values.items())
print(minimum_key)

#2. Get the maximum value and its associated key
maximum = max(dict_values.values())
print("The maximum value is:",maximum)
maximum_key = max(dict_values.items())
print(maximum_key)

#3. Get the min and the max key
minimum = min(dict_values.keys())
print("The minimum key is:",minimum)

#2. Get the maximum value and its associated key
maximum = max(dict_values.keys())
print("The maximum key is:",maximum)

Output:
The minimum value is: 1
('First', 1)
The maximum value is: 3
('Third', 3)
The minimum key is: First
The maximum key is: Third

Healthcare Data Analytics: Features, Costs, and ROI


Healthcare analytics solutions with advanced clinical decision support features may be classified as Software as a Medical Device (SaMD). For instance, this applies to software that enables remote control over wearable medical devices (e.g., an infusion pump or an implantable neuromuscular stimulator), provides AI-powered interpretation of medical images and test results, or sends alerts on patients’ states for potential clinical intervention. Since such software can directly affect patients and significantly influence treatment-related decisions, it must comply with IEC 62304:2006/Amd 1:2015 and ISO 13485 standards and requires FDA approval. To make sure our customers have flexibility in choosing their healthcare analytics features, ScienceSoft invests heavily in our expertise with the above regulations. We are ready to appoint relevant compliance experts to guarantee the future software adheres to all the requirements no matter how strict they are.

Limitations and challenges of Informatica cloud


Introduction

Informatica is a data integration tool based on ETL architecture. It provides data integration software and services for various businesses, industries and government organizations including telecommunication, health care, financial and insurance services.

Informatica uses the Extract, Transform & Load (ETL) architecture which is the most popular architecture to perform data integration. Once the Source system is connected and the source data being captured, Informatica supports several out of the box transformations.

Application of Informatica tool

Informatica is used for a variety of use cases. Some of these are listed below.

Informatica tool for Data Migration:

The company uses it to transfer from the current legacy system, such as the mainframe to the latest database system. Consequently, the transfer of its existent data into the system could be carried out. For example, a company purchases a new accounts payable application. PowerCenter can move the existing account data to the new application. Informatica preserves data lineage for tax, accounting, and other legally mandated purposes

Informatica tool for Application Integration:

The assimilation of information from several different systems, such as numerous databases and system based on files could be completed utilizing Informatica. For example, company A purchases Company B. So to achieve the benefits of consolidation, Company B’s billing system must be integrated into Company A’s billing system which can be easily done by Informatica

Informatica tool for Data Warehousing:

Companies establishing their warehouses of data will need ETL to transfer the data to the warehouse from the Production system. Typical actions required in data warehouses are:

  • Data warehouses put information from many sources together for analysis
  • Data is moved from many databases to the Data warehouse
  • All the above typical cases can be easily performed using Informatica

Informatica tool for Middleware:

Informatica can connect a variety of sources, including most of the Application Sources.

  • SAP certified Data Integration tool
  • Can pull and push data into SAP R3, SAP BW systems
  • Have connectivity adapter for majority of the Application Sources
  • It can also be used as middleware between two applications like SAP R3, SAP BW etc.

It could be utilized as a tool for cleansing data.

Challenges with Informatica cloud platform

Informatica comes in on-premise as well as cloud versions. Informatica Cloud is a data integration solution and platform that works Software as a Service (SaaS). Informatica Cloud can connect to on-premises, cloud-based applications, databases, flat files, file feeds, and even social networking sites.

Informatica Cloud Data Integration is the cloud-based Power Center, which delivers accessible, trusted, and secure data to facilitate more valuable business decisions. Informatica Cloud Data Integration can help the organization with global, distributed data warehouse and analytics projects.

Informatica supports serverless deployments using Amazon EMR, Microsoft Azure HDInsight, and Databricks clusters with data engineering products. Once a developer builds mappings using Informatica Data Engineering Integration, customers have an option to run mappings in an existing cluster for on-premises deployment or serverless using the cluster auto-deployment option

The cloud version of the tool, however, has its limitations and challenges.

  • Setting up and configuring Informatica over cloud – Setting up Informatica and integrating with existing services can be a challenge. It can still take a considerable amount of time and effort to get Informatica up and running.
  • Tool management – Informatica over time has built a vast array of tools to address various user needs. However, as the number of tools grows, there is a need to add more and more physical servers. On the other hand, the other similar tools in the market function very well in the cloud environment. This does not bode well for the future looking at all the newer technologies which do not have so much of tech burden
  • Multiple tools for single workflow – Most new tools have a great cloud version where you can hop onto a URL, do your work and deploy it in minutes. With Informatica, you still have multiple client tools just to be able to deploy a single workflow and monitor as it runs. This can be both confusing and overwhelming to users.
  • Using Informatica PowerCenter for ETL designing – This can be quite intuitive for basic to moderately complex workflows. However, for achieving advanced tasks, there is not sufficient documentation available
  • Cost of handling servers – Similar tools from Amazon, Microsoft, Google have advantages where the user can create and upload code, which can be automatically executed in a serverless manner where you no longer need to worry about managing servers, services, and infrastructure. All of that is handled automatically. But with Informatica, this is a decided disadvantage – the addition of physical servers escalates the cost of implementation.
  • Updates and maintenance – Informatica Cloud architecture, the Secure Agent is a lightweight program. And it is used to connect on-premise data with cloud applications. It is installed on a local machine and processes data locally and securely under the enterprise firewall. All upgrades and updates are automatically sent and installed on the Secure Agent regularly.

Overcoming the Informatica Cloud Challenges

With the challenges of constant updates and therefore maintenance, the cost of handling servers and various tools, and the risks involved in large data handling, Informatica Intelligent Cloud Services (IICS) provides some solutions and workarounds to these challenges.

IICS eliminates the need for constant upgrades because Informatica performs them as new software releases become available.

As a cloud-native platform, IICS makes it easy to explore and try new capabilities and services, rather than requiring the users to install new software versions in their on-premises environments.

The challenge of setup and configuration time can be solved through the use of bulk data ingestion. With IICS, you can use a modern data warehouse practice of bulk ingesting data as-is into the landing layer. You can then apply transformation and curation logic afterward. This results in a three times faster load due to mass ingestion efficiencies and faster processing with push-down optimization (PDO), leveraging the native system commands and limiting data movement.

Conclusion

Informatica is a popular online tool for data management and migration. On the positive side, it is cost-effective and user friendly. However, unlike its peers, it does not have a serverless option. While the Informatica cloud version exists, it has lesser features compared to the on-premise version. Moreover, with large scale implementation, there would be a need for more physical servers over time. This makes it a less favourable choice as compared to its alternatives that provide more options and agility while on cloud.

Also Read:

Case Study: Data Migration From Informatica On-Premise to Informatica Cloud
Case Study: Data Integration Between Casino Properties using Informatica Intelligent Cloud Services

How To Create An Empty Dictionary In Python


Estimated reading time: 2 minutes

In our recent video Python dictionary interview questions, we discussed a number of topics around Python dictionaries .

Here we will discuss how to create an empty dictionary.

In the below code, you will see there are two ways to create:

  1. Use a variable that is equal to empty curly brackets
  2. Just make an empty variable equal to the dict() function.
  3. Use the key/values in a list.
  4. Use a function
  5. Use List comprehension

Creating empty dictionaries has many benefits as you can manipulate them as they are mutable.

Also, they can grow and shrink as you need, you just need to make sure that any new key you add is unique and not already stored in the dictionary.

Another thing to note about them is that they are unordered.

Finally, if you are adding data to a dictionary, the keys are case-sensitive, so the same key can exist in the dictionary, but it has to be different regards the case applied to it.

## How do you create an empty dictionary?
# empty_dict1 = {}
# empty_dict2 = dict()
# print(empty_dict1)
# print(empty_dict2)
# print(type(empty_dict1))
# print(type(empty_dict2))

#Use Keys,values in lists
# list_keys = []
# List_values = []
#
# n = dict(zip(list_keys, List_values))
# print(n)
# print(type(n))

# Note using Zip just allows you to iterate over two lists in parallel  , and the output is a set of pairs


##Use a function ##
#
# def create_dictionary():
#     d = {}
#     print(d)
#     print(type(d))
#
# create_dictionary()


##Use list comprehension##
# loop_list = []
# d = { i: j for i, j in enumerate(loop_list)}
# print(d)
# print(type(d))


Patient engagement analytics: It’s measurable!


Patient engagement is regularly perceived as an abstract concept, which can be somehow improved by distant care technologies, such as patient portals and mHealth applications. However, as long as this concept keeps its abstract nature, it is challenging to get the actionable information on how much patients are engaged and if there’s growth or decrease of their involvement level over time. It is also difficult to evaluate the impact of separate channels that are used to engage patients.

Of course, this situation cannot satisfy healthcare providers on their way to value-based care delivery, where patient engagement plays a significant role.

Hopefully, there’s nothing unmeasurable in the healthcare data analytics world. Providers can transform the abstract concept into a measurable value that will assist them in fact-based decision making, allowing to elicit the effective channels, understand what triggers patients’ attention and see the real picture of patient engagement. Let’s see how it can be done.

Guidelines for measuring patient engagement

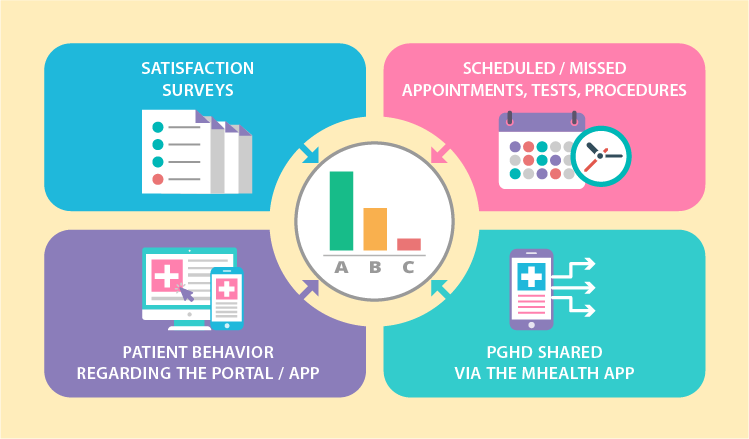
To equip healthcare providers with valuable insights on patient engagement levels, data analytics needs to harness the following 4 information flows:

  • Satisfaction surveys
  • Scheduled / missed appointments, tests, procedures
  • Patient behavior regarding the portal / app
  • PGHD shared via the mHealth app

By analyzing each flow separately as well as in combination, it is possible to range patients according to their level of involvement. For example, it can be an ABC rating, where patients with maximum engagement levels form the ‘A’ group. Accordingly, underengaged patients hit into ‘B’ and ‘C’. We came up with the following options for ranging patients.

Note: Where no particular values are advised in the examples below, the measures may vary according to a particular healthcare organization and its patients.

The frequency of patient portal logging in / mobile app launching

Patient engagement levels

Applicable to all patient groups. Here, the estimated values for groups ‘A’ and ‘B’ overlap as the target frequency may change depending on a provider.

  • ‘A’: high frequency – a few times a day, daily or weekly
  • ‘B’: medium frequency – daily, weekly, monthly
  • ‘C’: low or no frequency – rare, down to a few times a year

The scope of patient portal / mobile app features used

Applicable to all patient groups. This criterion is useful to highlight the interests of relatively healthy patients, define the services they can benefit from and reach out to them via the app or the portal they use. Depending on the available functionality, the feature scope can include vitals and medication tracking, calorie counter, treatment goal setting, rehabilitation (physical, pulmonary, post-surgery and more) support, etc. It’s estimated that an app or a portal contains several feature scopes, and each one is evaluated separately.

  • ‘A’: high use
  • ‘B’: medium
  • ‘C’: low or none

The percentage of completed appointments

Applicable to all patient groups.

  • ‘A’: 80 – 100% of completed appointments
  • ‘B’: 60 – 80% of completed appointments
  • ‘C’: less than 60% of completed appointments

Attendance of recommended follow-up appointments

Applicable to all patient groups. This criterion shows how engaged a patient is according to his or her attitude to follow-up appointments, for example, when a physician recommends an individual to come back every 6 months for a regular checkup.

  • ‘A’: 70 – 100% of recommended appointments are completed within 1-2 months from the planned date
  • ‘B’: less than 70% are completed within 1-2 months
  • ‘C’: less than 30% are completed within 1-2 months

PGHD sharing

Recommended for chronic and post-operative patients. There is also a possibility to pick one target PGHD measure for a certain disease (the blood glucose level for diabetes, SpO2 for COPD).

  • ‘A’: sharing is regular. The target frequency should be individually configured for particular patient groups. For example, patients with diabetes can share their blood glucose a few times a day, while COPD patients will share their oximetry results once or twice a week.
  • ‘B’: inconsistent sharing, some gaps in measurements (interrupted measurements, incomplete data, systematic errors, etc.).
  • ‘C’: patient makes significant gaps in measurements, which interfere with the adequate health status evaluation.

Adherence to the medication plan

Applicable to patient groups with treatment plans and medication intake schemes delivered via a mobile app or a portal. However, it is recommended to track medication intake via an app with a preset medication timer.

  • ‘A’: 80 – 100% of prescribed medications is taken within the day
  • ‘B’: 50 – 80% of medications is taken within the day
  • ‘C’: less than 50% of medications is taken within the day

Evaluation of physical activities

Applicable to all patient groups. We suggest setting different and sometimes even individual activity targets for patients with certain conditions. A physical activity can be evaluated via data flows from a smartphone’s default pedometer as well as wearables connected to the mobile patient app.

  • ‘A’: a patient’s actual physical activity is 70 – 100>% of the target
  • ‘B’: the actual activity is 50 – 70% of the target
  • ‘C’: less than 50% of the target

Survey participation ratio

Applicable to all patient groups. Individuals can receive various surveys to fill in, and the topics can vary as well. Therefore, we suggest not to focus on particular figures but rather go for the ratio of completed-to-received surveys.

  • ‘A’: a patient completes 60 – 100% of the surveys received in the last 12 months
  • ‘B’: a patient completes 30 – 60% of the surveys received in the last 12 months
  • ‘C’: a patient completes less than 30%  of the surveys received in the last 12 months

Dimensions to segment patients

We mentioned that patient engagement is rooted in personal connections, but it is also affected by an array of different events that individuals undergo daily. While it is impossible to track all events, healthcare providers can turn to information they already have and tie level of patient involvement with patients’ health profiles and clinical data. The process of tying should be also carried out by healthcare data analytics system.

To facilitate the process of creating patient segments that can be used to correlate with patient engagement, we came up with a few possible dimensions. In this concept, all the dimensions are equally important. They can be used together, separately or in different combinations, so that providers could go with wider segments or narrow them down.

Patient segmentation

Facility

Depending on a health organization’s size, patients can receive services across different facilities and locations. It can be useful to elicit the areas where patients lack engagement and then fix the situation.

Example 1. Outpatient facilities:

  • Oklahoma City, OK
  • Stillwater, OK
  • Edmond, OK and more

Example 2. Inpatient facilities:

  • Boston, MA
  • Worcester, MA
  • Springfield, MA and more

Example 3. Hospitals, clinics, other facilities:

  • Louisville, KY
  • Indianapolis, IN
  • Fort Wayne, IN and more

Therapeutic departments

As departments vary among health organizations, the list will be tailored to a particular provider. Patients can be filtered down to a one department or a few at once. For example, patients with COPD and heart problems can receive service in both pulmonology and cardiology departments.

  • Cardiology
  • Endocrinology
  • Gastroenterology
  • Ophthalmology
  • Pulmonology
  • Orthopedics
  • ENT and more

Disease status

Providers can either combine the ‘disease status’ with ‘therapeutic departments’ criteria sets or use them separately. In this set there are multiple dimensions that aren’t necessarily sufficient for the clinical-only purpose, yet they still help providers to either narrow or widen the target group. Again, each set of criteria can and should be adjusted according to provider.

Disease status:

  • acute
  • subacute
  • chronic (each section can be drilled down to specific conditions, pathologies, disorders, etc.)

Comorbidities:

  • yes (can be filtered to a list of particular diseases)
  • no

Outcomes:

  • recovery
  • complications / exacerbations (can be filtered to a particular negative outcome)

Disabilities:

  • yes (can be filtered to a specific disability)
  • no

The need for systematic supervision:

  • yes (then the list of exact supervision types, e.g. regular follow-up appointments or home care, can be provided)
  • no

Gender / Age

The following structure of basic demographics is built by revising the Erikson’s stages of human development along with Daniel Levinson’s and Carl Jung’s theories altogether. These multiple sources hold a bit different approaches, so our outcome here is aimed to aggregate various opinions, reflect both psychological and physical development, and allow healthcare providers to narrow down the patient segments to work with.

Adults:

Woman / Man:

Binding patient engagement levels to dimensions: Opportunities

The possibilities of measuring patient engagement and tying it to different dimensions of patient health profile are exciting. Let’s review a few of them.

For example, if providers want to spot the most effective channel (app vs. portal) for involving patients, they can compare equal dimensions from the list presented above, such as frequency of patient portal logging in and mobile app launching within their ‘A’-level group. They can also apply these measures to a particular facility or through departments, because this can show preferences among patients with different conditions. Each new criteria set added makes data analytics more complex and elicits new insights that can be further applied to enhancing care delivery and improving patients’ health outcomes.

Speaking of outcomes, when providers elaborate on significant measures for health outcomes analytics (such as life quality, exacerbation rates, blood pressure control and more) under CMS reporting policy or for internal performance evaluation, it also becomes possible to track multiple dependencies. While it seems logical that higher patient engagement equals in better health outcomes, results might be surprising, and they can give a hint on areas for further improvement.

Being a king when kingdom comes

Let’s look at the bigger picture. Value-based care replaces FFS reality little by little. While programs and models that are aimed to ease up the transition (such as ACOs), still use FFS payments, their goal is to keep patients healthy, prevent exacerbations, admissions, readmissions and improve patient health outcomes. And patient engagement is a strong link in this chain, especially when it is measured. 

Accordingly, analyzing patient engagement and integrating it with other healthcare data analytics dimensions providers already use means taking the lead and reaping the subsequent benefits ahead of the competition. 


Medical Data Analytics and Consulting by ScienceSoft

Analytics turns medical data into a treasure trove. Don’t miss a chance to boost patient satisfaction, optimize costs and improve internal processes.

Leverage Machine Learning for AML


Anti-Money Laundering (AML) is increasingly becoming a crucial branch of risk management and fraud prevention. AML regulations and procedures help organizations identify, monitor, and report suspicious transactions and provide an additional layer of protection against financial crime.

Money laundering is a serious threat in the financial services industry and in the online gaming and casino industry. In fact, online casinos as an industry carries the biggest risk of money laundering. Global consultancy firm, Deloitte, estimates that the amount of money laundered globally in one year is in the range of US$800 billion to US $2 trillion.[1]

With the rise of Big Data in today’s world, Machine Learning (ML) is popularly used to identify, assess, and monitor financial risks as well as detect various suspicious activities and transactions. It helps to protect organizations from financial losses, reputational damage, and regulatory penalties.

How Machine Learning Helps Detect and Prevent AML

ML algorithms identify patterns in customer behavior which could point to money laundering activities, monitor customer behavior for any sudden changes in spending patterns, any suspicious account activities, and other potential indicators of fraud.

There are primarily two underlying techniques that can be leveraged for AML initiatives- Exploratory Data Analysis and Predictive analytics.

Exploratory Data Analysis (EDA)

EDA is used to analyze data and summarize their main properties and characteristics using visual techniques. Widely used to discover trends, patterns, check assumptions and spot anomalies or outliers, EDA involves a variety of techniques including statistical analysis, and machine learning to gain a better understanding of data.
In this case, once a customer’s documents are scanned and uploaded, the necessary data is extracted from the key documents and then converted to machine-readable form. An automated process is then developed for swift verification. Thus, speeding up the entire process with minimal error.

EDA might be used to identify any unusual patterns or trends in the customer’s financial records, or to identify any connection or relationship with other entities that may be of concern. EDA can also be used to detect anomalies and inconsistencies in the data that may suggest that the client is providing fraudulent or misleading information.

The underlying technology used to convert the scanned image to machine readable format is called ‘Optical Character Recognition’ (OCR) or text recognition analysis. OCR is widely used to digitize all kinds of physical documentation.

Predictive Analytics

It is a subset of business analytics that uses statistical techniques (algorithms) to find patterns in historical data points and predict future outcomes with high accuracy. For predictive analytics to deliver high accuracy, a lot depends on the combination of domain knowledge and technical expertise. With the exponential growth of large datasets, predictive analytics is being leveraged by enterprises across industries. Predictive Analytics can help businesses in reducing risk (eg. Credit Risk Analysis) maximizing opportunities (predicting Customer LifeTime Value) and improving operational efficiencies (eg. optimizing inventory) by identifying trends and gathering insights from large volumes of data.

Different Use-cases of ML for AML initiatives

Automating ‘Know Your Customer’ (KYC) processes:

KYC process helps to identify customers, verify their identity and assess their risk of being involved in money laundering by understanding the nature of customers’ activities and validating their source of funds as legitimate. The process involves verifying customer data against various sources manually. Under AI supervision, the algorithm automatically flags suspicious users.

Automated transaction monitoring and risk assessment of customers:

Automated transaction monitoring systems use machine learning algorithms to detect suspicious activity in customer transactions and alert organizations to any potential money laundering activities. The algorithms can detect anomalies in the transactional data and helps to identify high-risk customers and transactions that may be linked to money laundering activities.

Predictive modeling for flagging suspicious activity

Predictive analytics can be used to analyze past customer behavior and transactions to identify patterns that may indicate potential money laundering activity. By leveraging predictive analytics, organizations can proactively identify and prevent money laundering before it occurs. Money dumping or poker chip dumping is a frequent form of money laundering witnessed in online casinos and poker sites that depend on predictive analytics to detect any suspicious activity.

Steps to building a highly accurate predictive model for AML

It is now easier than ever to deploy ML solutions thanks to the recent chain of innovations introduced by major industry players like AWS and Microsoft. There are a number of open-source ML platforms like KNIME that can also be leveraged to detect and predict suspicious behavior.

Building a predictive model is a continuous process and commitment. Each step is extremely important and demands a lot of attention from data scientists. These include-

Data Cleansing and Refinement:

A key step in the predictive modeling process involves assessing the quality and usefulness of existing data in terms of missing values, outliers and other anomalies. This not only helps you avoid reporting invalid results down the line but also forms a crucial step in building a solid foundation for your predictions.

Feature Engineering:

For predictive analytics to deliver high accuracy, a lot depends on domain knowledge and expertise. Feature engineering is the process of using domain knowledge of the data to create attributes that make machine learning algorithms work. The process involves selecting and creating attributes that are relevant for the specific problem. This may include combining variables, creating new variables based on existing ones, and scaling the data.

Model Selection:

A good model selection is one of the most critical steps in predictive analytics. This could include supervised learning models such as random forests, decision trees, and support vector machines, or unsupervised learning models such as clustering algorithms. It is important to review how well each possible model fits with your data before making predictive model selection choices.

Model Training:

The selected model is trained on a dataset and subsequently validated and tested before being deployed. The process includes using cross-validation to optimize the model’s performance, and parameter tuning to adjust the model’s hyperparameters. How well a model performs during training will determine how well it will perform when it is implemented in an application for end users. Hence, optimizing the model is necessary to increase the accuracy and efficiency of the model.

Model Deployment:

Deploy the model in production and monitor its performance. This could include deploying the model to an API or web service, and setting up an alert system to monitor the model’s performance. This is not the final step.

Refine the model:

Machine learning applications require meticulous attention to optimize an algorithm. Refine the models based on feedback from users and performance data to ensure that the models are accurate and reliable. This is a continuous cycle as customer behavior is known to keep evolving at a fast pace and it is necessary to keep identifying inefficiencies in the algorithm.

To conclude:

To combat money laundering and avoid being scrutinized by regulators, organizations must

  • Establish clear policies and procedures to flag suspicious customer activity. This includes customer due diligence, continous risk assessments, defining responsibility of the employees and senior managemen among others
  • Monitor customer activity across multiple channels to ensure that all transactions are legitimate including tracking customer activity on online banking, mobile banking, credit card, and other payment methods.
  • Encourage customers to report any suspicious activity. Make sure you have processes in place for customers to quickly and easily report any suspicious activity they may have noticed.
  • Provide suspicious activity reports to relevant authorities to ensure that money laundering activities are reported and investigated.
  • Stay up to date with regulations: Stay up to date with the latest regulations and security measures to ensure that your customers’ data is protected.
  • And keep refining and revisiting the algorithms and models for optimal efficiency.

REFERENCES

[1] Anti-Money Laundering Preparedness Survey Report 2020: