How To Create An Empty Dictionary In Python


Estimated reading time: 2 minutes

In our recent video Python dictionary interview questions, we discussed a number of topics around Python dictionaries .

Here we will discuss how to create an empty dictionary.

In the below code, you will see there are two ways to create:

  1. Use a variable that is equal to empty curly brackets
  2. Just make an empty variable equal to the dict() function.
  3. Use the key/values in a list.
  4. Use a function
  5. Use List comprehension

Creating empty dictionaries has many benefits as you can manipulate them as they are mutable.

Also, they can grow and shrink as you need, you just need to make sure that any new key you add is unique and not already stored in the dictionary.

Another thing to note about them is that they are unordered.

Finally, if you are adding data to a dictionary, the keys are case-sensitive, so the same key can exist in the dictionary, but it has to be different regards the case applied to it.

## How do you create an empty dictionary?
# empty_dict1 = {}
# empty_dict2 = dict()
# print(empty_dict1)
# print(empty_dict2)
# print(type(empty_dict1))
# print(type(empty_dict2))

#Use Keys,values in lists
# list_keys = []
# List_values = []
#
# n = dict(zip(list_keys, List_values))
# print(n)
# print(type(n))

# Note using Zip just allows you to iterate over two lists in parallel  , and the output is a set of pairs


##Use a function ##
#
# def create_dictionary():
#     d = {}
#     print(d)
#     print(type(d))
#
# create_dictionary()


##Use list comprehension##
# loop_list = []
# d = { i: j for i, j in enumerate(loop_list)}
# print(d)
# print(type(d))


Patient engagement analytics: It’s measurable!


Patient engagement is regularly perceived as an abstract concept, which can be somehow improved by distant care technologies, such as patient portals and mHealth applications. However, as long as this concept keeps its abstract nature, it is challenging to get the actionable information on how much patients are engaged and if there’s growth or decrease of their involvement level over time. It is also difficult to evaluate the impact of separate channels that are used to engage patients.

Of course, this situation cannot satisfy healthcare providers on their way to value-based care delivery, where patient engagement plays a significant role.

Hopefully, there’s nothing unmeasurable in the healthcare data analytics world. Providers can transform the abstract concept into a measurable value that will assist them in fact-based decision making, allowing to elicit the effective channels, understand what triggers patients’ attention and see the real picture of patient engagement. Let’s see how it can be done.

Guidelines for measuring patient engagement

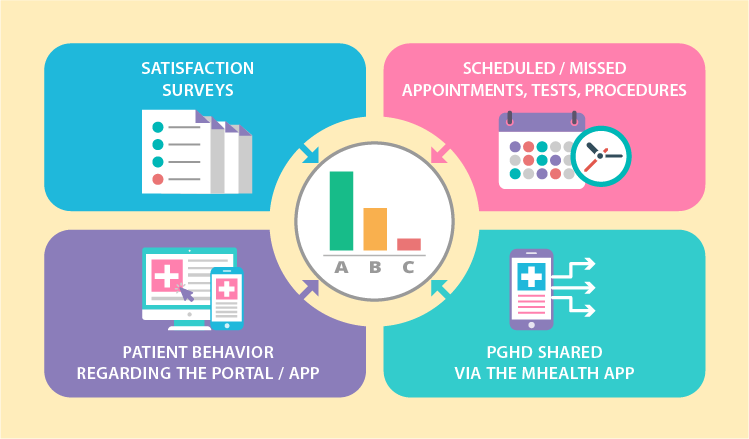
To equip healthcare providers with valuable insights on patient engagement levels, data analytics needs to harness the following 4 information flows:

  • Satisfaction surveys
  • Scheduled / missed appointments, tests, procedures
  • Patient behavior regarding the portal / app
  • PGHD shared via the mHealth app

By analyzing each flow separately as well as in combination, it is possible to range patients according to their level of involvement. For example, it can be an ABC rating, where patients with maximum engagement levels form the ‘A’ group. Accordingly, underengaged patients hit into ‘B’ and ‘C’. We came up with the following options for ranging patients.

Note: Where no particular values are advised in the examples below, the measures may vary according to a particular healthcare organization and its patients.

The frequency of patient portal logging in / mobile app launching

Patient engagement levels

Applicable to all patient groups. Here, the estimated values for groups ‘A’ and ‘B’ overlap as the target frequency may change depending on a provider.

  • ‘A’: high frequency – a few times a day, daily or weekly
  • ‘B’: medium frequency – daily, weekly, monthly
  • ‘C’: low or no frequency – rare, down to a few times a year

The scope of patient portal / mobile app features used

Applicable to all patient groups. This criterion is useful to highlight the interests of relatively healthy patients, define the services they can benefit from and reach out to them via the app or the portal they use. Depending on the available functionality, the feature scope can include vitals and medication tracking, calorie counter, treatment goal setting, rehabilitation (physical, pulmonary, post-surgery and more) support, etc. It’s estimated that an app or a portal contains several feature scopes, and each one is evaluated separately.

  • ‘A’: high use
  • ‘B’: medium
  • ‘C’: low or none

The percentage of completed appointments

Applicable to all patient groups.

  • ‘A’: 80 – 100% of completed appointments
  • ‘B’: 60 – 80% of completed appointments
  • ‘C’: less than 60% of completed appointments

Attendance of recommended follow-up appointments

Applicable to all patient groups. This criterion shows how engaged a patient is according to his or her attitude to follow-up appointments, for example, when a physician recommends an individual to come back every 6 months for a regular checkup.

  • ‘A’: 70 – 100% of recommended appointments are completed within 1-2 months from the planned date
  • ‘B’: less than 70% are completed within 1-2 months
  • ‘C’: less than 30% are completed within 1-2 months

PGHD sharing

Recommended for chronic and post-operative patients. There is also a possibility to pick one target PGHD measure for a certain disease (the blood glucose level for diabetes, SpO2 for COPD).

  • ‘A’: sharing is regular. The target frequency should be individually configured for particular patient groups. For example, patients with diabetes can share their blood glucose a few times a day, while COPD patients will share their oximetry results once or twice a week.
  • ‘B’: inconsistent sharing, some gaps in measurements (interrupted measurements, incomplete data, systematic errors, etc.).
  • ‘C’: patient makes significant gaps in measurements, which interfere with the adequate health status evaluation.

Adherence to the medication plan

Applicable to patient groups with treatment plans and medication intake schemes delivered via a mobile app or a portal. However, it is recommended to track medication intake via an app with a preset medication timer.

  • ‘A’: 80 – 100% of prescribed medications is taken within the day
  • ‘B’: 50 – 80% of medications is taken within the day
  • ‘C’: less than 50% of medications is taken within the day

Evaluation of physical activities

Applicable to all patient groups. We suggest setting different and sometimes even individual activity targets for patients with certain conditions. A physical activity can be evaluated via data flows from a smartphone’s default pedometer as well as wearables connected to the mobile patient app.

  • ‘A’: a patient’s actual physical activity is 70 – 100>% of the target
  • ‘B’: the actual activity is 50 – 70% of the target
  • ‘C’: less than 50% of the target

Survey participation ratio

Applicable to all patient groups. Individuals can receive various surveys to fill in, and the topics can vary as well. Therefore, we suggest not to focus on particular figures but rather go for the ratio of completed-to-received surveys.

  • ‘A’: a patient completes 60 – 100% of the surveys received in the last 12 months
  • ‘B’: a patient completes 30 – 60% of the surveys received in the last 12 months
  • ‘C’: a patient completes less than 30%  of the surveys received in the last 12 months

Dimensions to segment patients

We mentioned that patient engagement is rooted in personal connections, but it is also affected by an array of different events that individuals undergo daily. While it is impossible to track all events, healthcare providers can turn to information they already have and tie level of patient involvement with patients’ health profiles and clinical data. The process of tying should be also carried out by healthcare data analytics system.

To facilitate the process of creating patient segments that can be used to correlate with patient engagement, we came up with a few possible dimensions. In this concept, all the dimensions are equally important. They can be used together, separately or in different combinations, so that providers could go with wider segments or narrow them down.

Patient segmentation

Facility

Depending on a health organization’s size, patients can receive services across different facilities and locations. It can be useful to elicit the areas where patients lack engagement and then fix the situation.

Example 1. Outpatient facilities:

  • Oklahoma City, OK
  • Stillwater, OK
  • Edmond, OK and more

Example 2. Inpatient facilities:

  • Boston, MA
  • Worcester, MA
  • Springfield, MA and more

Example 3. Hospitals, clinics, other facilities:

  • Louisville, KY
  • Indianapolis, IN
  • Fort Wayne, IN and more

Therapeutic departments

As departments vary among health organizations, the list will be tailored to a particular provider. Patients can be filtered down to a one department or a few at once. For example, patients with COPD and heart problems can receive service in both pulmonology and cardiology departments.

  • Cardiology
  • Endocrinology
  • Gastroenterology
  • Ophthalmology
  • Pulmonology
  • Orthopedics
  • ENT and more

Disease status

Providers can either combine the ‘disease status’ with ‘therapeutic departments’ criteria sets or use them separately. In this set there are multiple dimensions that aren’t necessarily sufficient for the clinical-only purpose, yet they still help providers to either narrow or widen the target group. Again, each set of criteria can and should be adjusted according to provider.

Disease status:

  • acute
  • subacute
  • chronic (each section can be drilled down to specific conditions, pathologies, disorders, etc.)

Comorbidities:

  • yes (can be filtered to a list of particular diseases)
  • no

Outcomes:

  • recovery
  • complications / exacerbations (can be filtered to a particular negative outcome)

Disabilities:

  • yes (can be filtered to a specific disability)
  • no

The need for systematic supervision:

  • yes (then the list of exact supervision types, e.g. regular follow-up appointments or home care, can be provided)
  • no

Gender / Age

The following structure of basic demographics is built by revising the Erikson’s stages of human development along with Daniel Levinson’s and Carl Jung’s theories altogether. These multiple sources hold a bit different approaches, so our outcome here is aimed to aggregate various opinions, reflect both psychological and physical development, and allow healthcare providers to narrow down the patient segments to work with.

Adults:

Woman / Man:

Binding patient engagement levels to dimensions: Opportunities

The possibilities of measuring patient engagement and tying it to different dimensions of patient health profile are exciting. Let’s review a few of them.

For example, if providers want to spot the most effective channel (app vs. portal) for involving patients, they can compare equal dimensions from the list presented above, such as frequency of patient portal logging in and mobile app launching within their ‘A’-level group. They can also apply these measures to a particular facility or through departments, because this can show preferences among patients with different conditions. Each new criteria set added makes data analytics more complex and elicits new insights that can be further applied to enhancing care delivery and improving patients’ health outcomes.

Speaking of outcomes, when providers elaborate on significant measures for health outcomes analytics (such as life quality, exacerbation rates, blood pressure control and more) under CMS reporting policy or for internal performance evaluation, it also becomes possible to track multiple dependencies. While it seems logical that higher patient engagement equals in better health outcomes, results might be surprising, and they can give a hint on areas for further improvement.

Being a king when kingdom comes

Let’s look at the bigger picture. Value-based care replaces FFS reality little by little. While programs and models that are aimed to ease up the transition (such as ACOs), still use FFS payments, their goal is to keep patients healthy, prevent exacerbations, admissions, readmissions and improve patient health outcomes. And patient engagement is a strong link in this chain, especially when it is measured. 

Accordingly, analyzing patient engagement and integrating it with other healthcare data analytics dimensions providers already use means taking the lead and reaping the subsequent benefits ahead of the competition. 


Medical Data Analytics and Consulting by ScienceSoft

Analytics turns medical data into a treasure trove. Don’t miss a chance to boost patient satisfaction, optimize costs and improve internal processes.

Leverage Machine Learning for AML


Anti-Money Laundering (AML) is increasingly becoming a crucial branch of risk management and fraud prevention. AML regulations and procedures help organizations identify, monitor, and report suspicious transactions and provide an additional layer of protection against financial crime.

Money laundering is a serious threat in the financial services industry and in the online gaming and casino industry. In fact, online casinos as an industry carries the biggest risk of money laundering. Global consultancy firm, Deloitte, estimates that the amount of money laundered globally in one year is in the range of US$800 billion to US $2 trillion.[1]

With the rise of Big Data in today’s world, Machine Learning (ML) is popularly used to identify, assess, and monitor financial risks as well as detect various suspicious activities and transactions. It helps to protect organizations from financial losses, reputational damage, and regulatory penalties.

How Machine Learning Helps Detect and Prevent AML

ML algorithms identify patterns in customer behavior which could point to money laundering activities, monitor customer behavior for any sudden changes in spending patterns, any suspicious account activities, and other potential indicators of fraud.

There are primarily two underlying techniques that can be leveraged for AML initiatives- Exploratory Data Analysis and Predictive analytics.

Exploratory Data Analysis (EDA)

EDA is used to analyze data and summarize their main properties and characteristics using visual techniques. Widely used to discover trends, patterns, check assumptions and spot anomalies or outliers, EDA involves a variety of techniques including statistical analysis, and machine learning to gain a better understanding of data.
In this case, once a customer’s documents are scanned and uploaded, the necessary data is extracted from the key documents and then converted to machine-readable form. An automated process is then developed for swift verification. Thus, speeding up the entire process with minimal error.

EDA might be used to identify any unusual patterns or trends in the customer’s financial records, or to identify any connection or relationship with other entities that may be of concern. EDA can also be used to detect anomalies and inconsistencies in the data that may suggest that the client is providing fraudulent or misleading information.

The underlying technology used to convert the scanned image to machine readable format is called ‘Optical Character Recognition’ (OCR) or text recognition analysis. OCR is widely used to digitize all kinds of physical documentation.

Predictive Analytics

It is a subset of business analytics that uses statistical techniques (algorithms) to find patterns in historical data points and predict future outcomes with high accuracy. For predictive analytics to deliver high accuracy, a lot depends on the combination of domain knowledge and technical expertise. With the exponential growth of large datasets, predictive analytics is being leveraged by enterprises across industries. Predictive Analytics can help businesses in reducing risk (eg. Credit Risk Analysis) maximizing opportunities (predicting Customer LifeTime Value) and improving operational efficiencies (eg. optimizing inventory) by identifying trends and gathering insights from large volumes of data.

Different Use-cases of ML for AML initiatives

Automating ‘Know Your Customer’ (KYC) processes:

KYC process helps to identify customers, verify their identity and assess their risk of being involved in money laundering by understanding the nature of customers’ activities and validating their source of funds as legitimate. The process involves verifying customer data against various sources manually. Under AI supervision, the algorithm automatically flags suspicious users.

Automated transaction monitoring and risk assessment of customers:

Automated transaction monitoring systems use machine learning algorithms to detect suspicious activity in customer transactions and alert organizations to any potential money laundering activities. The algorithms can detect anomalies in the transactional data and helps to identify high-risk customers and transactions that may be linked to money laundering activities.

Predictive modeling for flagging suspicious activity

Predictive analytics can be used to analyze past customer behavior and transactions to identify patterns that may indicate potential money laundering activity. By leveraging predictive analytics, organizations can proactively identify and prevent money laundering before it occurs. Money dumping or poker chip dumping is a frequent form of money laundering witnessed in online casinos and poker sites that depend on predictive analytics to detect any suspicious activity.

Steps to building a highly accurate predictive model for AML

It is now easier than ever to deploy ML solutions thanks to the recent chain of innovations introduced by major industry players like AWS and Microsoft. There are a number of open-source ML platforms like KNIME that can also be leveraged to detect and predict suspicious behavior.

Building a predictive model is a continuous process and commitment. Each step is extremely important and demands a lot of attention from data scientists. These include-

Data Cleansing and Refinement:

A key step in the predictive modeling process involves assessing the quality and usefulness of existing data in terms of missing values, outliers and other anomalies. This not only helps you avoid reporting invalid results down the line but also forms a crucial step in building a solid foundation for your predictions.

Feature Engineering:

For predictive analytics to deliver high accuracy, a lot depends on domain knowledge and expertise. Feature engineering is the process of using domain knowledge of the data to create attributes that make machine learning algorithms work. The process involves selecting and creating attributes that are relevant for the specific problem. This may include combining variables, creating new variables based on existing ones, and scaling the data.

Model Selection:

A good model selection is one of the most critical steps in predictive analytics. This could include supervised learning models such as random forests, decision trees, and support vector machines, or unsupervised learning models such as clustering algorithms. It is important to review how well each possible model fits with your data before making predictive model selection choices.

Model Training:

The selected model is trained on a dataset and subsequently validated and tested before being deployed. The process includes using cross-validation to optimize the model’s performance, and parameter tuning to adjust the model’s hyperparameters. How well a model performs during training will determine how well it will perform when it is implemented in an application for end users. Hence, optimizing the model is necessary to increase the accuracy and efficiency of the model.

Model Deployment:

Deploy the model in production and monitor its performance. This could include deploying the model to an API or web service, and setting up an alert system to monitor the model’s performance. This is not the final step.

Refine the model:

Machine learning applications require meticulous attention to optimize an algorithm. Refine the models based on feedback from users and performance data to ensure that the models are accurate and reliable. This is a continuous cycle as customer behavior is known to keep evolving at a fast pace and it is necessary to keep identifying inefficiencies in the algorithm.

To conclude:

To combat money laundering and avoid being scrutinized by regulators, organizations must

  • Establish clear policies and procedures to flag suspicious customer activity. This includes customer due diligence, continous risk assessments, defining responsibility of the employees and senior managemen among others
  • Monitor customer activity across multiple channels to ensure that all transactions are legitimate including tracking customer activity on online banking, mobile banking, credit card, and other payment methods.
  • Encourage customers to report any suspicious activity. Make sure you have processes in place for customers to quickly and easily report any suspicious activity they may have noticed.
  • Provide suspicious activity reports to relevant authorities to ensure that money laundering activities are reported and investigated.
  • Stay up to date with regulations: Stay up to date with the latest regulations and security measures to ensure that your customers’ data is protected.
  • And keep refining and revisiting the algorithms and models for optimal efficiency.

REFERENCES

[1] Anti-Money Laundering Preparedness Survey Report 2020:

How to sort a Python Dictionary


Estimated reading time: 3 minutes

In our Python Overview Interview Questions we started off the process of trying to prepare you how to answer any questions that may come up in an interview scenario.

We then moved on to show how to discuss Python Dictionary Interview Questions and what may come up.

One of the questions that you may be asked is how to deal with sorting a python dictionary using a key.

Some of the ways that you may want to sort are as follows, read on for code examples:

Python Dictionary Interview Questions

How to use the sorted and Items Method in Python

In the below code, we have created an empty dictionary and then appened in three key-value pairs.

The first print statement just prints out the dictionary in its unordered fashion.

The second print statement does two things:

  1. It, first of all, sorts the empty_dict1 items in order
  2. Then it goes and creates them in a dictionary.

The reason we have to do step two is that the sorted() function returns a sorted list, as a result, it is not in a dictionary format.

empty_dict1 = {}

empty_dict1['Key2'] = '2'
empty_dict1['Key1'] = '1'
empty_dict1['Key3'] = '3'
print("Your unsorted by key dictionary is:",empty_dict1)
print("Your sorted by key dictionary is:",dict(sorted(empty_dict1.items())))

Result:
Your unsorted by key dictionary is: {'Key2': '2', 'Key1': '1', 'Key3': '3'}
Your sorted by key dictionary is: {'Key1': '1', 'Key2': '2', 'Key3': '3'}

As a follow on to the above, we could also just iterate over the dictionary using list comprehensions.

The below creates a variable called d. This is set equal to the output of the list comprehension.

Note that inside the {} brackets you have a:b, this purely creates two sets of values that will be used as the output to generate the dictionary.

You will also see that this creates index values, starting at 0, not the actual values we want.

As a result, we just drop these index values and replace them with the values we want using the pop() method.

The final two print statements show the before and after of sorting the dictionary!

d = {a:b for a, b in enumerate(empty_dict1.values())}
print(d)
d["Key2"] = d.pop(0) #replaces 0 with Key2
d["Key1"] = d.pop(1) #replaces 1 with Key1
d["Key3"] = d.pop(2) #replaces 2 with Key3
print(d)
print(dict(sorted(d.items())))

Result:
{0: '2', 1: '1', 2: '3'}
{'Key2': '2', 'Key1': '1', 'Key3': '3'}
{'Key1': '1', 'Key2': '2', 'Key3': '3'}

How to use a loop to sort a Python dictionary

d={0:2, 1: 1, 2: 3}
dict_loop={}
for i in sorted(d):
   dict_loop[i]=d[i]
print("")
print("Sorted dictionary using a loop",dict_loop)

Sales Analytics, or Is Sales Data Analysis a ‘Must-Have’?


Editor’s note: Irene shares the value of sales analytics and explains how to unlock the power of sales data. If you want to implement the ideas described below or seek a more thorough engagement of sales analytics experts, feel free to contact ScienceSoft’s data analytics consultants.

‘How to increase sales?’ is the question that appears on the agenda in every company regardless of its size and the industry it operates in. For me, the answer seems to be rather obvious – with robust sales analysis. But still, sales departments of many companies don’t have such. This makes me think that the real value of sales analytics is underestimated, so let me share my thoughts about the issue.

What is sales analytics?

In the general sense, sales data analytics is a process of generating actionable insights out of sales-related data to find ways to boost sales performance.

At ScienceSoft, we usually define 4 types of sales analytics:

  • Descriptive sales analysis aims at interpreting historical sales data collected from a variety of sources to draw conclusions. Its results help you answer such questions as ‘What were the company’s total sales last quarter?’ or ‘What products/services were best-selling last month?’
  • Diagnostic sales analysis makes one step further as its results offer you possible reasons for a certain outcome. Thus, after conducting some thorough diagnostic analysis, you may find out that the decrease in your quarterly sales was connected with the recent updates in a Google algorithm, which affected your web pages ranking in search results and, consequently, your web traffic.
  • Predictive analytics serves to mine historical data to produce forecasts for the future, and it can be conducted with such advanced technologies as machine learning and artificial intelligence. To get an example of this sales analytics type, explore one of ScienceSoft’s projects, in which our experts helped a dairy manufacturer receive an accurate sales forecast with data science.
  • Prescriptive sales analytics, combining the results of all of the above analytics types, aims at recommending a particular set of actions to take to gain a desirable outcome. For example, after analyzing customer behavior patterns, a sales rep sees an optimal strategy to close more deals with each customer segment.

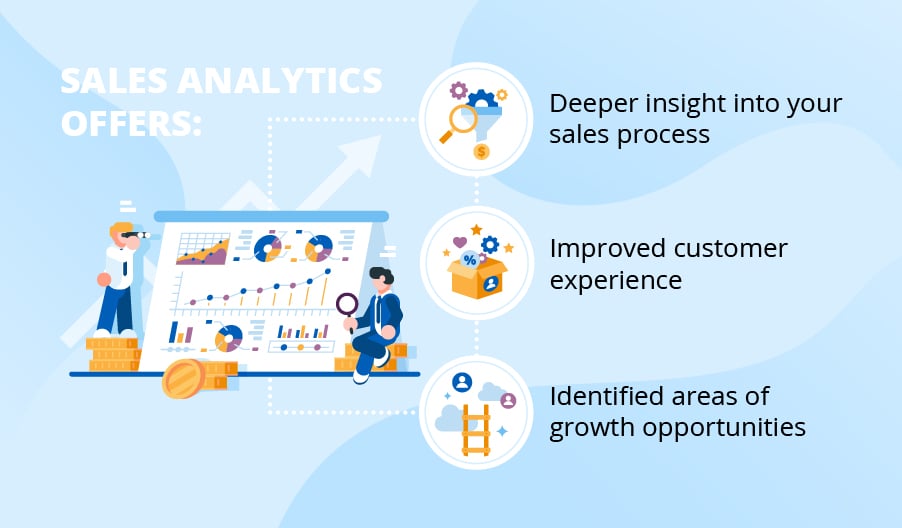
What benefits does sales analytics offer?

sales analytics benefits

Deeper insight into your sales process

With sales analytics, you can increase the efficiency and productivity of your sales department by finding answers to such questions as: What sales strategies are working best? What stages of your sales funnel are abandoned most often? Who out of your sales team is underperforming, and why? To see how it works in real life, have a look at how one of ScienceSoft’s clients gained visibility into their sales process with a solution for advanced sales analysis.

Improved customer experience

You can use sales analytics results to conduct profound customer segmentation and deliver personalized customer service. By analyzing your sales, you can also identify what of the customers’ needs are unmet and apply this knowledge to improve customers’ journeys and leverage up-selling and cross-selling, thus laying the groundwork for building customer loyalty.

Identified areas of growth opportunities

Sales analytics serves as a vector of your future market expansion by analyzing your potential customers and churners, which helps you identify the reasons why they don’t buy from you. With such analytics results on board, you’ll be able to adjust your products or services and the sales process accordingly so that to convert non-customers into paying clients.

Sales Analytics Benefits Seem Out of Reach?

ScienceSoft’s team is ready to help you establish efficient sales analytics to reap the much-desired gains and drive sales.

Core components of sales analytics

To start with quality sales analytics, you need a dedicated solution with the following components:

  • Data integration layer – to collect data from internal (CRM, accounting software, website) and external data sources (social media, public data – weather, epidemiological data, survey data) for all-rounded sales data analysis.
  • Data management layer – to ensure high data quality and data security.
  • Data analysis layer – the combination of the required data analytics types to suit particular business needs.
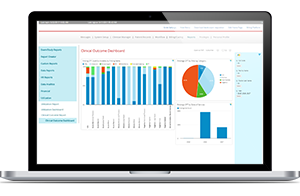
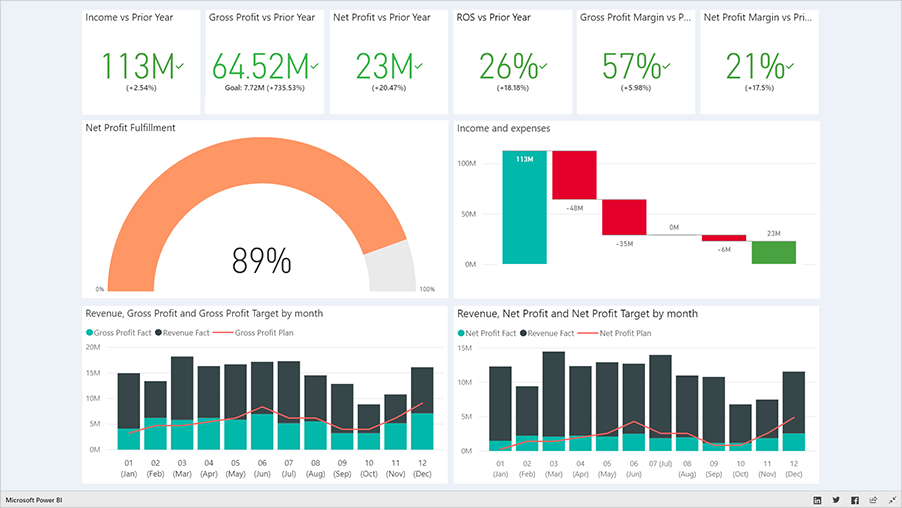
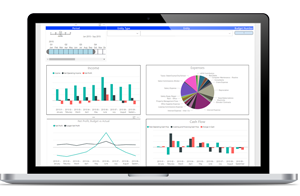
  • Analytics outcomes layer – to deliver analytics insights to decision-makers in a suitable visual format (presentations, reports and dashboards). Below, you may see the examples of sales analytics dashboards we craft for our clients to let them answer any sales-related questions. If you want to dig deeper and see dashboarding in action, feel free to watch our BI demo.

sales analytics dashboard

Sales analytics success: Tips to remember

Follow an incremental approach

Building your sales analytics solution does not necessarily mean heavy investments form the start. You may start with basic analytics functionality implemented in the cloud to eliminate the hardware-related costs and reduce the deployment time. Once the business value of sales analytics becomes clear, and you have to satisfy the newly arising analytics needs, you may further enhance your solution (adding a robust DWH, predictive analytics, data science, etc.).

Focus on delivering analytics results to business users

You have to ensure that your business users can obtain sales analytics results when they are most needed. For that, I recommend you to leverage self-service software such as Power BI or Tableau. Additionally, don’t forget to clearly communicate the introduction of your sales analytics solution through training and solid end-user support to ensure the high level of the solution’s adoption.

Grab the key to your sales growth!

With a sales analytics solution, you’ll be able to see a significant impact on your sales process and its outcomes. However, developing such a solution requires a lot of dedicated efforts – a well-designed implementation strategy, properly chosen tools and right data analytics methodologies in place. If you find these tasks overwhelming, you can always resort to a data analytics vendor and let them back up your sales analytics project. If you need assistance with your sales analytics solution, just drop us a line.


Are you striving for informed decision-making? We will convert your historical and real-time data into actionable insights and set up forecasting.

What is Business Intelligence Consulting


Thanks to the recent technological innovations and circumstances to their rapid adoption, having a data warehouse has become quite common in various enterprises across sectors. However, many businesses seem to face a lot of challenges, which includes ensuring a ‘single source of truth’ across the organization.

Several large organizations have faltered on different stages of BI implementation, from poor data quality to the inability to scale due to larger volumes of data and extremely complex BI architecture. This is where business intelligence consulting comes into the picture.

What is Business Intelligence?

Business Intelligence (BI) encompasses a wide variety of tools, applications and methodologies that enable organizations to collect data from internal systems and external sources, process it and deliver it to business users in a format that is easy to understand and provides the context needed for informed decision making.

In order to be effective, a BI solution must be aligned with the organizational strategy and business objectives and must be able to scale to support the changing needs of the business.

BI consulting comes as a huge relief for organizations because implementing BI and analytics is a time-consuming, capital and labor intensive process that is essential for every business aiming for high-growth and sustainability.

The three components of Business Intelligence are:

  • Data Strategy:a clearly defined plan of action that outlines how an organization will collect, store, process, and use data in order to achieve specific goals. Data governance and security measures are critical components of data strategy.
  • KPI Analysis: the process of evaluating the performance of an organization using a set of measurable metrics
  • infrastructure: refers to the hardware, software, and other key resources that are used to manage, maintain and analyze data within an organization.

Data strategy and management roadmap:

Effective management and utilization of information has become a critical success factor for organizations. Information management within organizations is a dynamic and complex process. Rapid changes in technology and the ever-changing competitive landscape are increasing the pressure on organizations to make swifter and more informed decisions. Any successful business needs to be able to effectively detect and respond to changes in their operating environment. To do this they need information, accurate and timely information.

On the other hand, it is an equally crucial priority to ensure the security of the data and meeting with the regulatory and compliance requirements. Data is susceptible to breach due to a number of reasons. Most of the breaches are due to internal protocol failures or failure to implement checks and balances in place.

Issues that come up because of incoherent data strategy and poor data management includes- Latency, poor data quality, risky data security measures, and higher costs

KPI Analysis:

Organizations that are not effectively tracking their KPIs are at a competitive disadvantage. Key performance indicators (KPIs) are a necessary component of any business intelligence strategy. By understanding an organization’s KPIs, an organization can track progress and identify areas of improvement on an ongoing basis. This provides businesses with information that can then be used to make informed decisions about where to allocate resources and how to respond to changes in the marketplace.

Some organizations may have missed certain KPIs which are essential to get a 360-degree view of their business. KPIs need to be tracked at different levels from across departments (at an operational level) to overall level (strategic level). Designing and implementing an effective KPI strategy can be a challenge that should ideally not be overlooked. This also applies to businesses that may not have a data warehouse and operate with the help of a backend database system.

When implementing a KPI strategy, an organization must track KPIs that can answer questions such as- what happened, why it happened, and what is likely to happen. And as a result, the number of KPIs being tracked are subjected to increase over time.

The BI infrastructure:

This includes designing and implementing data warehouses, data lakes, data marts, and OLAP cubes along with data mining, and modeling. Without a strong BI infrastructure, it can be difficult to effectively collect, store, and analyze data.

The BI infrastructure can prove to be quite expensive if not done right. The BI architecture defines the processes, tools, and data flows necessary to support BI within an organization. The goal of BI architecture is to provide a framework for supporting BI initiatives within an organization in a way that is efficient, scalable, and extensible. The BI initiatives include the organization’s short and long-term goals, current business challenges and business objectives among others.

The final stage of BI, which is generating visual reports and dashboards for analytics also witnesses a few common mistakes by organizations including delays and cluttered dashboards that are filled with chaos instead of stories. Dashboards are supposed to be neat and built to help with decision making at the strategic, tactical and operational levels.And the faster the reports are produced, the more productive and agile the organizations tend to become. To ensure minimum latency, efficient data management is key. And to ensure vital storytelling, reports and dashboard designs should be strategically aligned to a business’s short-term and long term goals.

Conclusion

A BI architecture must be designed to support the specific needs of the organization and the BI solution must be tailored to fit the architecture. The architecture must be able to accommodate the growth of the BI solution and the changing needs of the business. It is important to note that there is no one-size-fits-all BI architecture; each organization must design an architecture that is appropriate for its specific needs.

BI planning and implementation can be extremely complex with the massive volumes of data organizations today possess. A lot of meticulous planning and research is involved during every step of the journey. For small and medium organizations, it is a good idea to opt for business intelligence consulting which could result in millions of Euros saved from using the right tools, having a strategy in place and ensuring a smooth implementation of BI without any incidents.

Also read:

Breaking down Business Intelligence
How The Cloud Made ‘Data-Driven Culture’ Possible | Part 1

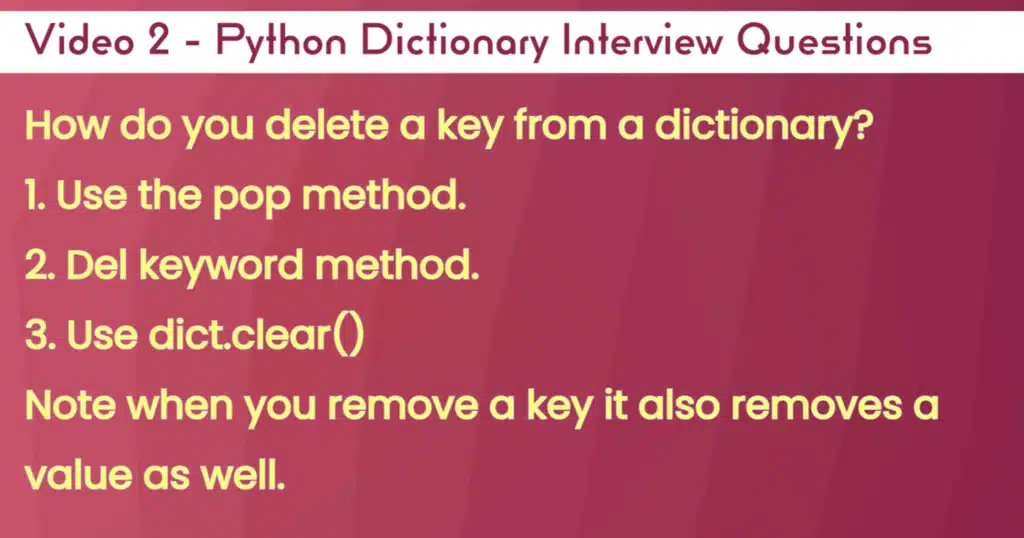
How to delete a key from a Python dictionary


Estimated reading time: 2 minutes

This is an addition to the list of questions you may get when in an interview and you are asked to give an overview of Python.

As with how to create an empty dictionary in Python, how to add values to a python dictionary, and how to sort a python dictionary we will take you through the steps here of how to delete a key from a python dictionary.

How to delete a key from a Python dictionary.

How to use the pop() method to delete a key from a dictionary

In the below example we tell Python to find the key “Key1”, then when it does it prints the python dictionary without that key or its value.

empty_dict1 = {}

empty_dict1['Key2'] = '2'
empty_dict1['Key1'] = '1'
empty_dict1['Key3'] = '3'
print(empty_dict1)

#1. Use the pop function
empty_dict1.pop('Key1')
print(empty_dict1)

Result:
{'Key2': '2', 'Key3': '3'}

How to use the Del keyword to delete a key from a dictionary

In this example, we are taking the output of the above example, and just telling the logic to remove the key “Key2” then what it does is it prints the python dictionary without that key or its value.

del empty_dict1["Key2"]
print(empty_dict1)

Result:
{'Key3': '3'}

How to use dict.clear() to delete a key from a dictionary

In this final example, we use dict.clear(). Note this will empty everything out of the dictionary, so be careful in its use.

As can be seen, it takes the output of the previous example and empties it completely.

empty_dict1.clear() # Removes everything from the dictionary.
print(empty_dict1)

Result:
{}

The Impact of Data Mining on Sports Team Management and Decision-Making


Introduction:

Sports team management and decision-making have evolved dramatically over the years, and the advent of data mining has propelled these practices to new heights. In this article, we will explore the impact of data mining on sports team management and decision-making, highlighting its transformative effects on performance analysis, player scouting, injury prevention, and fan engagement. Prepare to dive deep into the exciting world of sports data analytics, where numbers and algorithms collide with passion and strategy to shape the destiny of teams and athletes alike.

The Power of Performance Analysis

Performance analysis is at the heart of sports team management. Coaches and analysts have long relied on their intuition and expertise to assess player performance and devise game plans. However, data mining has ushered in a new era of precision and objectivity, enabling teams to extract invaluable insights from vast amounts of data. Let’s delve into some of the ways data mining impacts performance analysis:

Fine-tuning Strategies with Advanced Metrics

  • Data mining allows teams to delve into advanced metrics, such as player efficiency ratings, expected goals, and player tracking data. These metrics provide a comprehensive understanding of player performance, highlighting strengths, weaknesses, and areas for improvement. Armed with this information, coaches can fine-tune their strategies, tailor game plans to exploit opponent vulnerabilities, and optimize player rotations.
  • With data mining, teams can also gain a deeper understanding of game dynamics, identifying patterns and trends that may go unnoticed by the naked eye. By analyzing vast amounts of historical data, teams can uncover hidden gems, discovering strategies that give them an edge over their rivals.
  • The impact of data mining on sports team management and decision-making can be seen in the meticulous scouting of opponents. By leveraging data, teams can dissect an opponent’s playing style, predict their moves, and devise counterstrategies that neutralize their strengths. Data mining equips teams with the knowledge they need to outsmart their rivals and secure victories.

Discovering Hidden Talent through Player Scouting

Player scouting is a critical aspect of sports team management, and data mining has revolutionized this process. No longer do scouts rely solely on subjective evaluations and gut feelings. Here’s how data mining enhances player scouting:

Unearthing Diamonds in the Rough

  • Data mining enables teams to cast a wider net when searching for talent. By analyzing performance data from various leagues and competitions, teams can identify promising players who may have flown under the radar. These hidden gems can inject fresh energy and skill into a team, propelling them to new heights.
  • Data mining also assists in assessing the compatibility between players and teams. By analyzing data on playing styles, positional fit, and team chemistry, teams can make informed decisions when acquiring new talent. This comprehensive approach minimizes the risk of bringing in players who might disrupt team dynamics or clash with the existing roster.
  • The impact of data mining on sports team management and decision-making can be seen in the development of statistical models that predict player potential. By analyzing historical data, teams can identify statistical patterns and indicators that point to future success. This predictive power guides teams in making astute decisions during the drafting process and player acquisitions.

Preserving Athlete Health and Preventing Injuries

Enhancing Injury Prevention Strategies

Athlete health and injury prevention are paramount concerns for sports teams. Data mining plays a crucial role in these areas, helping teams make proactive decisions and reduce the risk of injuries. Here’s how data mining impacts injury prevention:

  • By analyzing player biometrics, movement patterns, and workload data, teams can identify potential injury risks and implement preventative measures. Data mining enables teams to detect patterns that precede injuries, such as fatigue or excessive stress on specific muscle groups. Armed with this knowledge, teams can adjust training regimens, implement rest periods, and provide targeted interventions to mitigate injury risks.
  • Data mining also aids in identifying the optimal workload for players, ensuring they perform at their peak without overexerting themselves. By monitoring player performance and recovery data, teams can fine-tune training programs and manage player workloads effectively. This approach minimizes the risk of overtraining and helps athletes maintain peak physical condition.
  • The impact of data mining on sports team management and decision-making is evident in the development of injury risk models. By analyzing vast amounts of historical injury data, teams can identify factors that contribute to specific injuries and develop models that predict injury likelihood. These models empower teams to make informed decisions regarding player usage, rotations, and rest periods, ultimately reducing the risk of injuries.

Engaging Fans and Maximizing Revenue

Data mining not only benefits teams and athletes but also enhances the fan experience and generates revenue opportunities. Let’s explore how data mining impacts fan engagement and revenue maximization:

Personalized Fan Experiences

  • Data mining allows teams to gain insights into fan preferences, behaviors, and consumption patterns. By analyzing data from ticket sales, social media interactions, and merchandise purchases, teams can personalize the fan experience, offering tailored promotions, targeted content, and exclusive offers. This personalized approach enhances fan loyalty, deepens the emotional connection with the team, and drives ticket sales and merchandise revenue.
  • The impact of data mining on sports team management and decision-making can be seen in the development of fan engagement strategies. By analyzing fan data, teams can identify trends, preferences, and content that resonates with their target audience. This knowledge enables teams to create compelling marketing campaigns, engaging social media content, and interactive fan experiences that captivate and retain fans.

Conclusion

The impact of data mining on sports team management and decision-making cannot be overstated. From performance analysis to player scouting, injury prevention, and fan engagement, data mining has revolutionized the way teams operate. By leveraging the power of data, teams can make informed decisions, maximize player potential, optimize strategies, reduce injury risks, and create personalized fan experiences. The fusion of data and sports has unlocked a new realm of possibilities, where precision and passion intersect to shape the future of athletic competition. So, embrace the era of data-driven sports, where success is not just determined by physical prowess, but also by the insights mined from a world of numbers and statistics.

How Banks Can Boost Cross-Selling: The Ultimate Guide


Operating in a highly commoditized industry, banks have limited possibilities to gain new clients. Since the sources of banks’ organic growth are exhaustible, selling more products and services to existing customers makes a great business sense for banks. Indeed, selling to existing customers is estimated to be almost 50% easier than selling to brand new prospects. Bain&Company also states that keeping existing customers costs 6-7 times less than attracting new ones. These statistics distinctly prove that cross-selling can help banks to increase their revenue and indirectly improve customer retention, because customers with more products are less likely to switch.

In fact, cross-selling is beneficial not only for banks but for their customers as well. As for the latter, cross-selling makes it easier to keep track and manage financials by consolidating them at a single bank. Using this approach, customers will get better service and a more qualified consultancy, since their banks will see their aggregated financial status.

To cross-sell effectively, banks must always keep the balance between making proper offers to customers and merely trying to sell more, which may look like an aggressive tactic.

Cross-selling challenges

Though effective cross-selling have always been the holy grail for banks seeking higher profits, getting sizable results is not an easy task. In particular, A.T. Kearney underlines low cross-selling indicators showing that customers on average have only 2-3 products from the same provider.

To increase these numbers, some banks tried to introduce incentives for banks’ sales teams. But as the case of Wells Fargo showed earlier this year, using an aggressive bonus-driven system of remuneration for selling additional products can result in failure and fall apart like a house of cards ruining a bank’s reputation and making customers switch to another bank. That is why, to cross-sell effectively, banks should scorn the wide-spread ‘sell-sell-sell’ mantra and suggest only those services that will help customers manage their financial affairs.

How mobile banking helps to cross-sell

Mobile banking and cross-selling

Mobile banking solutions give new opportunities for banks to reach their customers. Traditional channels such as e-mail or SMS usually lack personalization, as confirmed by the Gallup study. It shows that 66% of customers feel that incoming offers are general in nature, with 53% of customers already owning the product being promoted. With email, it usually takes more time to check the inbox, which makes it a poor choice for communicating with time-sensitive customers. Besides, banks even have no certainty that customer will open their e-mails.

By contrast, mobile banking allows showing the message any time the customer enters the app. The SMS channel shows better cross-selling results as it allows sending actionable information, but still it lacks the level of personalization achieved by using a mobile banking app. Yet, to leverage the mobile banking channel, a bank needs to go far beyond a standard delivery of promo messages.

The first step towards effective cross-selling starts with defining the actual needs of each customer. This can be achieved by analyzing customer buying behavior for financial products. This approach complements classic cross-selling practices that segment customers according to demographics, age and income. To be precise, banks can use customers’ current actions or recent transactions as triggers for creating an effective cross-selling message. Taking into account customers’ real-time behavior in a mobile app, a bank can bind a relevant marketing message exactly to the moment when a customer needs a product.

For example, a bank can put a promotional message in a personal financial management (PFM) tool, which usually includes the possibility to add customers’ personal goals (e.g. buying a house). Banks can analyze this data and benefit from it by promoting relevant products, such as a mortgage, in PFM. A bank can also suggest customers with volatile high balances on their debit cards to buy a deposit certificate by showing an advertisement with interest rates they’ll be receiving per month. Thus, a bank will get a chance to freeze a fixed amount of money on deposits. In case a bank has a network of partner merchants, it can use geo-fencing to show relevant offers or installments that can be bought locally using a credit card.

However, this process takes regular refining of promotional messages to cross-sell the most relevant product for this particular customer, with a certain sum, interest rate and duration. Potentially, banks can cross-sell almost any product or service, be it on the liability side (i.e. deposit, savings or checking accounts, etc.) or on the asset side (i.e. auto loans, student loans, mortgages, etc.), which makes cross-selling a versatile tool to increase a bank’s profits.

After creating an advertising message, banks can communicate their offerings via standard channels such as e-mail, SMS, promotional sections in bank statements, etc., and also display the message in the mobile banking app so that it looks encouraging without annoying. We prepared a number of tips that can help to keep this balance.

Tips for displaying cross-selling ads in a mobile banking app

  1. Mind the timing. Several studies by MailChimp, Experian, MailerMailer and others revealed that the best days for showing promotional messages are close to the midweek with the highest CTR on Thursdays and Tuesdays. As for the time priorities, surveys reveal that late morning (10 a.m.) and late evening (8 p.m.) are the best time during the day to display promos. Mobile CTR can also increase at dinner time when customers tend to perform most of their financial activities.
  2. Define frequency. Generally, push notifications in a bank mobile app are less intrusive than SMS, since they appear on the screen without interrupting users’ current activities. Still, they can be irritating when showed too frequently. That is why banks should work out an intelligent algorithm to communicate the offer without being annoying (for example, by setting the frequency to 1-2 times per day, by eliminating interruptions and showing the promo message only after completed transactions or by hiding ads when any app bugs or failures occur).
  3. Apply the call-to-action (CTA) button. When customers see an ad, they should have the possibility to tap on the button and apply for a loan directly from mobile banking without the need to leave the app. This demo shows how a client is offered to perform a one-click order of a new card right in their ‘Cards’ menu. 
  4. Consider user experience and interface (UX and UI). Ensuring easy-to-read fonts, choosing effective images, keeping ads lightweight for fast loading as well as checking the appearance on a variety of mobile devices will all help to make cross-selling campaigns effective. With A/B testing, banks can test different elements to find which of them is better.
  5. Speak customers’ language. Since ordinary users have little understanding of banking terminology, the language in cross-selling messages should be adopted to customers.

Making the most of screen real estate

There is one limitation of advertising through a mobile app: as long as the mobile screen is relatively small, ad sizes are even smaller. That is why, when it comes to cross-selling via a mobile banking app, less means more. What does it practically mean? Striving for simplicity, banks should keep their promotional messages clear, simple and encouraging, which can be achieved only by monitoring customers’ behavioral cues and using this data to turn a default cross-selling message into a customized, valuable one.

Support cross-selling activities with CRM
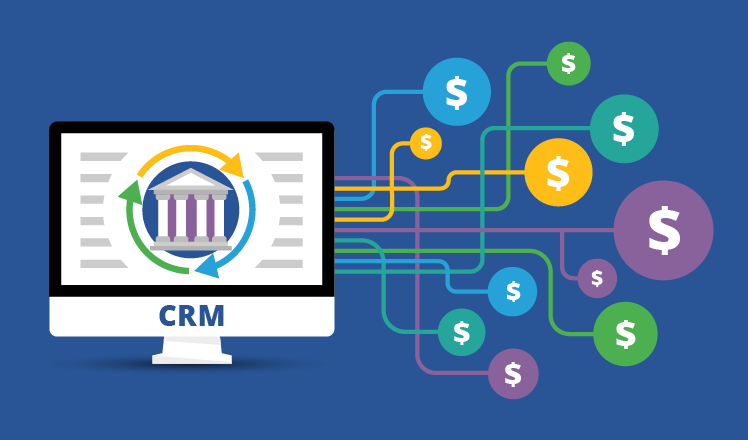
Cross-selling with banking CRM

To turn sales consultants into professional product and service advisors, banks need effective tools to go with motivation. This is where a CRM system comes into play. Based on our CRM consulting practice, we identified a number of ways in how sales consultants can use CRM to increase their share of customer wallet.

1. Deepen knowledge about customers.

360-degree customer view in CRM

CRM in banking accommodates a unified customer database of individual profiles. These profiles include account information, customer profitability, purchase history, banking preferences, and behavior collected from a bank’s backend systems, a website, mobile banking and other sources. This database is the backbone for uncovering customers’ behavior patterns, revealing the most relevant cross-selling offers and devising further interactions.

2. Develop targeted cross-selling campaigns.

In combination with customer analytics, banking CRM can be used to segment customers by various parameters (for example, demographic characteristics, lifecycle stage, occupation, lifestyle, behavior, risk exposure, etc.) and assign the most suitable product offerings for them. In addition, bank sales consultants can detect the most value-generating customers to give them special attention as well as identify customers that are more likely to buy a particular product (find out how to do it in this demo).

A bank CRM system can help sales consultants revisit the traditional cross-selling process by tying products and services to customer relevancy. Since CRM can keep track of all previous customer interactions across various channels, sales consultants won’t ever send offers that do not answer customers’ personal needs. Instead of trying to cross-sell products and services that the customer does not desire, bank sales consultants can focus on delivering personalized financial advice. Consider this example of a message from a sales agent: “I see you regularly visit our branch to make a deposit from your rental property income. Have you considered our mobile banking app that allows you to deposit checks remotely?”

3. Manage scattered cross-selling activities.

With a bank CRM, sales representatives can simultaneously cope with various activities related to cross-selling, be it customer base management, sales activities planning or preparing analytics and reporting. For example, a bank with 7 million clients, 7,000 employees and 180 branches chose a CRM solution to optimize the workflows for corporate and individual profiles, as well as assigning tasks for sales consultants, which allowed users to plan calls and meetings with customers as well as report the results in the system. Banking executives also found it convenient for analysis of cross-selling results through comprehensive visualized reports.

N. B. Fill customer profiles with informative notes

Any CRM system requires a consistent teamwork and discipline in filling customer profiles. But apart from registering data about the cross-selling process itself, sales consultants should also focus on listening to customer sentiments and making respective notes. For example, instead of creating product-pitching records (e.g. “Discussed a mobile banking app” or “Offered a checking account, refused”), sales agents should rather mention valuable insights (e.g. “Has a teenager who is going to enter college in 2 years”).

4. Improve sales force performance.

Sales consultants can use CRM to centrally store their contacts, mark recent activities, and schedule calls, meetings in one place. Thus, CRM can help sales force optimize their daily activities, set individual goals, prioritize tasks and allocate time for each customer, which increases cross-selling possibilities.

How predictive analytics helps to cross-sell

Just a decade ago, predictive analytics was an exotic banking software tool used in just a few niches, such as credit risk evaluation or fraud detection. However, in the course of time, marketers realized it could be a competitive advantage to win and retain customers. Just look at how Facebook uses predictions to tailor the news feed to the user’s interests! Imagine how different your customer communications would be if you personalized your banking activities in the same way.

Due to an increased product commoditization, cross-selling has lately become a nightmare for most retail banks. In this regard, banks that want to sell extra products should cultivate deep knowledge of their customers. It means tailoring offers in a timely manner based on customers’ activities in their accounts, as well as their habits and lifestyle changes. To apply this in practice, banks should scrap “one-size-fits-all” campaigns and push-based selling, where sales representatives have to persuade existing customers to sign up for multiple products regardless of their needs. Instead, they can use predictive analysis to personalize communications with customers and offer them only relevant banking products and services.

To apply more advanced cross-selling techniques, it’s not necessary to buy standalone predictive solutions, because some banking CRM platforms go with built-in predictive analytics capabilities. For example, Salesforce offers its predictive tool Einstein that can significantly improve basic segmentation and standard marketing scripts with a “next best offer” (NBA) concept. Einstein takes into account all known information about customers and provides real-time product recommendations as well as optimal communication channels (e.g., e-mail, call center, mobile banking or even a banking chatbot). As a result, sales reps get a ranked and prioritized list of customers that tells them 1) whom to contact first, 2) what to sell to them and/or 3) what information they need.

Some banks have already taken advantage of predictive analytics software. For example, First Tennessee Bank managed to optimize its marketing strategy, which resulted in an impressive 600% ROI through more accurately targeted offers within high-value customer segments.

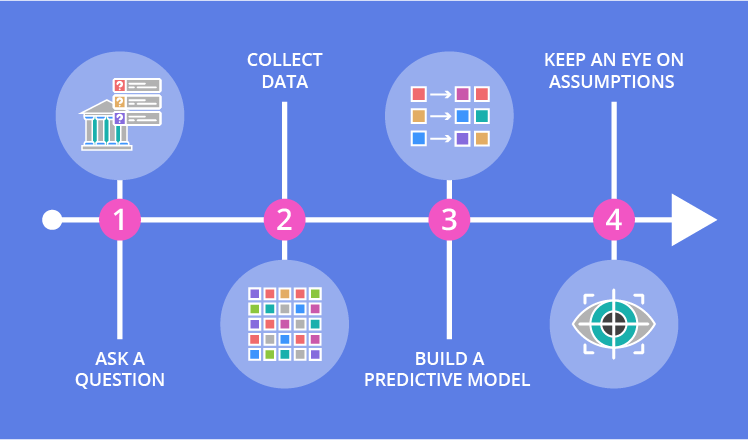
Checklist: 4 steps to apply predictive analytics
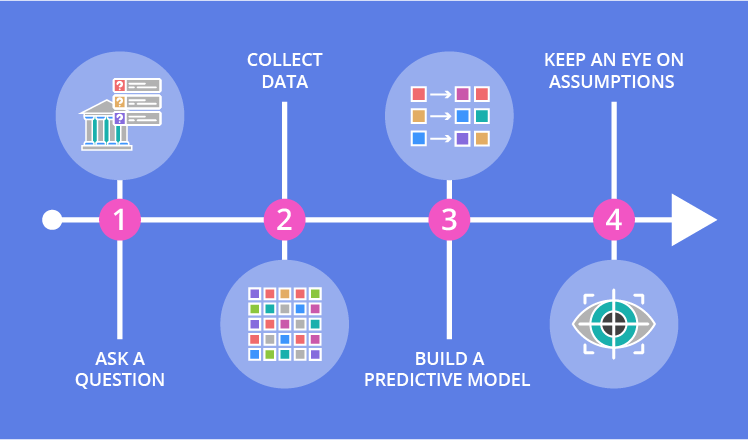
Banking cross-selling with predictive analytics

1. Ask a question

Unlike traditional BI tools (e.g., descriptive or diagnostic analytics) that are retrospective by nature, predictive analytics can give you insights about the future. Thus, instead of trying to understand the reasons for something that happened in the past, your bank can use predictive analytics to anticipate upcoming events and work out a plan in advance.

With analytics software, banks can answer various questions:

  • How many leads will a new marketing campaign generate?
  • What is the profit potential of a customer X over the next 2 years?
  • Which customers are going to churn?
  • What is the probability that a customer X will purchase a product A, if he or she purchases a product B?

2. Collect Data

Once a bank stated a question, the next step is to find the data that directly or indirectly reflects the answer. The confidence level of every prediction highly correlates with the quality of data presented for analysis. Only consistent data can provide trustable insights.

Still, according to our analytics consulting practice, data collection is usually the most time-consuming aspect of data analysis. The reason is that the majority of banks store inconsistent, outdated or incomplete information about customers in their banking CRM systems. Thus, to streamline the process of data collection, banks should timely update and review their customer profiles.

For some predictive models, customer information from a banking CRM is not enough. In this case, a bank will need to incorporate additional data sources in its model. In particular, Aite Group suggests the following data sources:

  • Channel preferences
  • Social media insights
  • Consumer ratings and reviews
  • Bill payment behavior
  • Personal financial management (e.g., customers’ financial goals)
  • Geolocation
  • Current events

3. Build a predictive model

At this step, data analysts (or data scientists) create a model that will define the probability that a certain event will happen in the future. To do this, they employ machine learning (ML) methods of various complexity, from linear regression to deep learning. To illustrate the idea, let’s see how a ML algorithm based on regression analysis helps find the probability that a customer will close his or her account in 2-3 months.

First, a data analyst assumes that certain variables correlate with customers’ desire to churn. In this case, the analyst can use the last transaction date, the last external deposit, the number of monthly transactions, etc. Then, the analyst creates training and tests data sets containing real customer data: the values of the chosen variables and the binary (Y/N) values of customer churn. Both data sets should include the data of both loyal customers and those who left, so that the future model could learn to distinguish them based on their behavior (the chosen variables).

The next task is to find the correlation between the chosen variables and the customer churn probability. To do this, the data analyst creates a linear regression model that will calculate the weight of each variable, i.e., if and how much the variables influence the customer churn probability. But first the model should be trained on real data from the training data set (this is why the process is called machine learning).

After a number of training iterations (processing data entries), the analyst gets a predictive model that ‘explains’ customer attrition. Now, the test data set is used to assess the model’s predictive power. If it’s not enough, the model can be further elaborated to achieve a higher accuracy.

An accurate predictive model is a powerful tool. When fed with a customer’s data, it outputs the ‘churn score’, and if this score exceeds a certain threshold, a bank can take preventive measures for customer retention. Once created, the same predictive model can be applied to any customer’s data.

4. Keep an eye on assumptions

One major assumption in predictive analytics is that the future will be similar to the past. Indeed, as stated by Charles Duhigg in his book The Power of Habit, people establish strong patterns of behavior and follow them over time, which makes a predictive model rather reliable. However, sometimes people change their behavior patterns, so the model, once used to predict them, may become invalid.

Besides, time or changing market circumstances can also alter a predictive model’s assumptions. For example, models once used to predict mortgage repayment were based on the assumption that the housing prices would always rise, which resulted in the financial crisis of 2008. Thus, if a model contains a variable that changes over time, it will probably lose its predictive power eventually.

Overcoming skepticism

Despite sizable benefits, many skeptics still don’t believe in algorithms’ abilities to predict the future. For example, Gary King, a professor from Harvard University and the director of the Institute for Quantitative Social Science, mentions that statistical predictions are valid only in sterile laboratory conditions, whereas in reality a bank cannot know for sure which variables influence a customer’s behavior. As he puts it, “Everything from the weather to [a customer’s] relationship with their mother can change the way people think and act. All of those variables are unpredictable. How they will impact a person is even less predictable. If put in the exact same situation tomorrow, they may make a completely different decision”.

Though these words make sense, we still believe that banks should strive to decrease the level of uncertainty and apply predictive analytics in their daily operations. Data-driven decision-making has its limitations, but it is much better than wild guesses.

Switch from selling to advising

To cross-sell effectively, banks should keep balance between pushing to sell more and making valuable, relevant offers to customers. For this purpose, banks should suggest only those services that will help customers manage their financial affairs.


Want to boost cross-selling?

We can help you get a solid CRM system, a quality mobile banking app or an elaborate analytical solution to get you there.

Agile Software Development – Overview


Agility for any organization is the ability to stay alert and be prepared to act on any decision almost instantly. Agile software development is a collaborative process between and within project teams with an ingrained set of values and principles for software development. The end goal is to streamline software development and increase the ability of the organization to respond to change and deliver working software quickly. This is usually done in a variety of ways. Something we’ll go over later in the article

Agile project development became a trending topic during the pandemic as a faster time-to-market became a unique competitive advantage for many organizations. Disruptive measures to help fight different types of disruption that was being witnessed for the first time. Fast-forward to now, agile development is everywhere, in every industry. Companies have made heavy investments to adopt agile development methodologies. By adopting agile development methodologies and practices, organizations can improve their ability to respond to changing business needs and deliver value to customers faster.

Agile development reinforced the culture of customer-centricity to a whole different level. The core values of agile development revolve around human touch over complex processes, tools and documentation. Agile teams often apply lean principles, such as eliminating waste and maximizing value, to optimize their development processes and improve efficiency.

Types of Agile Development Methodologies

There are different ways agile development can be executed within an organization. Agile development methodologies are frameworks for managing projects such as the development of software and other products in an iterative and incremental manner. Agile methodologies emphasize flexibility, efficiency, collaboration, and rapid delivery of value to customers. Some of the most popular agile development methodologies include Scrum, Kanban, Extreme Programming, Lean Software Development, Crystal and Feature-Driven Development.

Scrum

Scrum is well-suited to projects where the requirements are not completely understood at the getgo and emphasis is placed on the ability to respond quickly to changing requirements. It is based on a set of meetings that help the team to plan, track progress, and review and reflect on its work. These meetings include the sprint planning meeting, the daily stand-up, the sprint review, and the sprint retrospective.
The key roles in a Scrum team are the Scrum Master, the Product Owner, and the development team. The Scrum teams work in short iterations, called sprints, which typically last between one and four weeks. The Scrum Master is responsible for facilitating the process and removing any obstacles that may prevent the team from delivering value. The Product Owner is responsible for defining the features and priorities of the product, and for ensuring that the team is working on the most valuable items. The development team is responsible for delivering working software at the end of each sprint.

Read more about scrum here.

Kanban

Kanban is based on the principles of just-in-time (JIT) manufacturing, and aims at allowing work to flow through the development process in a controlled and transparent manner. It is a visual system for managing work that involves the use of cards or other visual elements to represent work items, and a set of rules for how those work items should be moved through the development process.

The key elements of a Kanban system are the Kanban board, which is used to visualize the work items and their status, and the Kanban rules, which define how work items should be moved through the process. It can be used to manage any type of work, including software development, manufacturing, and service delivery.

Read more about Kanban here.

Lean Software Development

Lean Software Development is applying the principles of increasing productivity in manufacturing plants such as reducing movement/development time within the production system (of people and machinery) as well as response times from suppliers in the manufacturing segment. It emphasizes the importance of streamlining activities and prioritizing only the essential functions and processes to utilize time as efficiently as possible and minimize waste (such as unnecessary code, features or processes).

Under lean software development, the project teams undertake multiple experiments to understand what works and what doesn’t, allowing them to make rapid adjustments and improve their processes with time. And just like for manufacturing, the software teams build the process keeping quality in mind from start to finish. Quality development process and delivery of quality features are the outcomes of such a system.

Read more about Lean Software Development here.

Extreme Programming (XP)

Extreme Programming (XP) is an agile methodology that emphasizes simplicity, communication, and feedback. It is based on a set of values and practices that are designed to help teams deliver high-quality software in a rapid and responsive manner.
XP stresses the importance of the appropriate kind of communication and feedback because that is the most essential sauce for developing high quality software.
The most interesting aspect that differentiates XP from the rest is ‘pair-programming’.

An extended development team is deployed on a project and developers work in pairs of 2 or more to develop code together ensuring quality and fast delivery at the same time.

Read more about XP here.

Feature-Driven Development (FDD)

Feature-Driven Development (FDD), also called iterative and incremental software development, is a framework that prioritizes delivering business value to the customer as quickly as possible by delivering value or functionalities to customers in the form of small, incremental releases otherwise known as ‘features’. Each feature is planned in detail, including design, development, and testing. The project team identifies the features that need to be developed and prioritizes them based on business value which is then deployed to the customer for feedback and acceptance.

Delivering the features in small increments significantly reduces all kinds of risks associated with projects that usually have a high degree of complexity and uncertainty. It allows for more accurate planning.as the focus is on delivering tangible business value to the customer early and often, which helps to ensure that the project stays aligned with the customer’s needs and priorities.

Read more about FDD here.

Choosing an Agile Development Framework

There are a few key factors to consider when choosing which agile development methodology is best fit for an organization. Each of these frameworks comes with its own set of values and principles, pros and cons. Adopting the wrong agile methodology would prove to be a great counterexample of what an organization was meaning to achieve with it in the first place.

Business Needs and Goals

It is important to choose an agile methodology that aligns with the organization’s business needs, goals and the core work that the business is involved with. The business needs or goals of a electronic devices manufacturing company might need a specific type of agile development framework compared to that of a pharma or a SaaS company. If the organization is focused on minimizing waste and maximizing efficiency, a methodology such as Lean Software Development or Kanban may be a great fit, whereas if the organization is looking to deliver value to customers as quickly as possible, a methodology such as Scrum or XP may be a better fit.

Team Size and Structure

The size and structure of the development team impacts which agile methodology is a better fit. Agile development becomes difficult to implement based on varying team sizes and hence, a lot of effort goes into deciding the framework to be adopted as well as team sizes and structure. Frameworks like XP cannot be implemented if the team size is small.

It is also important to consider the organization’s culture, and readiness to adopt agile practices. Some agile methodologies, such as Scrum, are more prescriptive and may be easier for organizations to adopt, while others, such as XP may require a greater degree of effort and organizational buy-in. It is also critical to account for a team’s experience with agile methodologies while making a decision.

Project complexity

Each agile framework has its own set of pros and cons. The complexity of the project can also impact which agile methodology is best fit. For example, a simple project with well-defined requirements may be well-suited to a methodology such as Scrum, while a more complex project with rapidly changing requirements may be better suited to a methodology such as XP or Crystal. For example, with Kanban, the teams are required to handle a steady stream of requests with varying priorities. The level of customer involvement with the brand is another factor to be considered while finalizing an approach.

Is DevOps part of Agile Methodologies?

Not Quite. While Agile and DevOps share some similarities, they are not the same thing. Agile focuses on the development process, and DevOps encompasses the entire software development lifecycle, from development and testing to deployment and operation. As a result, DevOps is believed to be the successor of Agile.

DevOps is a set of practices that combines software development and information-technology operations (Ops) by improving the collaboration and communication between software developers and IT operations professionals. The aim of DevOps is to minimize the time taken to develop and release software by establishing a culture and environment where building, testing, and releasing software can happen rapidly, frequently, and more reliably. This is typically achieved through the use of automation and tools that enable continuous integration and delivery.

In practice, many organizations adopt both Agile and DevOps practices, as they can complement each other and help to improve the speed, quality, and reliability of software development and delivery.