Kalki 2898 AD blends Star Wars with Hindu myth, plus a dash of RRR


Actor Amitabh Bachchan is a metaphorical giant of Indian cinema, a superstar of proportions that dwarf even A-list American celebrities. In the Indian sci-fi epic Kalki 2898 AD, his stature becomes literal: In his role as the 7-foot-tall immortal warrior Ashwatthama, the 81-year-old towers over his younger co-stars, all of whom are draws in their own right. (A handy way for the uninitiated to measure the relative fame of an Indian actor is to note the length of their introduction in a movie — the bigger the name, the more elaborate the entrance.) The sheer amount of star power in this film is overwhelming, but that isn’t even the most ambitious thing about it.

Writer-director Nag Ashwin means for Kalki 2898 AD to be nothing less than the ultimate sci-fi epic. Its scope is huge, covering 6,000 years of mythological history. Its run time is long, telling the first part of a two-part story over three jam-packed hours. (To be fair, Denis Villeneuve’s Dune movies aren’t much shorter.) And its production was expensive — reportedly around $72 million, one of the biggest budgets ever for an Indian movie. The filmmakers hope it will be a crossover event akin to S.S. Rajamouli’s record-breaking hit RRR, not only within India’s disparate film industries (Bachchan is known as a Bollywood actor, while co-stars Prabhas and Kamal Haasan work in Telugu and Tamil films, respectively) but internationally as well.

The film’s look, rendered almost entirely through CGI, will certainly feel familiar to Western audiences, with elements that recall the beloved sci-fi franchises Blade Runner, Star Wars, The Matrix, Dune, and especially Mad Max: Fury Road. The story is more specifically Indian, taking the Hindu myth of Kalki — the 10th and final incarnation of the god Vishnu, who will come to lead humanity into a new era of peace and justice — and transporting it to a dystopian sci-fi setting. But while references to magical weapons and folkloric heroes may go over the heads of all but the best-informed foreign viewers, the story’s arc follows the familiar beats of a Chosen One narrative.

A promo image for the Indian sci-fi blockbuster Kalki 2989 AD composites a young man and woman facing away from each other, with an older, white-bearded man in robes and holding a staff superimposed over both of them. In the background behind the man is a desert wasteland full of shattered, rusty wreckage. In the background behind the woman is a verdant mountain and lake, dotted with buildings.

Image: Vyjayanthi Movies

This first chapter of the Kalki 2898 AD saga spends much of its run time setting up its characters and world, beginning with a caravan of refugees arriving in the futuristic city of Kasi, the last outpost of civilization after droughts and pollution have rendered most of the planet uninhabitable. Life is cheap in Kasi, where a single chicken egg fetches the same price as a human being on the black market. The one exception is fertile women, who have become extremely valuable in this dystopian future world: Whenever one is discovered, she’s sold and shipped off to the Complex, a floating pyramid above the city, where a wealthy minority hoard the few natural resources that are left.

SUM-80 (Deepika Padukone) is one of these women, and one of hundreds who live as lab rats at the pleasure of Supreme Yaskin (Haasan), a 200-year-old tyrant who extends his life by extracting a serum from the wombs of impregnated female captives. The women die in the process, but no matter; their corpses are thrown into an incinerator, and new girls take their place. SUM-80, understandably, wants to live, so she’s hiding her pregnancy from everyone around her. But it’s been five months, and the sadistic doctors who run this so-called Project K will notice soon.

Things are grim in a different way outside of the Complex, though affable bounty hunter Bhairava (Prabhas) does his best to keep the mood light. Indian films typically blend genres, and although Kalki 2898 AD is more serious-minded than most Bollywood fare — there are no true musical numbers, sadly, though characters do lip-sync to Santhosh Narayanan’s original songs — Bhairava and his wisecracking AI companion Bujji (Keerthy Suresh) bring much-needed, Star Wars-esque comedic banter to the film. Bhairava is a Han Solo type, motivated by self-interest and the pursuit of cash, or “units.” Like Han, he’s also a ladykiller, as we learn when the similarly roguish Roxie (Disha Patani) enters the narrative.

In a promo image for the Indian sci-fi blockbuster Kalki 2989 AD, a man in black clothing and a long black cape stands in a dark, V-shaped object that looks like a single-person spaceship with a crimson-lined interior and closing crimson highlights. Behind him in the darkness, a group of similar-looking ships glow against dark mountains.

Image: Saswata Chatterjee, Sri Venkateswara Creations/Everett Collection

At first, it isn’t clear how SUM-80, Bhairava, and 6,000-year-old badass Ashwatthama, who spends much of the movie hiding out in a cave, are connected. It’s never in doubt that they’ll meet up eventually, though, or that each of them will play their role in fulfilling the prophecy preached by a rebel group living in a hidden utopia known as Shambhala. Eventually, the action moves to the rebels’ sacred retreat. But first, SUM-80 must race across the wastelands, pursued by both Supreme Yaskin’s flunkies and Bhairava, who plans to exchange this precious hostage for admission to the Complex.

Some of the digital backgrounds VFX supervisor Praveen Kilaru and his team created for Kalki 2898 AD are absolutely stunning, and sci-fi fans who like nerding out on cool ships and badass vehicles will find a lot to get into here. (The design for Bujji, who can transform from a cool car to a cooler battle robot, is especially compelling.)

But the fact that this is just the first part of a two-part story creates some serious structural issues. The first two hours of the film pass at a lively but unhurried clip, but the final hour tries to cram too much into an already overstimulating epic battle scene. It feels panicky and confused as it rushes through crucial plot developments and exposition.

in a promo still for the Indian sci-fi blockbuster Kalki 2898 AD, a humanoid figure in metal armor and mask sits in a dark space, surrounded by metal spars

Image: Saswata Chatterjee, Sri Venkateswara Creations/Everett Collection

Comparisons between Kalki and RRR are inevitable, if only because the former is nakedly trying to replicate the success of the latter. But Nag Ashwin’s film is missing a few of the elements that made RRR so charming: There’s no central bromance, no exhilarating dance sequences, and no sense of surprise. There is comedy, but it’s isolated in certain sections of the film, and there’s much less romance and music than audiences might expect. It’s still an entertaining ride, with some cool imagery and exciting chase scenes. But by channeling the gravitas of Western sci-fi movies, Kalki 2898 AD loses some of the range that makes Indian movies special. Its ambition is to be applauded. Its self-seriousness, not so much.

Kalki 2898 AD is in theaters worldwide now.

Visual Studio 2022’s Debug mode Watch feature to narrow down exception to a more specific exception-type class as opposed to the general C# Exception


Related Posting: Finding specific Exceptions using Visual Studio

Here is info about our technical development environment :

• Microsoft Visual Studio 2022

• .NET 6.0

• C# 10

In a big application, I have a try/catch block that will catch all C# Exceptions at the Program.cs/Main.cs top-level code file.
However, I would like to use Visual Studio 2022’s Debug mode’s “Add Watch” feature that will keep watch of “ex” variable that is of type C# Exception.

Using Visual Studio 2022’s Debug mode’s “Watch” feature , I placed a Watch on the Exception’s ex variable that is in my Program.cs/Main.cs top-level code file. This is shown in the snapshot picture image of the Visual Studio 2022’s Watch window that I copy and pasted below in this posting.

Isn’t there a way to use the Visual Studio 2022’s Debug mode’s “Watch” feature to narrow it down? In other words, isn’t there a way to go down the Exception “ex” variable tree hierarchy shown in the “Watch” window in order to determine the “narrowed down” specific exception type? could someone please tell me how I can narrow down the exception to a more specific exception-type class than the more general C# Exception that is the top ancestor class in the C# Exception classes inheritance hierarchy?

enter image description here

The MacRumors Show: Apple Vision Pro Available Around the World


On this week’s episode of The MacRumors Show, we discuss the international rollout of Apple Vision Pro and the new Beats Pill Bluetooth speaker.

Apple’s Vision Pro headset is now available to pre-order in Australia, Canada, France, Germany, and the United Kingdom, with availability beginning Friday, July 12. The device also launched today in China, Hong Kong, Japan, and Singapore. It has been available in the United States since February. We discuss key considerations when buying the Vision Pro, such as storage configurations and accessories, as well as the significance of the device’s long-awaited rollout around the world. We also look to the future with Apple’s rumored low-cost Vision headset, which may rely on a tethered iPhone for processing power to reduce costs.

In addition, we discuss Apple’s new Beats Pill Bluetooth speaker, featuring a completely redesigned speaker system consisting of a single tweeter and a single racetrack woofer, a removable lanyard, USB-C and Bluetooth connectivity, 24 hours of battery life, and IP67 water and sweat resistance. The MacRumors Show has its own YouTube channel, so make sure you’re subscribed to keep up with new episodes and clips:

You can also listen to ‌The MacRumors Show‌ on Apple Podcasts, Spotify, Overcast, or your preferred podcasts app. You can also copy our RSS feed directly into your podcast player.

If you haven’t already listened to the previous episode of The MacRumors Show, catch up for our discussion about Apple Intelligence, the apparent suspension of work on the second-generation Vision Pro headset, and Apple’s rumored plans to move to thinner device designs.

Subscribe to ‌The MacRumors Show‌ for new episodes every week, where we discuss some of the topical news breaking here on MacRumors, often joined by interesting guests such as Matthew Cassinelli, Brian Tong, Quinn Nelson, Kevin Nether, Jared Nelson, Eli Hodapp, Luke Miani, Mike Bell, Sara Dietschy, iJustine, Jon Rettinger, Andru Edwards, Arnold Kim, Ben Sullins, Marcus Kane, Christopher Lawley, Frank McShan, David Lewis, Tyler Stalman, Jon Prosser, Sam Kohl, John Gruber, Federico Viticci, Thomas Frank, Jonathan Morrison, Ross Young, Ian Zelbo, and Rene Ritchie.

‌The MacRumors Show‌ is on X @MacRumorsShow, so be sure to give us a follow to keep up with the podcast. You can also head over to The MacRumors Show forum thread to engage with us directly. Remember to rate and review the podcast, and let us know what subjects and guests you would like to see in the future.


24 years later, you can finally pet the dog in Deus Ex thanks to its all-encompassing Randomizer mod


Deus Ex’s Randomizer Mod has always been more than just a randomizer: its QoL features, mod compatibility, and customization options make it a one-stop shop for keeping Ion Storm’s classic fresh. The Randomizer’s 3.0 update, released just ahead of Deus Ex’s 24th birthday, has even more features that will appeal to anyone, not just challenge runners.

Yes, now you can pet the cyberpunk RPG’s delightfully low-res dogs, as well as cats and pigeons out there on the mean streets of New York, Hong Kong, and Gay Paree. I haven’t had a chance to load up the new update myself and see if this love fest extends to Deus Ex’s many rats as well, but you can always just rotate one around in your mind to help focus.

Ghibli-style charmer Mika And The Witch’s Mountain swoops into early access in August


Mika and The Witch’s Mountain appears to be an unofficial video game adaptation of Kiki’s Delivery Service, which is a Studio Ghibli film about a witch who decides to go postal, but not in the Running with Scissors sense. Created by developers Chibig and Nukefist, it’s a “mini open world” game about carrying packages by broomstick while investigating the titular mountain, flying through hoops a la Pilotwings, and savouring the balmy inconsequentiality of an island that reminds me of Super Mario Sunshine. It also now has an early access release date, 21st August, and a charming new trailer.

Continue reading “Ghibli-style charmer Mika And The Witch’s Mountain swoops into early access in August”

Behind the Scenes: “Never Fully Gone” Music Video Shoot


Filmmakers Jennifer Pautke and James Frasca recently collaborated on an exciting project: shooting a music video for Collideoscope’s new song “Never Fully Gone.” This two-day shoot took place at a local beach and a vibrant local music venue, utilizing top-tier equipment to bring the music video to life.

Equipment Highlights: LUMIX S5IIX, Atomos Ninja Ultra, and OWC Atlas Ultra SD Card

To ensure the highest quality footage, the team used state-of-the-art equipment, including the LUMIX S5IIX camera, the Atomos Ninja Ultra monitor, and the OWC Atlas Ultra SD Card.

LUMIX S5IIX: The Camera of Choice

The LUMIX S5IIX was the primary camera for the shoot. Director of Photography James Frasca selected this camera for its full-frame, mirrorless design, which delivered stunning shots and brought the music video vision to life. Key features include:

  • 24.2MP 35mm full-frame CMOS sensor with phase hybrid autofocus
  • Active I.S. for stable walking shots
  • High-resolution imaging engine with approximately 2x higher-speed signal processing for high bit-rate video recording
  • 5.8K Pro-Res, Pro-Res internal, RAW over HDMI, and Wireless/Wired IP streaming capabilities
Atomos Ninja Ultra: Perfect for Car Shoots

The Atomos Ninja Ultra was instrumental during the interior car shoots. With DP James Frasca in the front seat and Jennifer Pautke directing from the back seat, the Ninja Ultra monitor allowed Jennifer to view the camera feed and provide real-time direction to the actor. Notable features include:

  • ProRes RAW capture up to 8K 30P, 6K 60P, and 4K 120P
  • Full codec flexibility with ProRes RAW, ProRes, DNxHD, and H.265 (HEVC)
  • AtomOS 11 with exclusive monitoring and recording features
OWC Atlas Ultra SD Card: Reliable and Fast

To record all the footage, the team used the OWC 128GB Atlas Ultra SDXC V90 UHS-II Memory Card. Known for its reliability and speed, this card ensured smooth and uninterrupted recording. Features include:

  • Super-fast read and write speeds
  • Thorough quality control process for data integrity
  • Ideal for high-end workflows and maximum camera settings

Conclusion

The collaboration between Jennifer Pautke and James Frasca, combined with the cutting-edge equipment, resulted in a visually stunning music video for “Never Fully Gone.” The seamless integration of the LUMIX S5IIX, Atomos Ninja Ultra, and OWC Atlas Ultra SD Card played a crucial role in capturing the essence of Collideoscope’s new song, making it a project to remember.

Watch the Never Fully Gone music video below:

Visual Studio Code October 2022


Update 1.73.1: The update addresses these issues.

Downloads: Windows: x64 Arm64 | Mac: Universal Intel silicon | Linux: deb rpm tarball Arm snap


Welcome to the October 2022 release of Visual Studio Code. There are many updates in this version that we hope you’ll like, some of the key highlights include:

If you’d like to read these release notes online, go to Updates on code.visualstudio.com.

Insiders: Want to try new features as soon as possible? You can download the nightly Insiders build and try the latest updates as soon as they are available.

Accessibility

New audio cues

There are new audio cues to help with Tasks and the Terminal.

  • Task completed – sounds that a task is completed (controlled by the audioCues.taskCompleted setting).
  • Task failed – sounds when a task fails (audioCues.taskFailed).
  • Terminal Quick Fix – if a Quick Fix is available on the current line (audioCues.terminalQuickFix).

Word wrapping in screen reader mode

Word wrapping had been disabled when running VS Code in screen reader mode to prevent a degraded screen reader experience. This has been fixed and can be enabled via editor.wordWrap.

Accessibility setting tag

An accessibility tag is now available to improve discoverability of accessibility related settings.

The Preferences: Open Accessibility Settings command opens the Settings editor with the @tag:accessibility filter.

Workbench

When right-clicking a folder in the Search view’s tree view of results, there are now two new options in the context menu.

  • Selecting Restrict Search to Folder adds the selected folder path(s) to the files to include textbox. Adding a path to this textbox will limit search results to ones that fit the listed paths or patterns.
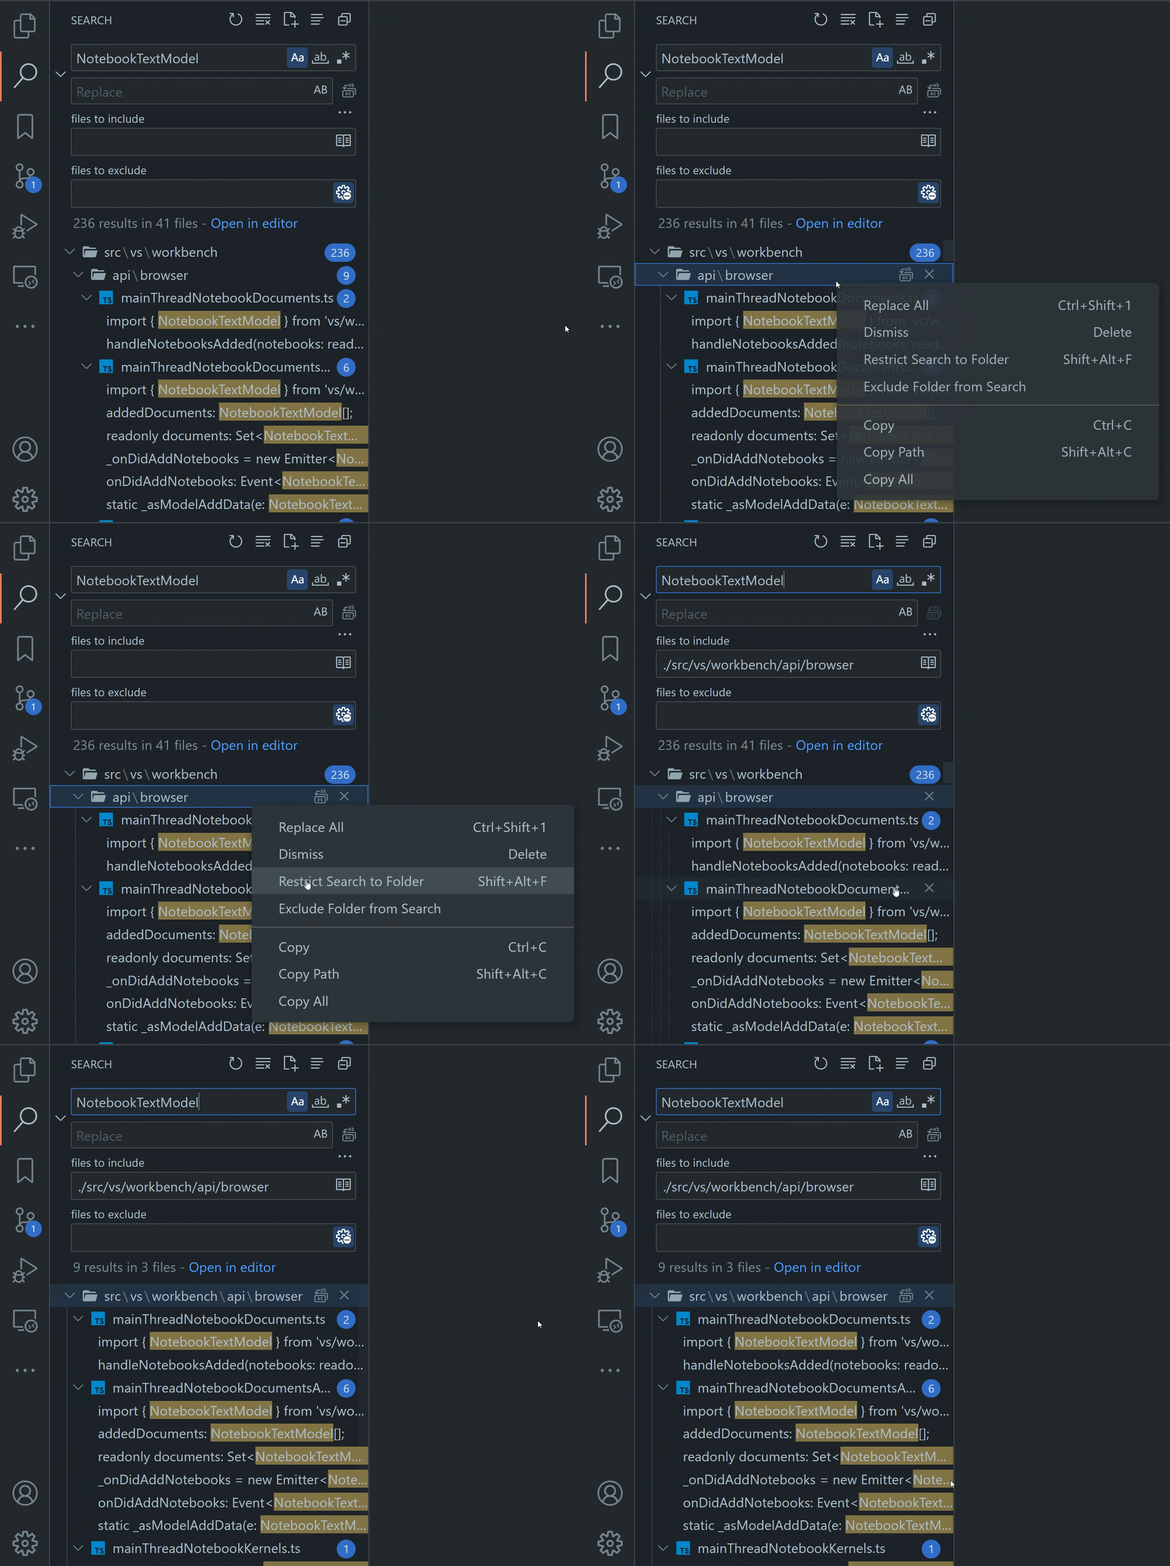
    Using Restrict Search to Folder

    Theme: GitHub Dark Dimmed (preview on vscode.dev)

  • Selecting Exclude Folder from Search adds the selected folder path(s) to the files to exclude textbox. Adding a path here will exclude any search results that fit the listed paths or patterns.
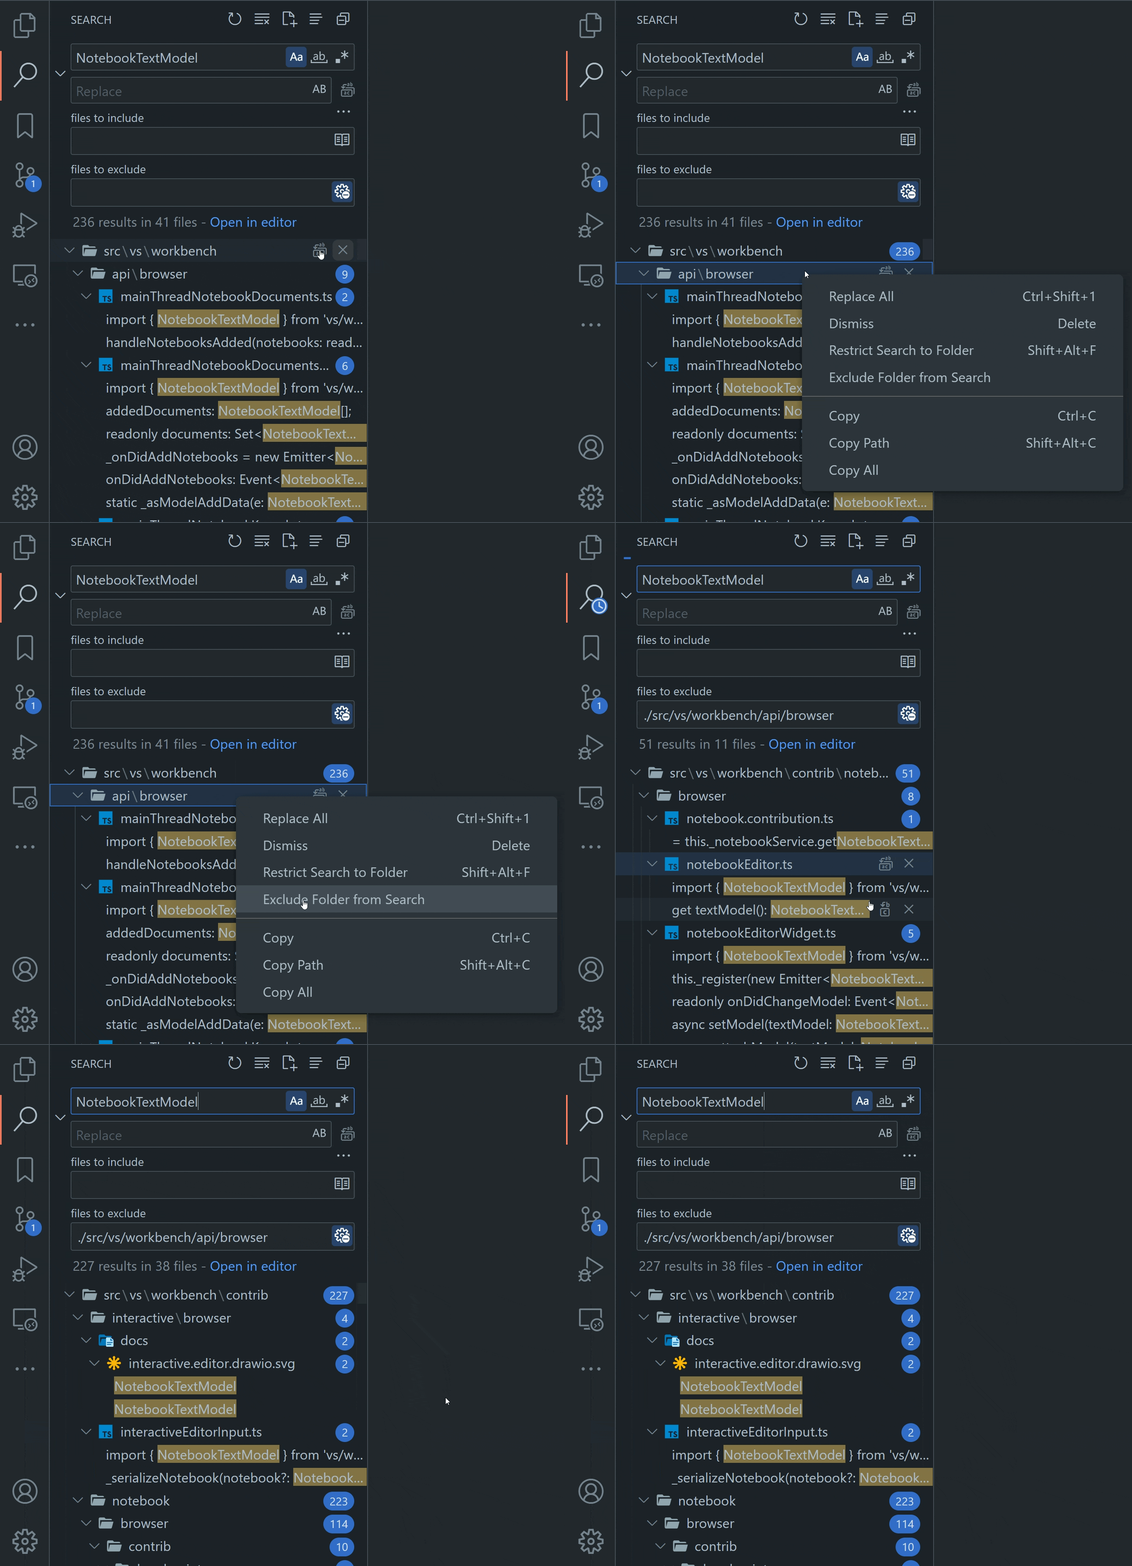
    Using Exclude Folder from Search

    Theme: GitHub Dark Dimmed (preview on vscode.dev)

Command Center mode shortcuts

A new top section was added to the Command Center to make it easy to discover how to navigate to files, run commands, and more.

This short list of modes also provides keybinding hints so that you can jump directly to your most-used modes (for example Go to File) without going through the Command Center.

The Command Center UI is not shown in the title bar by default but you can enable it via the Window: Command Center (window.commandCenter) setting or by right-clicking on the title bar and checking Command Center.

Settings editor Workspace Trust and policy indicators

Settings that are not applied due to a Restricted Mode workspace or due to being managed under an organization policy now use indicators to display their status. The user can read and write workspace settings even in a Restricted Mode workspace (which was always possible using the settings.json file), but the workspace setting value won’t be considered when calculating the final value of the setting to use in a restricted workspace.

There have also been a few adjustments to the default light theme, with clearer codicon rendering in the indicators area and tighter focus borders.
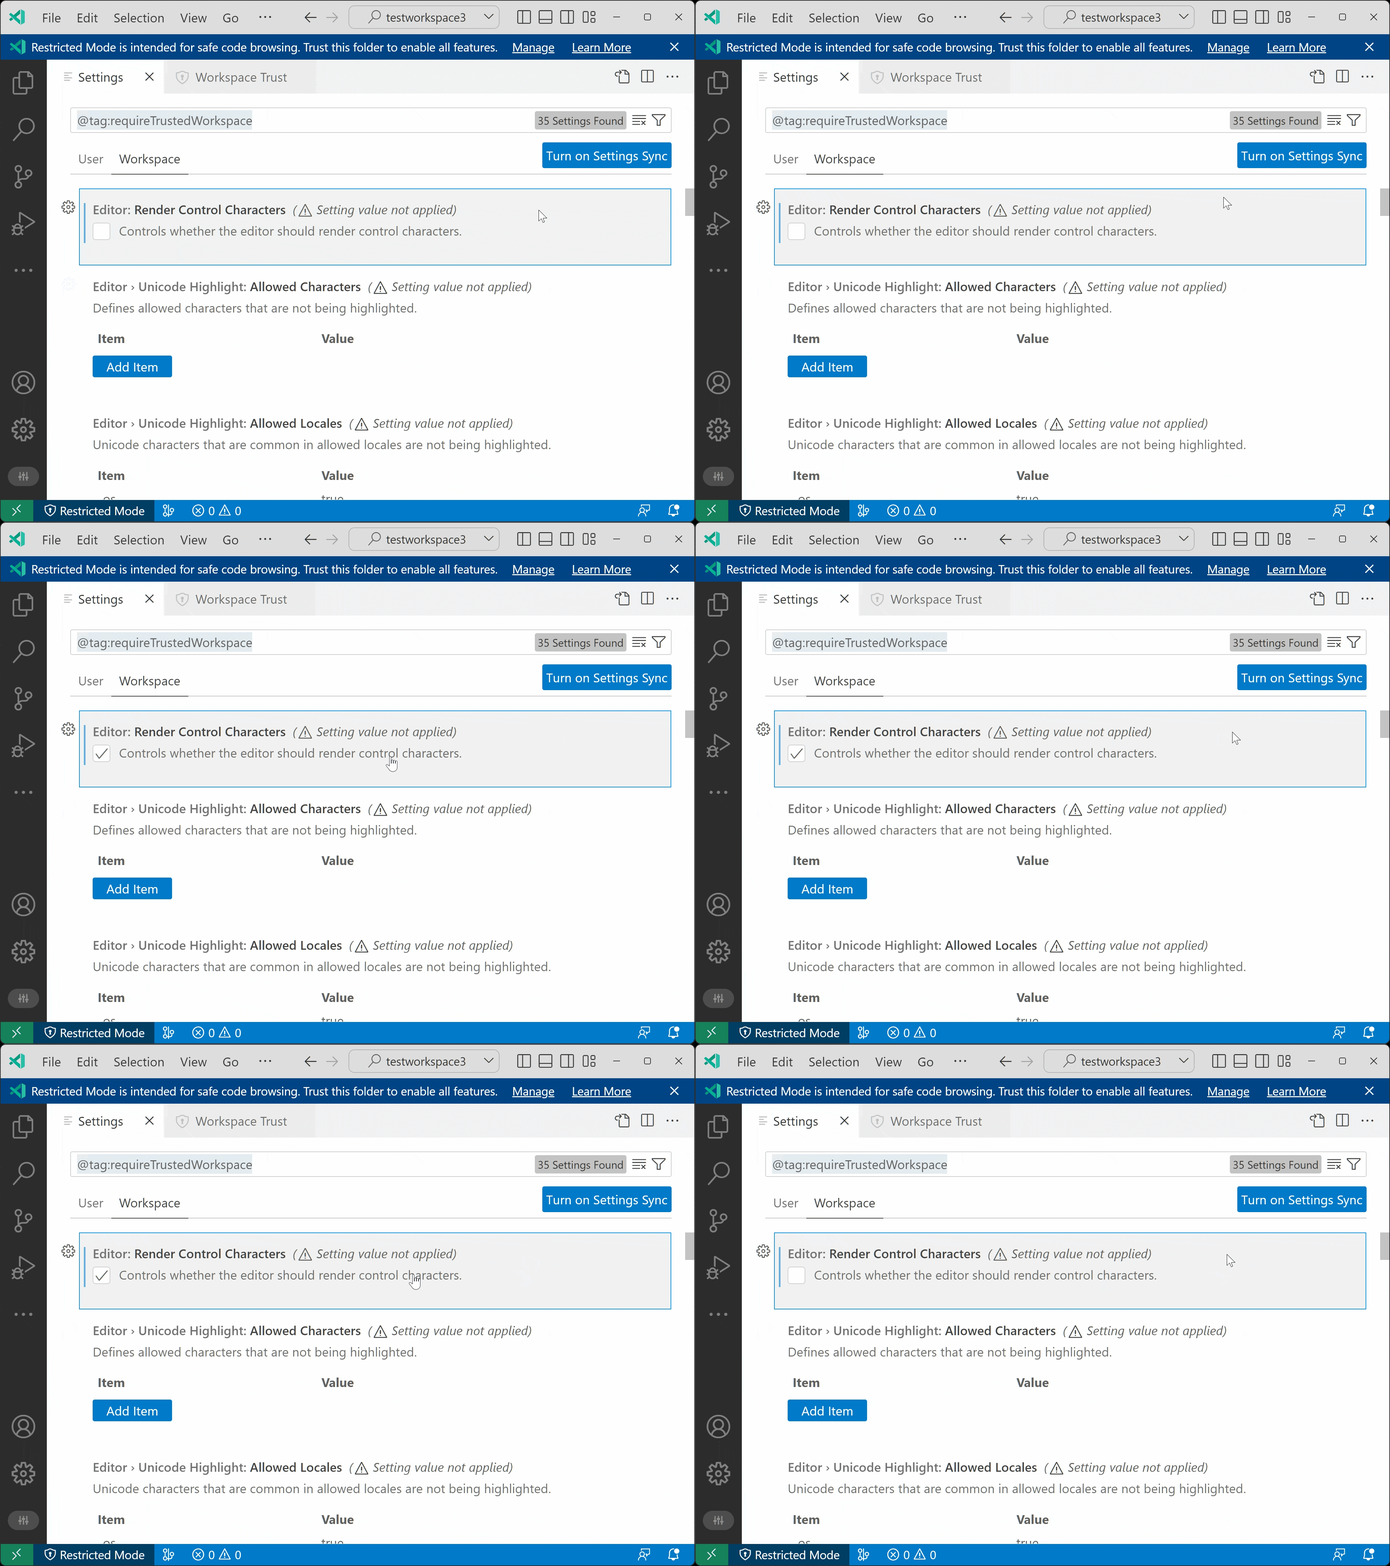
Restricted workspace settings demo showing keyboard navigation and toggling a checkbox even when the setting is restricted

Outline default collapse state

There is a new setting outline.collapseItems that controls the default collapse state of items in the Outline view. The default value is false, which means that Outline items are expanded by default. Set it to true to have Outline items collapsed by default. This setting can be set per language and also works for notebooks.

In the View menu of the VS Code menubar, the final group was a growing list of editor actions. As a means to balance growth of the menu and functionality, we have moved the primarily appearance-related items under the Appearance submenu. The Word Wrap and Sticky Scroll options have been left in their original positions at the bottom of the menu.
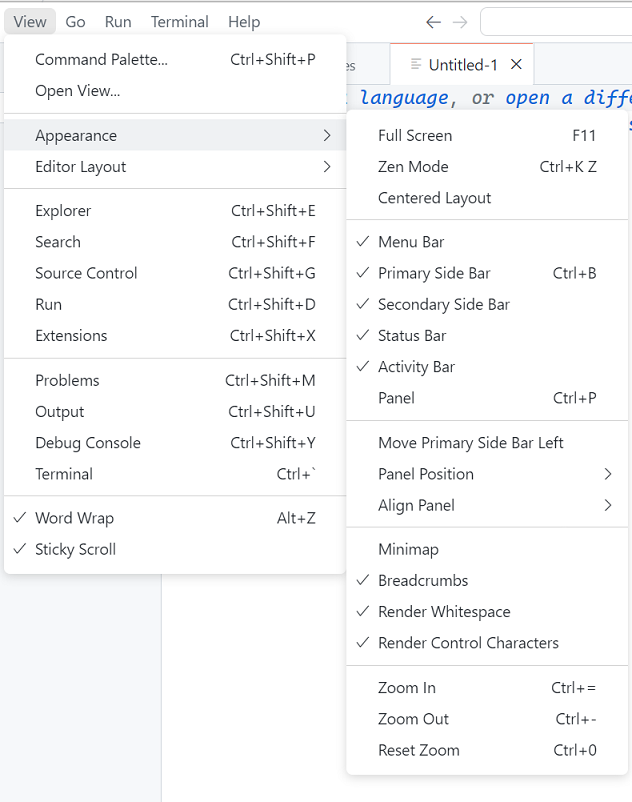
Updated View menu with Appearance submenu expanded

Theme: GitHub Light Default (preview on vscode.dev)

Rounded corners on input UI

Text inputs, text areas, and dropdowns all now display rounded corners to match the same styling applied to buttons in a previous release.
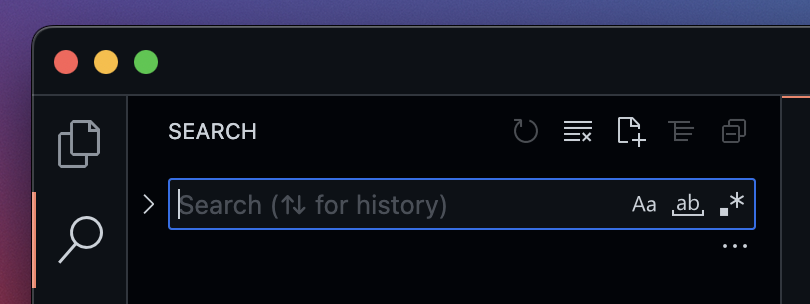
Text input with rounded corners in the Search input box

Quick Pick list style updates

The list styling used in the Quick Pick UI has been lightly refreshed with rounded corners and increased left/right margin.

Updated codicons for list views

Flat list and tree list views now use more legible codicons to represent the list type.

Secondary Side Bar foreground color

The Secondary Side Bar mimics the theming of the Primary Side Bar in general, but not all theme keys were being picked up properly. The Secondary Side Bar now properly uses the "sideBar.foreground" theme key.

Below both the Primary Side Bar on the right with the Explorer and Secondary Side Bar on the left with the Outline view are using the same pink foreground color.
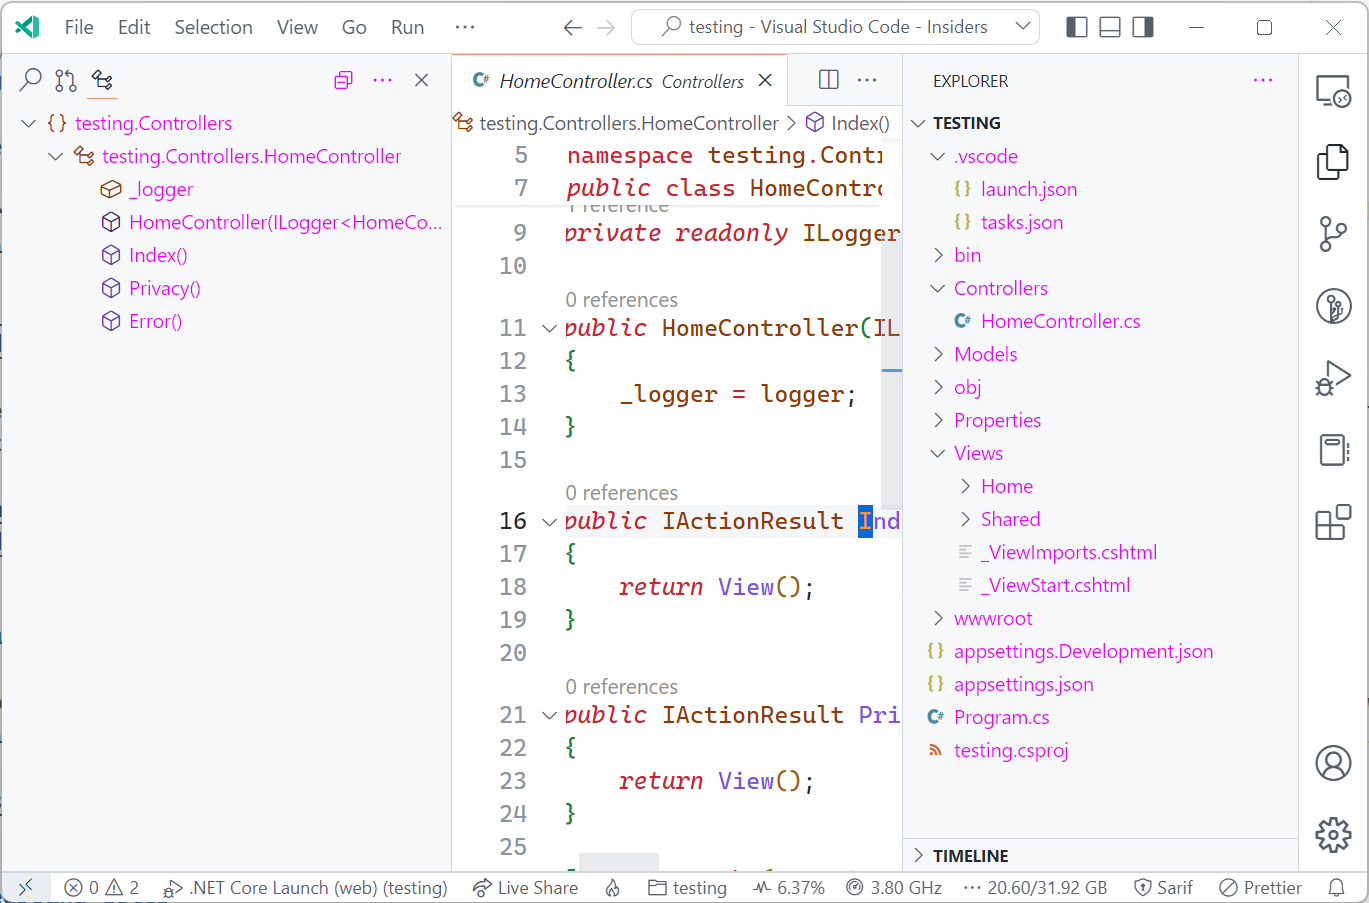
Secondary Side Bar with a pink foreground color matching the Primary Side Bar

Theme: GitHub Light Default (preview on vscode.dev)

No more ‘Too many folding ranges’ notifications

For performance reasons, we limit the number of folding ranges shown in the editor to 5000. The limit can be configured by the setting editor.foldingMaximumRegions. When the limit is exceeded, VS Code used to show a notification. Now the language status hover in the Status bar shows that information.

Folding limit warning in the language status

Default folding provider

Normally, when there are multiple folding providers active for a language, VS Core tries to merge the results. If there are conflicting ranges, some ranges are discarded. In addition, not all folding providers can be combined with others providers.

The new editor.defaultFoldingProvider setting allows you to select the folding provider to use. The name of the provider is the extension ID ({publisher}.{extension}) of the extension that contributes it.

The following example sets the folding provider from the (hypothetical) extension aeschli.better-folding to be the default for JavaScript.

    "[javascript]": {
            "editor.defaultFoldingRangeProvider": "aeschli.better-folding"
    }

Setting log level per output channel

You can now set log level per log output channel using the command Developer: Set Log Level…. This is useful when you want to see more logs only from a specific log output channel. The command will first show the list of output channels and after selecting one, you’ll be prompted to set the log level.
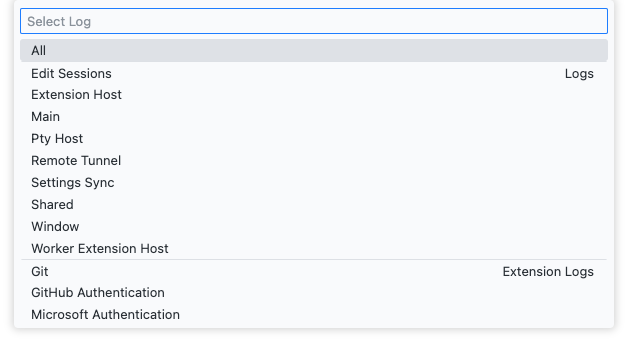
Developer: Set Log Level command dropdown list of output channels

You can also set log level per extension from the command line. This is useful when you want to see more logs from a specific extension. For example, the following script allows you to start VS Code with default log level set to debug for the log output channels from the Git extension.

code --log vscode.git:debug

New list.collapseAllToFocus tree view command

A new command list.collapseAllToFocus lets you recursively collapse the currently focused tree item. This is useful when you want to collapse all children of a tree item that isn’t the root. There isn’t a default keybinding for the command but you can add your own keyboard shortcut via the Keyboard Shortcut editor (⌘K ⌘S (Windows, Linux Ctrl+K Ctrl+S)).

Merge Editor

This milestone we continued polishing the merge editor and this update contains several bug fixes and some new features.

Accepting both sides appends conflicts

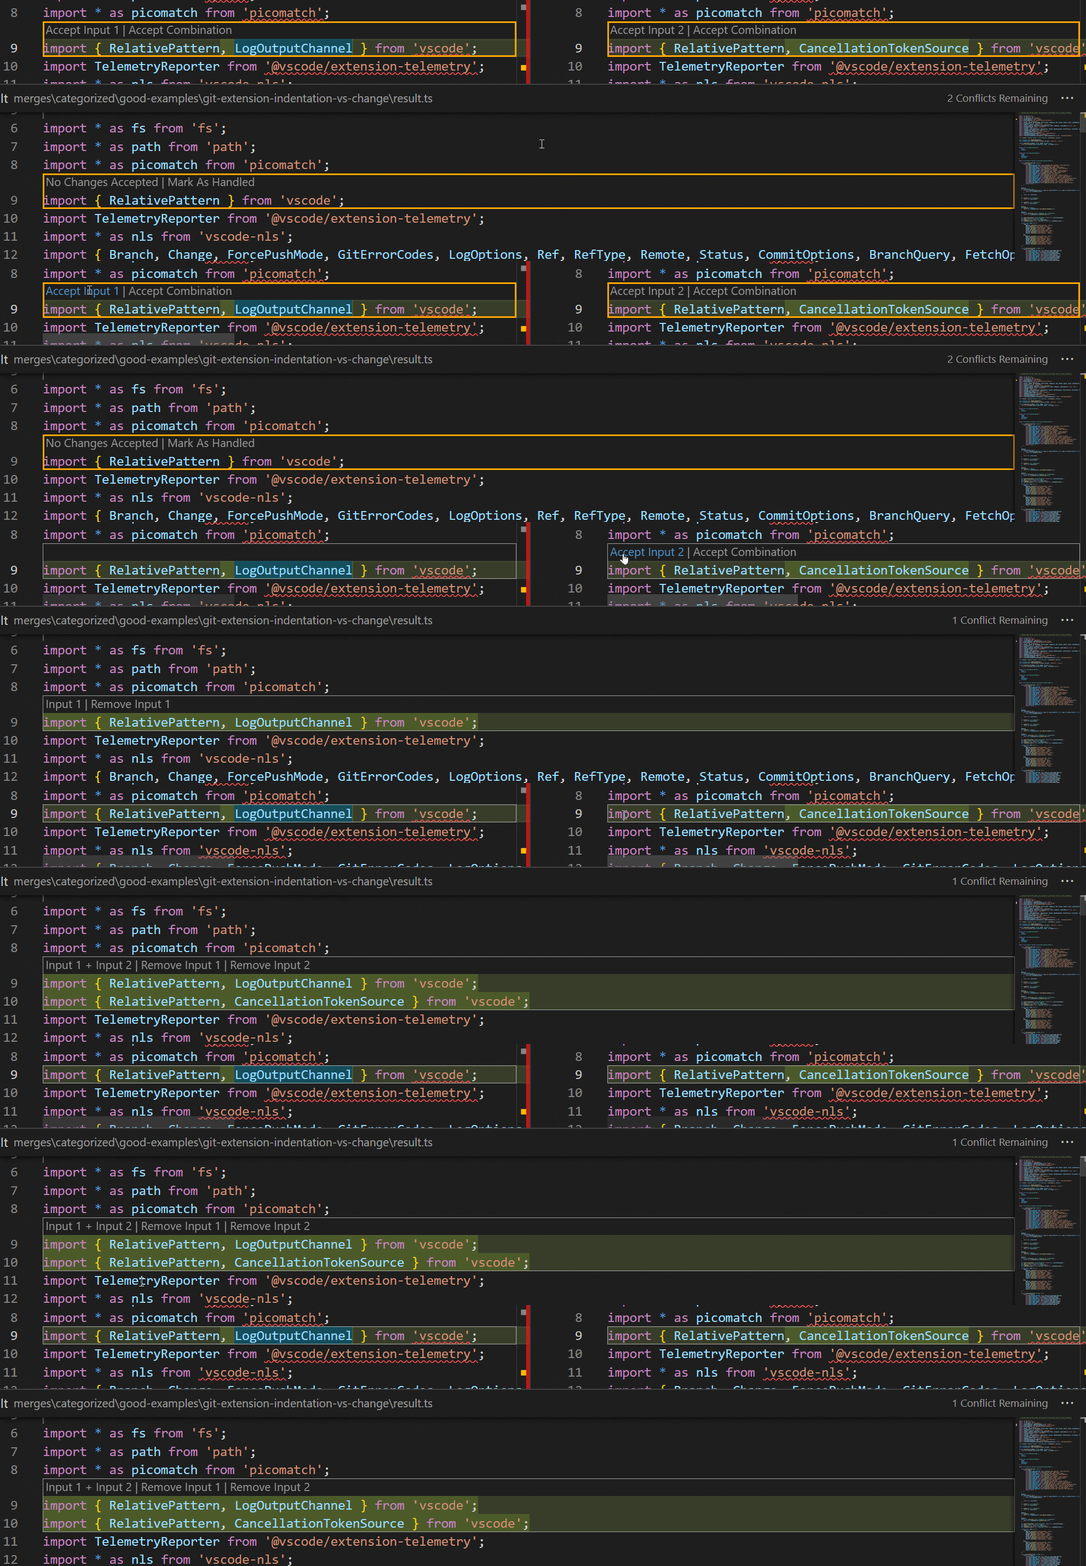
With this release, both Accept Incoming and Accept Current can always be selected. When both options are taken, the merge editor appends the corresponding changed lines.

In the short video below, RelativePattern is imported twice as both lines are accepted:
A screen recording of how both sides are accepted

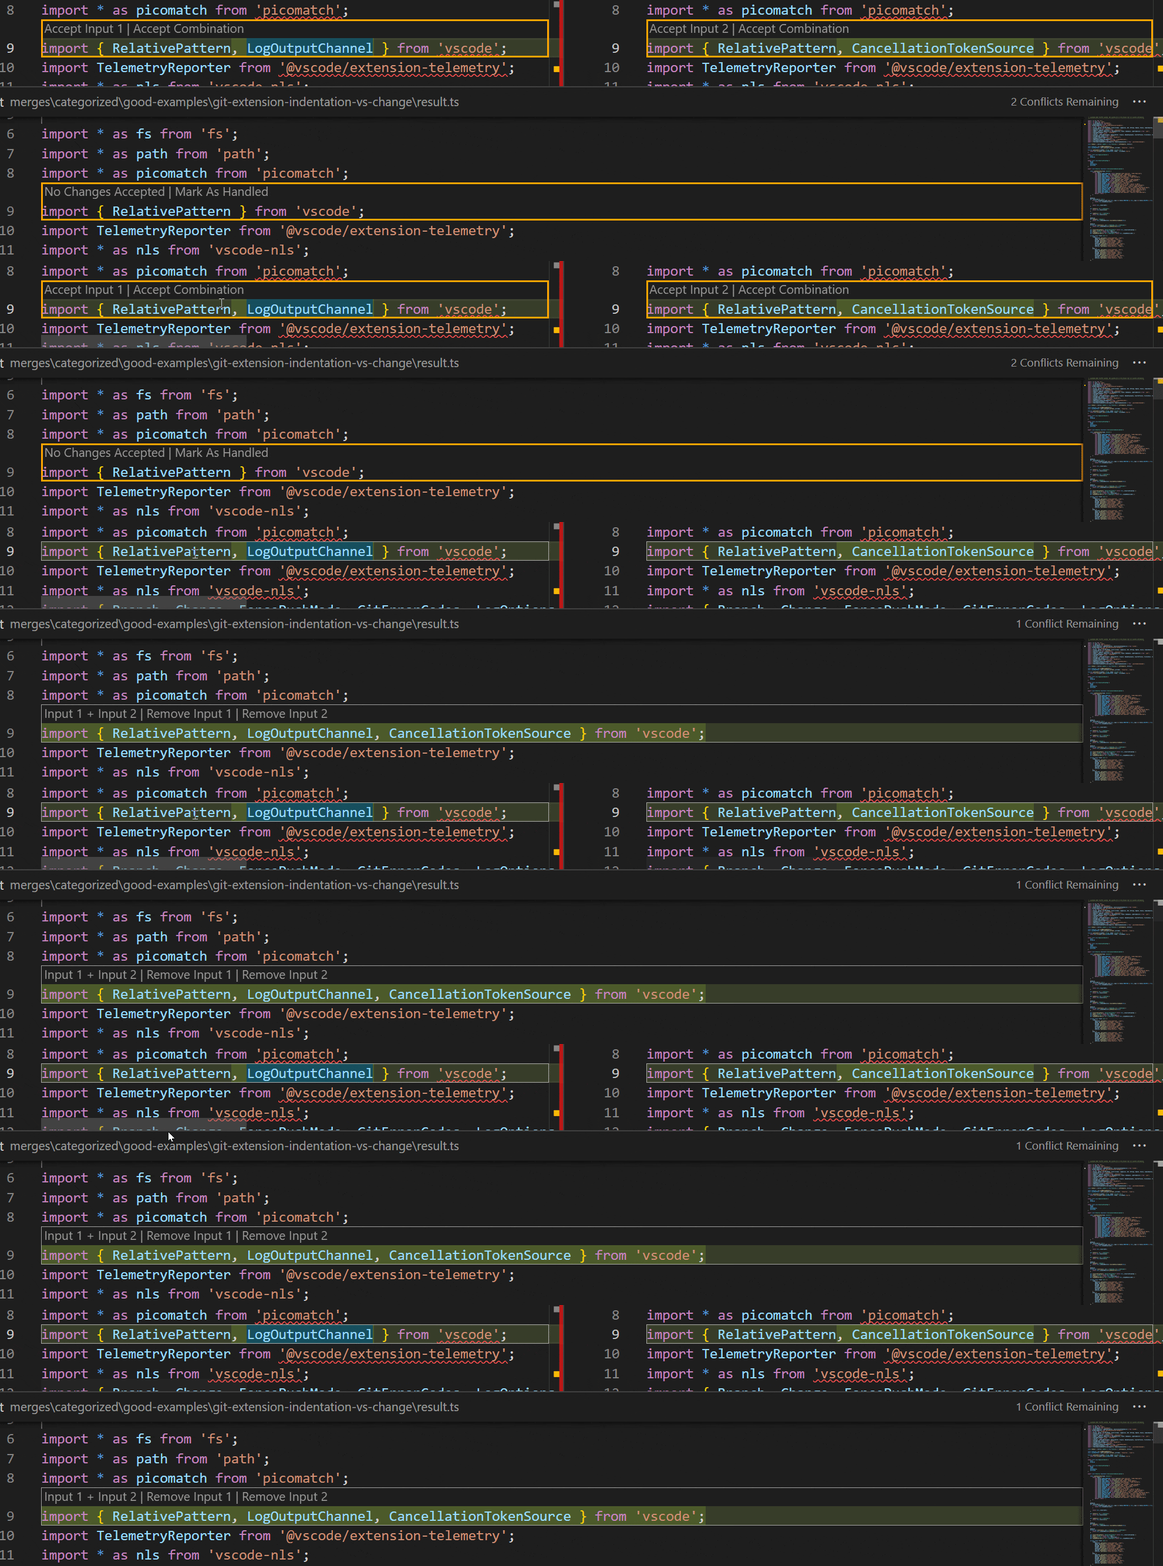
When the conflict can be resolved without conflicts on a character level, the option Accept Combination is shown, and can be used to automatically resolve the conflict.

In the video below, both symbols are imported into the same import statement:
A screen recording of how a combination is accepted

Diff decorations against base

When the base view is opened, a diff is shown between the currently focused side and base. This diff view can be used to better understand the changes in Incoming and Current.
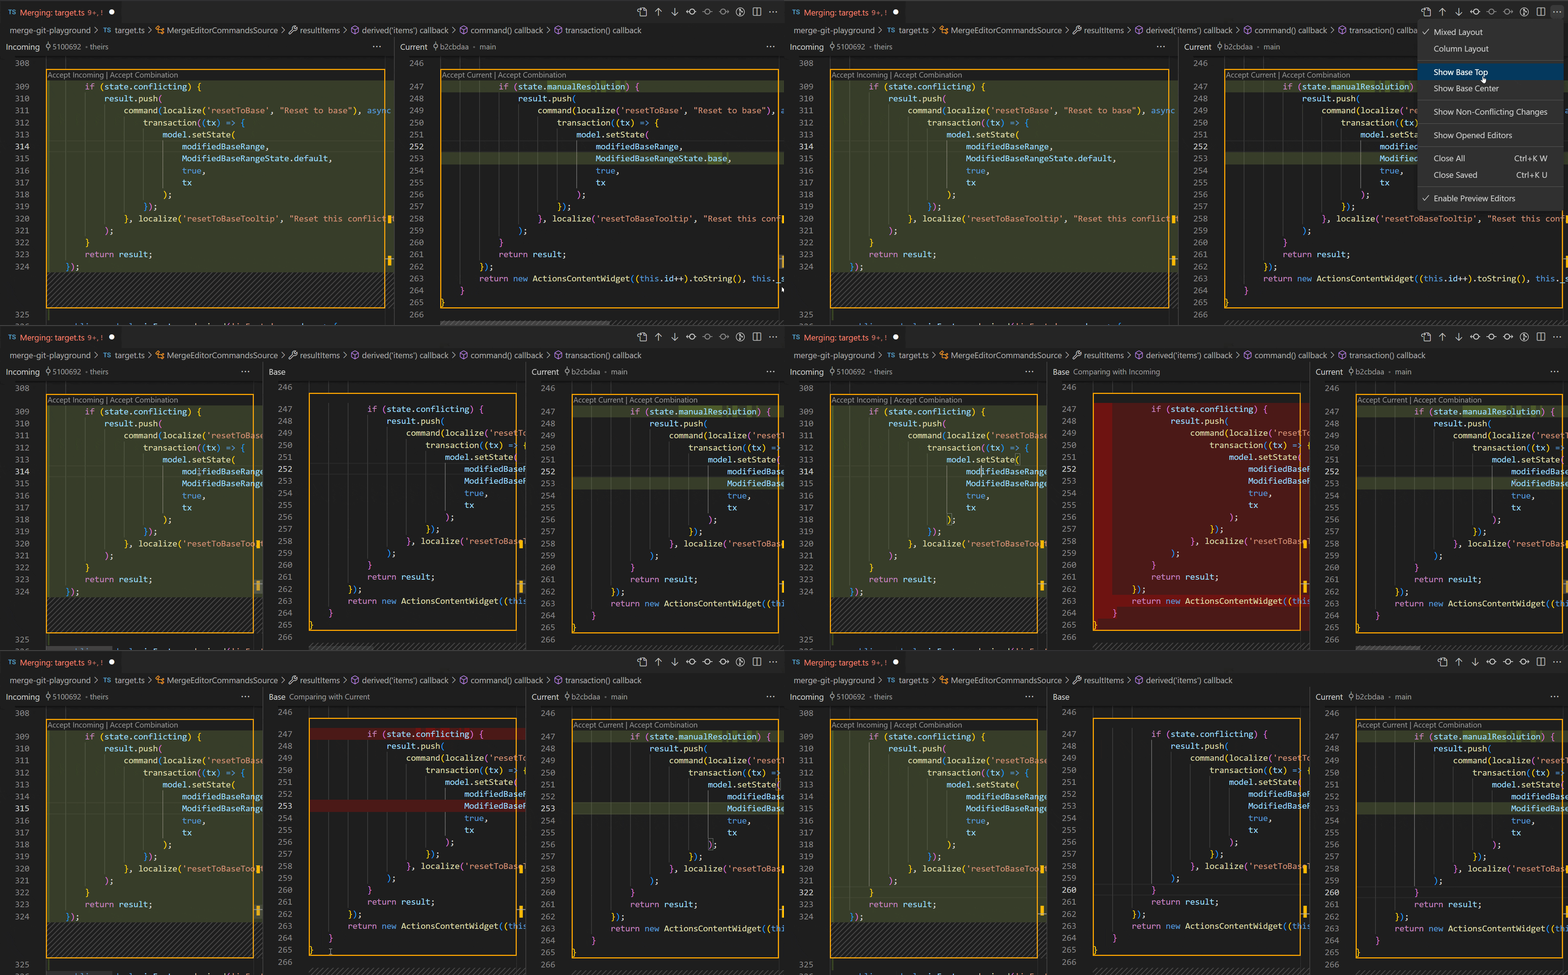
A screen recording of how a diff between incoming, current, and base is shown

Diff algorithm improvements

The default diff algorithm for the merge editor has been changed. The new diff algorithm is optimized for merge scenarios. In common cases, the number of hunks are minimized and insertion positions are optimized. In case the new algorithm causes problems, the setting "mergeEditor.diffAlgorithm": "smart" can be used to switch back to the previous algorithm (default is now experimental).

The following screenshots demonstrate the improvements for insertions. Note that both diffs are correct but the new behavior more clearly highlights the inserted text:

Old behavior:

The old behavior highlights across both the new and existing text

New behavior:

The new behavior highlights just the new text

The new diff algorithm is currently only enabled by default in the merge editor. You can set "diffEditor.diffAlgorithm": "experimental" if you’d like the regular diff editor to also use the new diff algorithm.

Navigate through conflicts

You can now click the conflict counter to jump to the next unhandled conflict:
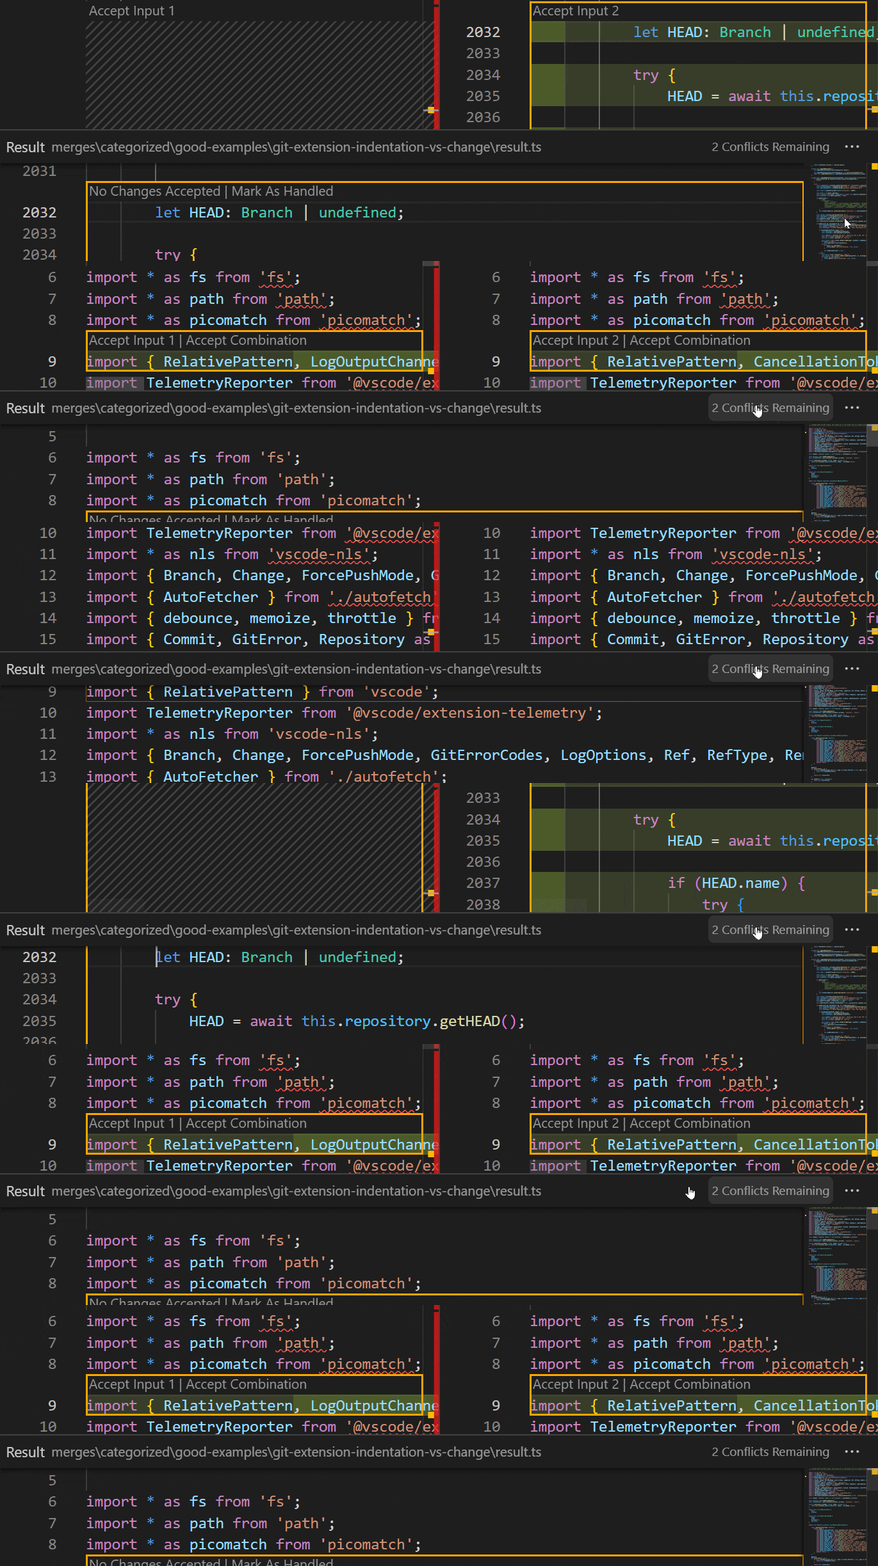
Clicking the conflict counter jumps to the next conflict

Languages

Tired of accidentally breaking links or images in your Markdown when you move or rename files? Try the new markdown.updateLinksOnFileMove.enabled setting!

With this new setting enabled, VS Code will automatically update links and images in Markdown when files are moved or renamed in the VS Code Explorer:
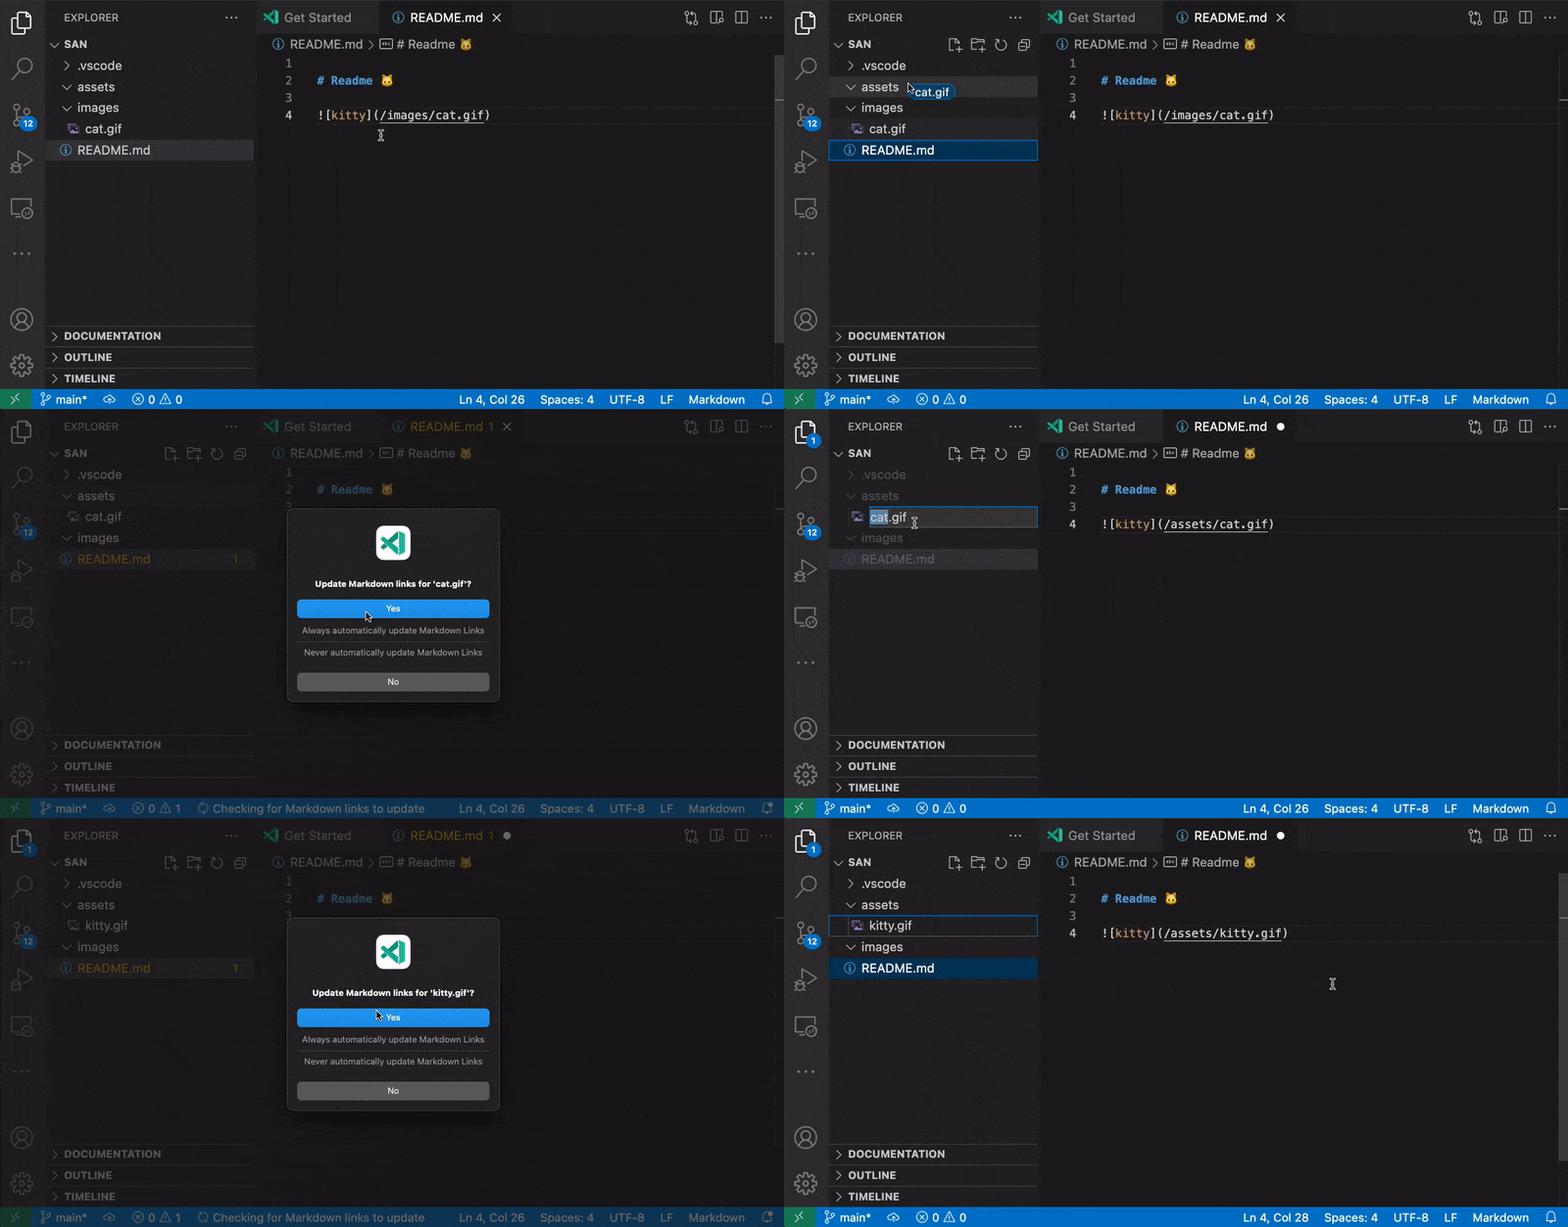
Markdown file links are updated on file move and rename

You can control the types of files affected using markdown.updateLinksOnFileMove.include. By default, it is enabled for all Markdown files and common image file formats.

The new Markdown: Insert Link to File in Workspace and Markdown: Insert Image from Workspace commands let you quickly insert links and images to your Markdown using a file picker:

Remember that these commands are just one option for adding links and images to your Markdown files. You can also use Markdown path completions for this or even drag and drop files from VS Code’s Explorer to insert links or images.

Our built-in Markdown validation can now alert you to unused or duplicated link definitions. You can enable this feature with markdown.validate.enabled:
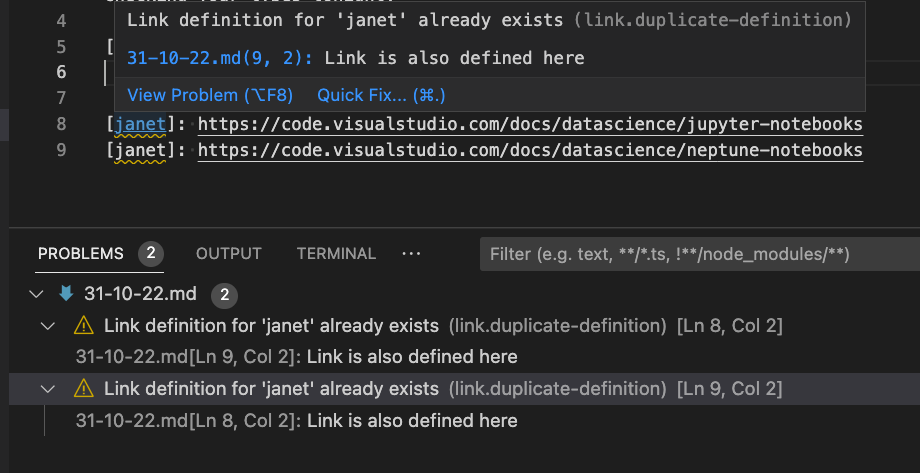
An warning about a duplicate link definition

If you want finer grained control of these errors, you can use these markdown.validate settings to either disable these errors (ignore) or change their severity (warning, error):

  • markdown.validate.duplicateLinkDefinitions.enabled
  • markdown.validate.unusedLinkDefinitions.enabled

There is also a Quick Fix to remove duplicated or unused link definitions.

Link occurrence highlighting in Markdown shows you all the places in the current document where the link under the cursor is being used:
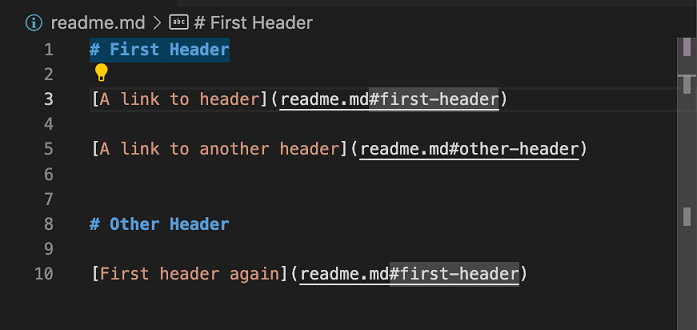
Highlighting all occurrences of a link

Notice how with the cursor on the the first link in the document, all links to First Header as well as the header itself are highlighted in the document and in the gutter to the right of the document.

This feature is off by default. To enable it, turn on the markdown.occurrencesHighlight.enabled setting.

New Razor syntax highlighting grammar

VS Code has a new, better-maintained, Razor grammar for syntax highlighting of Razor files. The new grammar is actively maintained and fixes issues that existed in the old grammar.

VS Code for the Web

Improved branch creation and protection workflows

When you are in a GitHub or Azure Repos repository on VS Code for the Web, committing to a protected branch now notifies you that the current branch is protected, and prompts you to create a new branch.

This flow will also honor the following settings:

  • git.branchPrefix allows you to prepopulate the branch name quick input with a configured prefix.
  • "git.branchProtectionPrompt": "alwaysCommitToNewBranch" allows you to skip the prompt when you attempt to commit to a protected branch and go straight to the quick input for creating a new branch.

In addition, when you create a new branch, you can bypass the prompt about whether to switch to the newly created branch by configuring "remoteHub.switchToCreatedBranch": "always".

All of the above also applies when using the GitHub Repositories or Azure Repos extensions on VS Code for the desktop.

Localization improvements in the web

A few months ago we started working on localization for VS Code for the Web. Up until now, VS Code core and extensions with statically declared strings in their extension manifests were able to be localized. This iteration, we’ve completed the final piece of the puzzle: strings in extension code. This was checked off due to the finalization of the localization API that we proposed last month.

Be on the lookout for more of VS Code becoming localized as we continue to adopt this new API in all of our extensions. If you’re an extension author, you can learn more about the new API in the vscode-l10n repository.

Contributions to extensions

Python

Migration to isort extension

In our May 2022 release, we announced a new isort extension that works alongside the Python extension to sort imports. For example, when you open a file and the imports do not follow isort standards, it will display an error diagnostic and provide a Code Action to fix the import order. In this release, we are migrating to use the standalone isort extension instead of the isort support built into the Python extension by automatically installing it alongside the Python extension.

Auto imports turned off by default with Pylance

Since auto imports were first implemented in Pylance, we’ve been getting a lot of feedback about how confusing and, sometimes, annoying it can be to have an import automatically added to a file when, for example, suggestions are accepted by accident. Starting this release, packages will no longer be imported automatically by default when using Pylance. If you’d like to re-enable auto imports for your Python projects, you can do so by setting "python.analysis.autoImportCompletions": true.

Pylint and Flake8 extensions recommendation

In our previous releases, we announced new Pylint and Flake8 extensions that work in tandem with the Python extension through the Language Server Protocol (LSP) to provide linting. In this release, we display a notification if you are still using the Pylint and Flake8 features built into the Python extension, prompting you to install these new extensions.
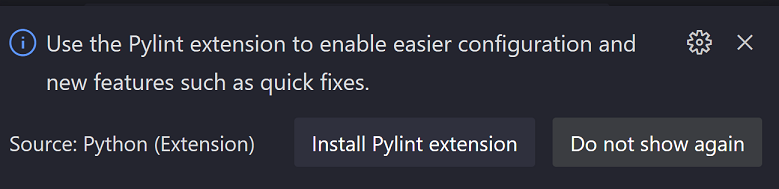
A notification recommending the Pylint extension with a button to install it

Remote Development

The Remote Development extensions, allow you to use a container, remote machine, or the Windows Subsystem for Linux (WSL) as a full-featured development environment. Highlights of this release include:

  • Dev Container Templates – Quickly create a Dev Container based on an existing template.
  • Dev Container Features – Add capabilities to a Dev Container by including prepackaged features (or create your own!)
  • Create new Dev Container without a starting folder.

You can learn about new extension features and bug fixes in the Remote Development release notes.

GitHub Pull Requests and Issues

Work continues on the GitHub Pull Requests and Issues extension, which allows you to work on, create, and manage pull requests and issues. Check out the changelog for the 0.54.0 release of the extension to see the other highlights.

Preview features

TypeScript 4.9

This update includes support for the upcoming TypeScript 4.9 release. See the TypeScript 4.9 iteration plan for more details on what the TypeScript team is currently working on. Some editor tooling highlights:

To start using the TypeScript 4.9 nightly builds, install the TypeScript Nightly extension.

Settings Profiles

We have been working the last couple of months to support Settings Profiles in VS Code, which is one of the most popular asks from the community. This feature is available for preview via the workbench.experimental.settingsProfiles.enabled setting. Try it out and give us your feedback by creating issues in the vscode repository or commenting in issue #116740.

Showing Synced Profiles Data

You can now see the data that is synced for each profile in the Sync Activity (Remote) view. This is useful to understand what data is synced for each profile.
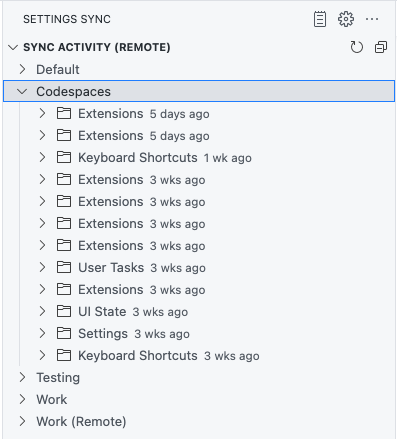
Sync Activity (Remote) view showing history of Profiles

Note: This feature is currently available only in the Insiders release of VS Code.

Extension authoring

Provide metadata for workspace edits

The API to apply a workspace edit now lets extensions provide metadata, for example for marking the edit as being a refactoring. This extra metadata will be honored by the editor and Auto Save after refactoring (setting: files.refactoring.autoSave).

Restrict which commands can be run by MarkdownString and in webviews

Command links in MarkdownString are a useful way to create custom interactions in VS Code’s hovers message or IntelliSense details. Webviews can also use command links to trigger VS Code commands directly from the webview. However, command links can also be dangerous as they can be used to execute any command, including many commands that were not designed with security in mind. For this reason, command links are disabled by default and must explicitly be enabled by extensions.

While this all-or-nothing approach works, we’ve also found it places too much of the security burden on extension authors. Extensions that need to use command links must validate that only safe commands are included in the content they render. This is both easy to forget and easy to get wrong.

To improve this, we’re introducing new APIs for command link enablement that allow extensions to enable just a trusted subset of commands.

For MarkdownString, the isTrusted property now takes an allowlist of commands that can be executed (all other commands will be blocked):

const md = new vscode.MarkdownString(
  `A command link: [Open setting](command:workbench.action.openSettings)`
);

// Set trusted commands instead of enabling all commands
md.isTrusted = { enabledCommands: ['workbench.action.openSettings'] };

For webviews, the WebviewOptions.enableCommandUris property can now be a list of enabled commands instead of a simple true/false:

const options: vscode.WebviewOptions = {
  enableCommandUris: ['workbench.action.openSettings']
};

We highly encourage that all extension that use command links adopt this new, more restrictive API to improve security.

Consistent origin for webviews and webview views

To improve the loading time of webviews, we now try to maintain a consistent origin for all instances of a given type of webview. This has two main benefits:

  • Webviews can better take advantage of caching. This means local resources should load faster.

  • Webviews can use local storage and other web APIs that are partitioned per origin.

    Keep in mind that all instances of a webview will now run on the same origin so if they are using an API such as local storage, be sure to partition any data/state that is document specific per resource. For example, localStorage.setItem('scrollPosition', 100) will set scrollPosition to 100 across all webview instances. If you want to set the scroll position for individual resources, you also need to include the resource ID in the key: localStorage.setItem(myDocUri, JSON.stringify({scrollPosition: 100 })).

    You should also never use localStorage or similar APIs to store critical data, such a document contents. While VS Code makes a best effort to maintain a consistent origin for webviews, we cannot guarantee the origin will not change.

    In many cases, you should use the webview state APIs as these APIs handle both of the above problems for you.

The origin is randomly generated for each extension and type of webview. The same origin is used across all instances of the webview.

Currently both normal webviews and webview views try to maintain a consistent origin. We plan on adopting this for custom editors and notebook webviews next iteration.

Debug Adapter Protocol

New ‘startDebugging’ reverse request

Today VS Code supports multiple concurrent debug sessions but the Debug Adapter Protocol (DAP) covers only a single session. That means that creating new debug sessions programmatically is not part of DAP and can only be done outside of DAP or the debug adapter, typically in the debug extension that contains the debug adapter. As a consequence, multi-session functionality such as automatically debugging child-processes is not easily available for non-VS Code DAP clients, because they typically only use the debug adapter and not the VS Code specific debug extension.

To improve this situation, we have added a new reverse request startDebugging to DAP that allows extensions to create a new debug session (of the same type as the caller) from within the debug adapter. A client capability supportsStartDebuggingRequest indicates to a debug adapter that the client supports startDebugging.

In the October release, VS Code has implemented startDebugging.

Proposed APIs

Every milestone comes with new proposed APIs and extension authors can try them out. As always, we want your feedback. Here are the steps to try out a proposed API:

  1. Find a proposal that you want to try and add its name to package.json#enabledApiProposals.
  2. Use the latest vscode-dts and run vscode-dts dev. It will download the corresponding d.ts files into your workspace.
  3. You can now program against the proposal.

You cannot publish an extension that uses a proposed API. There may be breaking changes in the next release and we never want to break existing extensions.

Static notebook preloads

The new notebookPreload proposed contribution point lets extensions contribute scripts that are loaded into notebooks of a specific type.

{
    "contributes": {
        "notebookPreload": [
            {
                "type": "jupyter-notebook", // Type of notebook for the preload script
                "entrypoint": "./path/to/preload.js"
            }
        ]
    }
}

This contribution point is controlled by the contribNotebookStaticPreloads API proposal. Extensions can use preloads to load or define globals in the notebook JavaScript environment.

The preload script must be a JavaScript module that exports an activate function. All preloads are evaluated before any renderer scripts.

Notebook renderers can access all output items

Custom notebook renderers can now access all MIME data of the output item it is rendering. If the renderer determines that it cannot render the main output item properly, this API proposal lets it fall back to render one of the other MIME types instead.

The entrypoint of this proposal is a new OutputItem._allOutputItems property. The property is an ordered list of all MIME types that the current output item contains. Each item in the list has the shape { mime, getItem() }. mime is the MIME type such as text/html or image/png, while the getItem() function returns a promise to an OutputItem for that MIME type.

Here’s how a renderer can use this new API:

async function renderOutputItem(outputInfo, element, signal) {
  const didRender = tryRenderMainItem(outputInfo, element);

  if (!didRender) {
    // Fallback to render `text/html`
    const htmlItem = await outputInfo._allOutputItems
      .find(item => item.mime === 'text/html')
      ?.getItem();
    if (htmlItem) {
      // Here we can either render the 'text/html' item ourselves
      // or delegate to another renderer.
      const renderer = await ctx.getRenderer('vscode.builtin-renderer');
      if (renderer) {
        return renderer.renderOutputItem(htmlItem, element, signal);
      }
    }
  }
}

Give this proposal a try and let us know what you think!

Extension telemetry API

To further drive telemetry best practices and enhance the telemetry features extensions have offered to them, this iteration introduces the proposed telemetryLogger API. This API allows extension to supply a TelemetryAppender, which acts as the core sending logic (implemented utilizing Application Insights or another data recording service). This TelemetryAppender is then used to instantiate a TelemetryLogger, which is the class that you should log telemetry through.

The TelemetryLogger provides a shared output channel to see sent telemetry events, proper telemetry setting checks, and personally identifiable information cleaning. Additionally, any errors thrown by utilizing the VS Code API will be logged to your appender for better error diagnostics.

There is a simple example in the telemetry sample and you can provide feedback in issue #160090.

Log output channel

In the last milestone, we introduced the LogOutputChannel API proposal for creating an output channel that is only used for logging. This iteration, we added logLevel property and onDidChangeLogLevel event to it. The logLevel property represents the current log level of the output channel and the onDidChangeLogLevel event is fired when the log level changes for the output channel.

/**
 * A channel for containing log output.
 */
export interface LogOutputChannel extends OutputChannel {

    /**
     * The current log level of the channel.
     * Defaults to application {@link env.logLevel application log level}.
     */
    readonly logLevel: LogLevel;

    /**
     * An {@link Event} which fires when the log level of the channel changes.
     */
    readonly onDidChangeLogLevel: Event<LogLevel>;
    ...
    ...
}

We also added logLevel property and onDidChangeLogLevel event to env namespace to represent the current log level of the application and the event is fired when the log level changes for the application.

export namespace env {
  /**
   * The current log level of the application.
   */
  export const logLevel: LogLevel;

  /**
   * An {@link Event} which fires when the log level of the application changes.
   */
  export const onDidChangeLogLevel: Event<LogLevel>;
}

Engineering

Optimizing for input latency

As VS Code has grown in size, so has the amount of activity when a keystroke is pressed. This iteration we stepped back and did a thorough investigation into what exactly happens when you type in the editor and what can we defer until after the keystroke is rendered on screen. The main outcomes of this exploration were:

  • Several changes were made to defer as much work as possible until after a keystroke in the editor has been rendered on screen. A rough estimate of the impact of this is a ~15% reduction in input latency when IntelliSense is not showing, and an even higher reduction when IntelliSense is being refiltered.
  • We now have more refined techniques for manually measuring input latency and optimizing at this sub-millisecond* level.
  • There is a work-in-progress change that will help us track and report samples of input latency. This will give us some concrete numbers to maintain and improve against.

This is just the beginning of this effort and we have more changes that should land next release.

* These numbers are very dependent upon the hardware that is used to test. A 0.5-ms improvement on powerful hardware may end up being 2ms on more average hardware.

Automatic renderer profiling

The renderer-process of VS Code is responsible for its UI; it ensures a blinking cursor, the ability to type, and to save. Any performance issue in the renderer-process will be visible to the user and result in a bad experience. To help us identify and fix performance issues in the renderer-process, we have added a new setting application.experimental.rendererProfiling that can be used to automatically profile the renderer-process. The setting can be set to on to enable profiling, and off to disable profiling. When enabled, the renderer-process will be profiled for a few seconds whenever it “appears as pressured”, and the profile is then analyzed, anonymized, and sent off for inspection. You can use the window log to follow along with the profiling process.

Note that this feature is currently off by default as we still learn and tune things. Please try it out and let us know what you think.

In this release, VS Code setup is adding an Open with Code – Insiders context menu entry to Windows 11 context menu for Insiders by default. For users, who had previously opted into the context menu when installing the Insiders, the entry that would show up in the old style menu Shift + F10 will now be replaced with the newer entry when updating to the latest Insiders. For others, you would need to reinstall Insiders and opt-in to enable this menu entry in the setup wizard. Due to issues we encountered during development of the menu entry, we plan to limit this feature to Insiders for a couple of milestones to gain confidence before we push it out to the Stable release for all Windows 11 users.
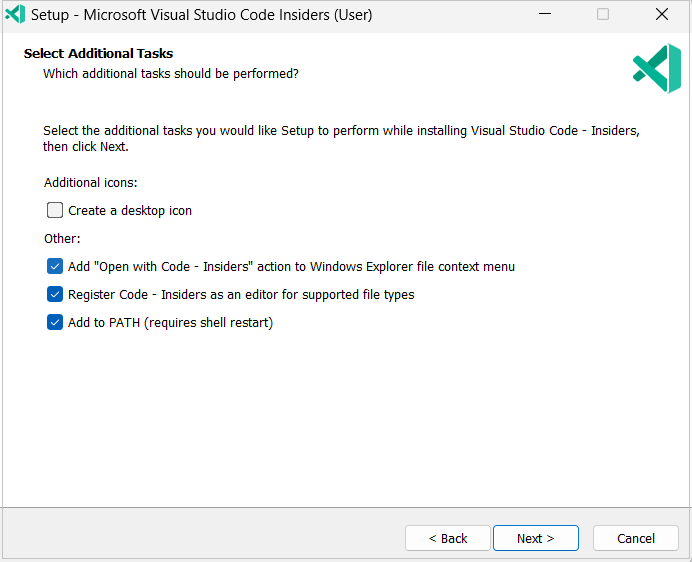
VS Code Install dialog with option to add Open with Code - Insiders action

The Open with Code Insiders action will then be available in Windows File Explorer folder and file context menus.
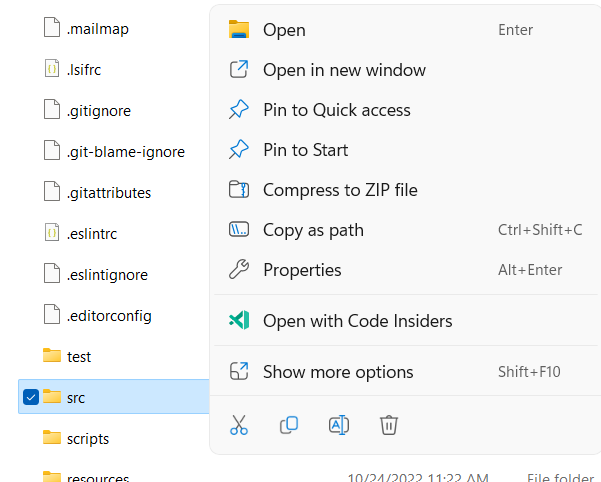
Windows 11 folder context menu

Notable fixes

  • 151019 Debug hover is hiding when hovered
  • 153852 Proposal: Remove ES5 Class Compatibility to speed up Extension APIs
  • 156104 Don’t auto-forward port on url link click, if it’s already statically forwarded
  • 158921 Settings Modified Elsewhere indicator hover content overflows

Thank you

Last but certainly not least, a big Thank You to the contributors of VS Code.

Issue tracking

Contributions to our issue tracking:

Contributions to vscode:

Contributions to vscode-pull-request-github:

Contributions to vscode-dev-chrome-launcher:

Scientists Turn to Radioactive Isotopes in the Fight Against Rhino Poaching


Scientists are testing a new strategy to stave off rhinoceros poaching. By injecting rhino horns with radioactive isotopes, they hope to make the rhinos’ most in-demand assets unfit for human consumption. If poached, the horns will set off an alarm at international border crossings, alerting law enforcement to travelers involved in the illegal wildlife trade.

The University of the Witwatersrand in Johannesburg, South Africa shared Tuesday that its Radiation and Health Physics Unit (RHPU) is spearheading the aptly named Rhisotope Project. The project may have officially debuted this week, but scientists have spent the last three years working behind the scenes to develop a low-dose radioisotope insertion method that won’t harm the rhinos. They settled on radioisotopes that emit gamma rays as they transform into more stable forms of their respective elements. These gamma rays don’t cause any harm to the animals or those who interact with them. But if someone were to consume the radioisotopes, they wouldn’t have a very good time

Researchers use tweezers to place a small capsule in the hole of a rhino's horn.


Credit: University of the Witwatersrand/Rhisotope Project

“The dose levels being considered for use in this project are only slightly higher than the upper end of what people are exposed to by background radiation that occurs from naturally radioactive elements in the Earth and from the cosmos (cosmic radiation from outside the Earth’s atmosphere),” according to the Rhisotope Project. The site goes on to explain that the RHPU calculated the appropriate radioisotope quantities using computer modeling and “phantoms,” or full-scale models of the rhinos’ heads that allow for physical exposure simulations. 

In a YouTube video published by the RHPU (above), wildlife ecologists sedate an adult rhino and then drill a small hole in the rhino’s horn. While one researcher holds the rhino’s head, another uses tweezers to place a tiny capsule inside the drilled hole and then secure the capsule with glue. Those involved in the Rhisotope Project plan to repeat this process with 20 rhinos and then monitor their animal subjects for six months on a 24-hour basis. If a poacher obtains one of the experimental rhino horns, the radioisotopes will trigger nuclear security sensors at the airports, harbors, and land-crossings on South Africa’s borders. 

Rhino horns are a significant part of a $22 billion global black market wildlife trade due to their use as status symbols and in certain traditional medicine practices. Wildlife ecologists have tried to mitigate rhino poaching through several creative strategies, from removing rhinos’ horns to giving rhinos human bodyguards. While fairly effective, these methods have severe drawbacks regarding rhinoceros behavior and human safety. The Rhisotope Project’s strategy could meanwhile work passively to deter poaching while taking advantage of existing nuclear security infrastructure. 

If the Rhisotope Project is deemed successful after six months, the researchers will test their radioisotope capsules with other common poaching targets, such as elephants and pangolins.

OpenAI’s new “CriticGPT” model is trained to criticize GPT-4 outputs


An illustration created by OpenAI.
Enlarge / An illustration created by OpenAI.

On Thursday, OpenAI researchers unveiled CriticGPT, a new AI model designed to identify mistakes in code generated by ChatGPT. It aims to enhance the process of making AI systems behave in ways humans want (called “alignment”) through Reinforcement Learning from Human Feedback (RLHF), which helps human reviewers make large language model (LLM) outputs more accurate.

As outlined in a new research paper called “LLM Critics Help Catch LLM Bugs,” OpenAI created CriticGPT to act as an AI assistant to human trainers who review programming code generated by the ChatGPT AI assistant. CriticGPT—based on the GPT-4 family of LLMS—analyzes the code and points out potential errors, making it easier for humans to spot mistakes that might otherwise go unnoticed. The researchers trained CriticGPT on a dataset of code samples with intentionally inserted bugs, teaching it to recognize and flag various coding errors.

The researchers found that CriticGPT’s critiques were preferred by annotators over human critiques in 63 percent of cases involving naturally occurring LLM errors and that human-machine teams using CriticGPT wrote more comprehensive critiques than humans alone while reducing confabulation (hallucination) rates compared to AI-only critiques.

Developing an automated critic

The development of CriticGPT involved training the model on a large number of inputs containing deliberately inserted mistakes. Human trainers were asked to modify code written by ChatGPT, introducing errors and then providing example feedback as if they had discovered these bugs. This process allowed the model to learn how to identify and critique various types of coding errors.

In experiments, CriticGPT demonstrated its ability to catch both inserted bugs and naturally occurring errors in ChatGPT’s output. The new model’s critiques were preferred by trainers over those generated by ChatGPT itself in 63 percent of cases involving natural bugs (the aforementioned statistic). This preference was partly due to CriticGPT producing fewer unhelpful “nitpicks” and generating fewer false positives, or hallucinated problems.

The researchers also created a new technique they call Force Sampling Beam Search (FSBS). This method helps CriticGPT write more detailed reviews of code. It lets the researchers adjust how thorough CriticGPT is in looking for problems while also controlling how often it might make up issues that don’t really exist. They can tweak this balance depending on what they need for different AI training tasks.

Interestingly, the researchers found that CriticGPT’s capabilities extend beyond just code review. In their experiments, they applied the model to a subset of ChatGPT training data that had previously been rated as flawless by human annotators. Surprisingly, CriticGPT identified errors in 24 percent of these cases—errors that were subsequently confirmed by human reviewers. OpenAI thinks this demonstrates the model’s potential to generalize to non-code tasks and highlights its ability to catch subtle mistakes that even careful human evaluation might miss.

Despite its promising results, like all AI models, CriticGPT has limitations. The model was trained on relatively short ChatGPT answers, which may not fully prepare it for evaluating longer, more complex tasks that future AI systems might tackle. Additionally, while CriticGPT reduces confabulations, it doesn’t eliminate them entirely, and human trainers can still make labeling mistakes based on these false outputs.

The research team acknowledges that CriticGPT is most effective at identifying errors that can be pinpointed in one specific location within the code. However, real-world mistakes in AI outputs can often be spread across multiple parts of an answer, presenting a challenge for future model iterations.

OpenAI plans to integrate CriticGPT-like models into its RLHF labeling pipeline, providing its trainers with AI assistance. For OpenAI, it’s a step toward developing better tools for evaluating outputs from LLM systems that may be difficult for humans to rate without additional support. However, the researchers caution that even with tools like CriticGPT, extremely complex tasks or responses may still prove challenging for human evaluators—even those assisted by AI.

A Deep Dive Into Dragon Age: The Veilguard’s Expansive Character Creator


As BioWare prepared to show me the character creator for Dragon Age: The Veilguard in its Edmonton, Canada, offices, I expected something robust – it’s 2024, character creators have come a long way, and Bioware has a rich history of good customization. Despite my expectations, I was not prepared for how robust it actually is in Veilguard. Robust enough, even, that BioWare used it to create most of the NPCs in the game, save for mainline characters like companions. Setting hyperbole aside, it is a staggeringly rich creation system, and I look forward to seeing player-created near-replicas of celebrities and monstrous creations that’d be more at home in a horror game. 

But I’m also looking forward to the community’s reaction to the Dragon Age series’ best character creator yet. At the heart of it is inclusivity, Veilguard game director Corinne Busche tells me before letting me guide her through creating my own character. 

Dragon Age: The Veilguard Dreadwolf Game Informer Cover Story

As is usual, there are four races to choose from: Elves, Qunari, Humans, and Dwarves. After selecting Qunari, Busche pages through various presets, explaining the game allows for more detailed looks at each and the ability to choose pronouns with she/her, he/him, and they/them separately from gender, select different body types, and more. You can view your character, referred to as Rook in-game, in four different lighting scenes at any time, including The Veilguard’s keynote purple hue, a bright and sunny tropical day, and a gothic night. 

I joke with the team that after spending upwards of an hour creating my Dragon Age: Inquisition character in 2014, I immediately restarted the game after seeing him in the first cutscene; the in-game lighting made my hair color look terrible amongst other issues I had with my Inquisitor. Veilguard creative director John Epler says the team is aware of countless stories like that with Inquisition and its green-hued character creator, adding BioWare worked hard to squash that concern in Veilguard. 

Head and body presets can be selected individually and customized to your liking with 40 different complexions that include smooth, rugged, youthful, and freckled skin tones, skin hues ranging from cool to neutral to warm, undertones to those skin tones, and even a melanin slider. Busche tells me BioWare relied on consultation to represent all people authentically. There’s a Vitiligo slider (where you can adjust the intensity and amount of it) and sliders for your forehead, brow, cheeks, jaw, chin, larynx, and scalp. You can select your undergarments, with nudity as well because “this is a mature RPG,” Busche adds, and use the “Body Morpher” to select three presets for each corner of a triangle and then move a cursor within it to morph your body or head into a mix of these presets. It’s an impressive technology I’d like to see adopted in other games. 

I can keep going: You can adjust height, shoulder width, chest size, glute and bulge size, hip width, how bloodshot your eyes are, how visible cataracts are, the sclera color, how crooked your nose is, how big its bridge is, the size of nostrils and the nose tip, and there are as many sliders, if not more, for things like Rook’s mouth and ears. On ears alone, I see you can adjust asymmetry, depth, rotation, earlobe size, and even add cauliflower ear to your Rook. Busche says makeup blends modern stylings with the fantasy of Dragon Age with more than 30 options, including eyeliner intensity, color, glitter, eye shadow, lips, and blush.

Tattoos are just as customizable alongside options for scars and paint. Tattoos, scars, and paint are very culturally relevant to some lineages, BioWare tells me, with unique tattoos for elves, for example. You can add tattoos to Rook’s face, body, arms, and legs, and you can adjust things like intensity, too. 

Im most impressed, however, by the hair options on display; there are a ton, and as someone with long hair, I’m especially excited about the fun selections I can make. You can finally dye your hair with non-traditional colors, and it’s gorgeous. EA’s Frostbite engine uses the Strand system to render each style fully with physics. “The technology has finally caught up to our ambition,” Dragon Age series art director Matt Rhodes says.

After customizing all of that and selecting our Qunari’s horn type and material (of which there are more than 40 options to choose from), it’s time to pick a class out of the Rogue, Mage, and Warrior – read more about Veilguard’s classes here. Since we built a Qunari, we went with Warrior. For the penultimate step of the character creator, at least during the demo BioWare shows me, we select a faction. Out of the six options, we select the pirate-themed Lords of Fortune. 

“Rook ascends because of competency, not because of a magical McGuffin,” BioWare core lead and Mass Effect executive producer Michael Gamble tells me in contrast to Inquisition’s destiny-has-chosen-you-characterization.

“Rook is here because they choose to be and that speaks to the kind of character that we’ve built,” Busche adds. “Someone needs to stop this, and Rook says, ‘I guess that’s me.'”

Ready to begin our Rook’s journey, we select a first and last name and one of four voices out of English masculine, English feminine, American masculine, or American feminine options. There’s a pitch shifter for each voice, too, allowing you to tweak it to your liking further.

Don’t stress too much about locking in your character creations before beginning the game – the Mirror of Transformation, which is found in Veilguard’s main hub, The Lighthouse, allows you to change your physical appearance at any time. However, class, lineage, and identity are locked in and cannot be changed after you select them in the game’s character creator. 

From here, we’re off to Minrathous, and you can read more about that famed city in our cover story, which is available here.


For more about the game, including exclusive details, interviews, video features, and more, click the Dragon Age: The Veilguard hub button below.