Machine‑learning systems have moved far beyond academic labs and into mission‑critical applications like medical diagnostics, credit decisions, content moderation, and generative search. These models power decision‑making processes, generate text and images, and react to dynamic environments; however, they are only as trustworthy as their performance. Selecting the right performance metrics is fundamental to building reliable and equitable AI. Metrics tell us whether a model is doing its job, where it might be biased, and when it needs to be retrained. In this guide we go deep into the world of ML performance metrics, covering core concepts, advanced measures, fairness, interpretability and even green AI considerations. Wherever relevant, we will highlight how Clarifai’s platform helps practitioners monitor, evaluate and improve models.
Quick summary
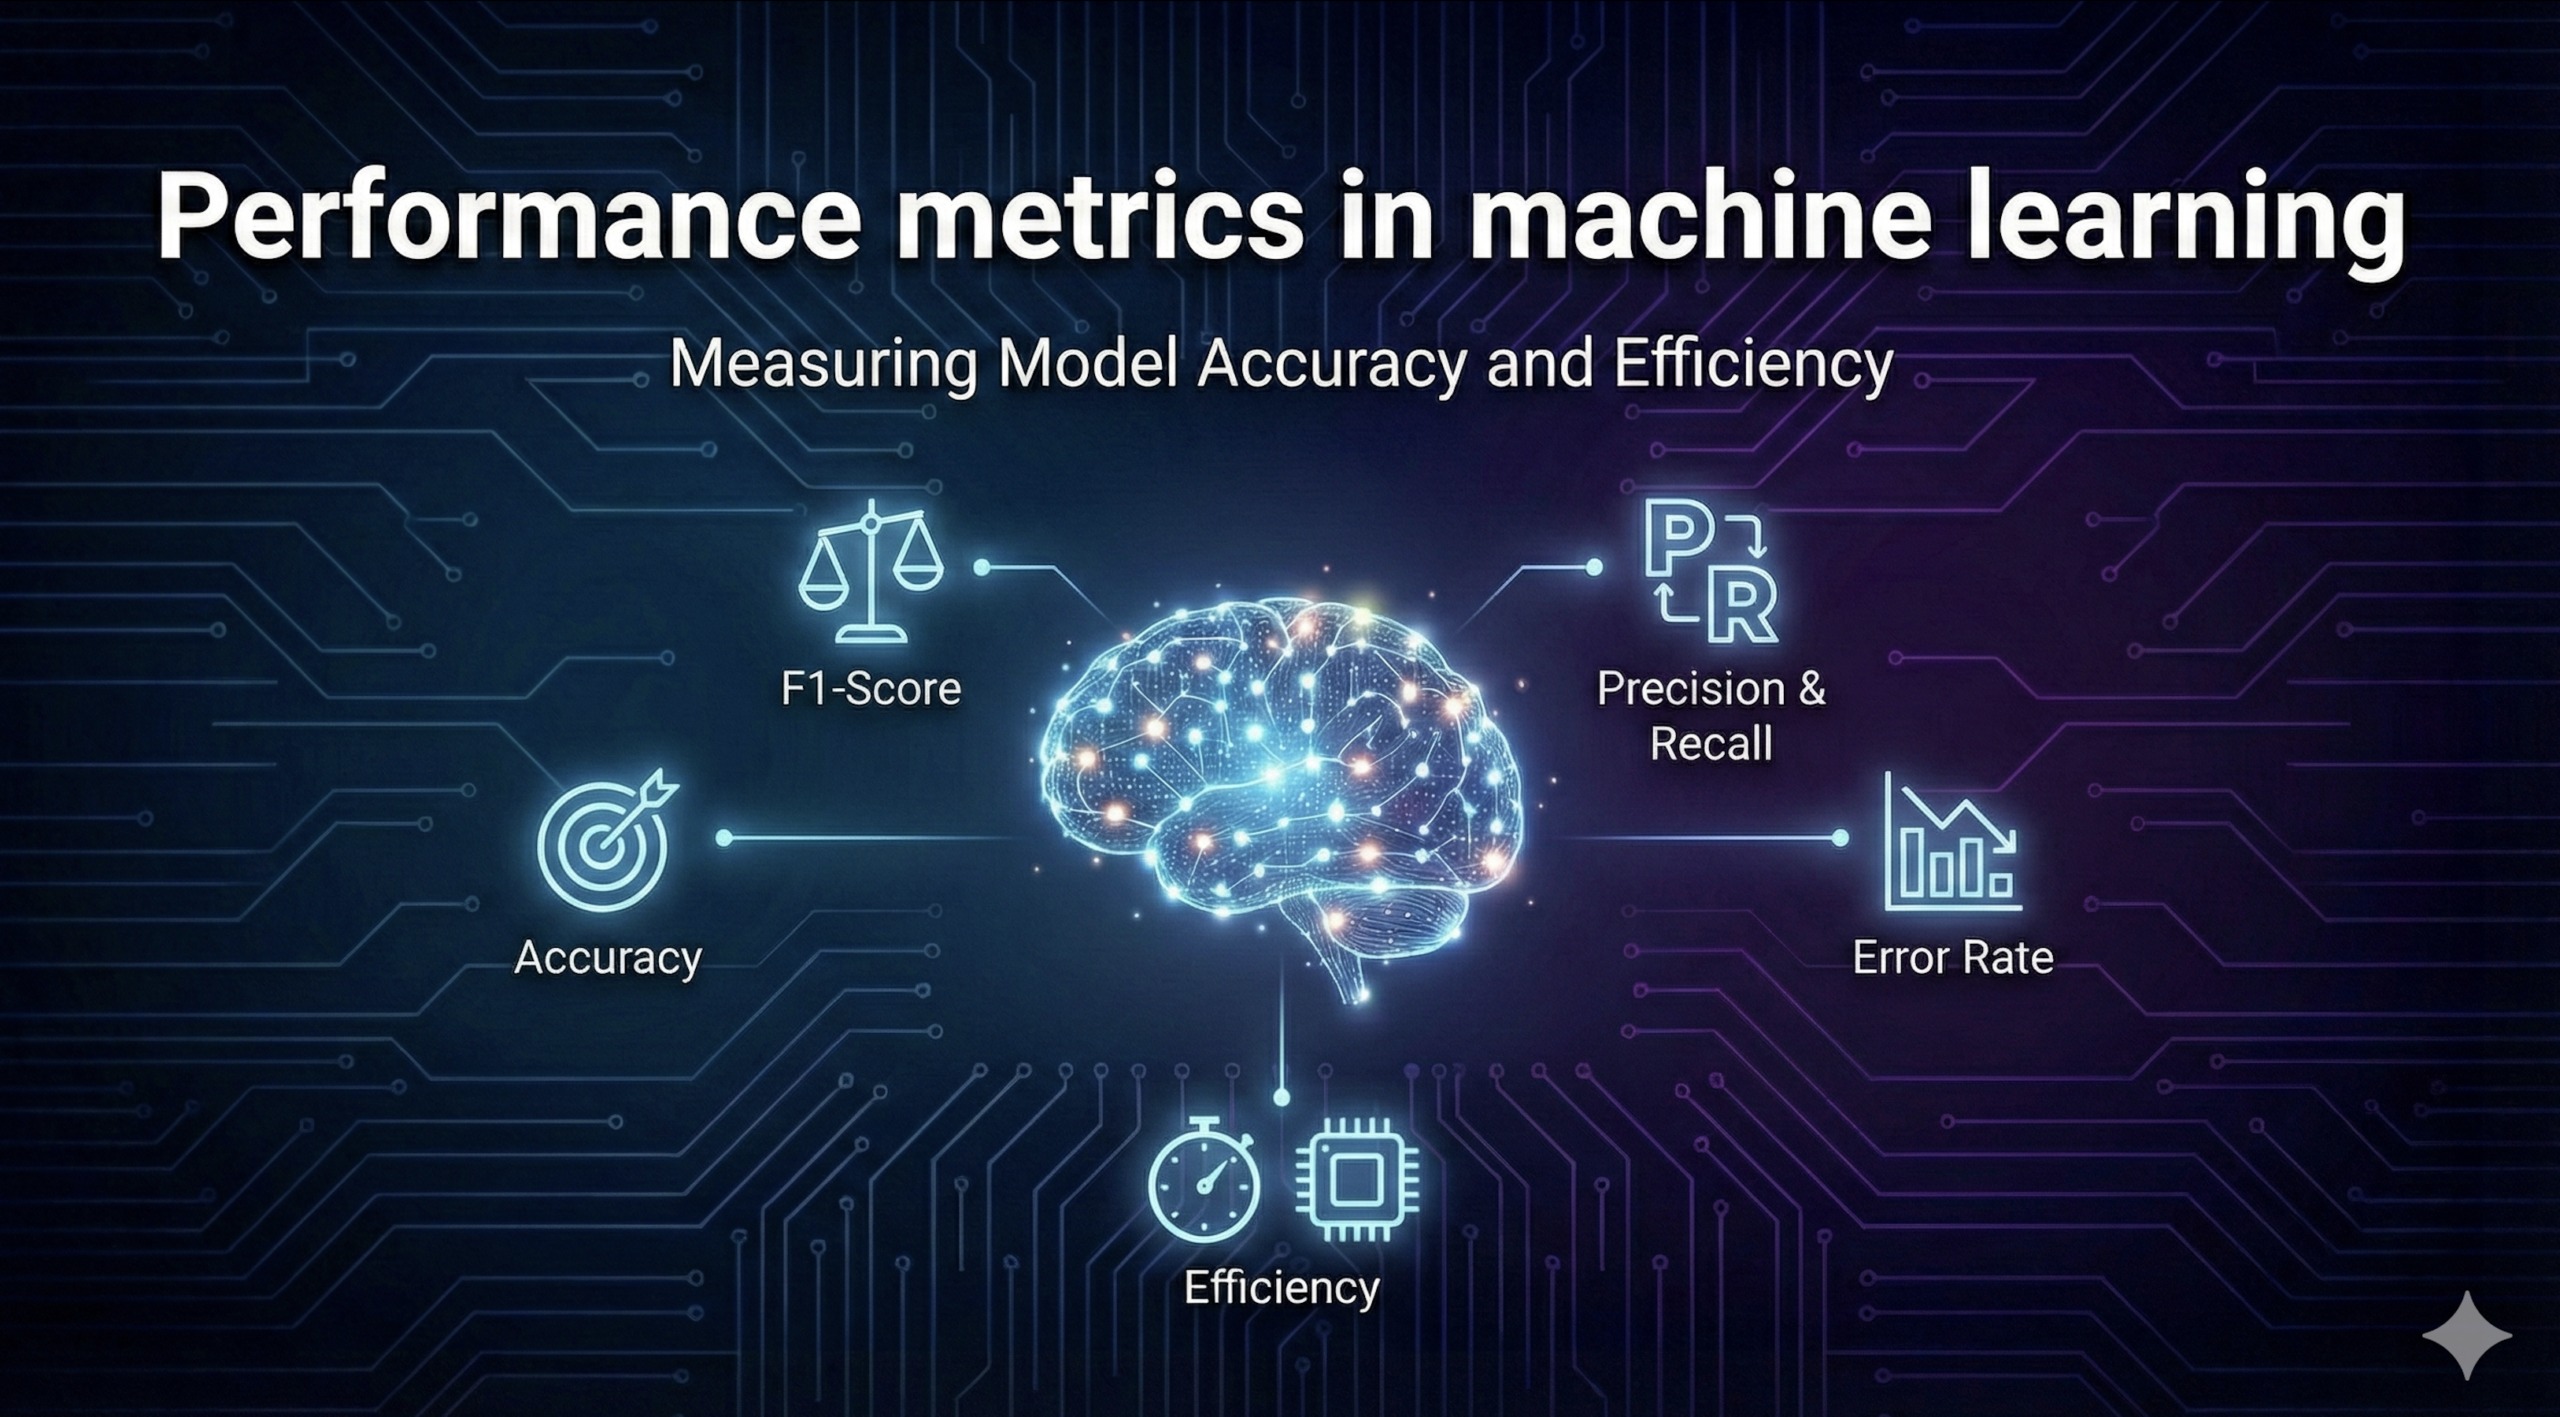
What are performance metrics in machine learning and why do they matter? Performance metrics are quantitative measures used to evaluate how well a machine‑learning model performs a specific task. They capture different aspects of model behaviour—accuracy, error rates, fairness, explainability, drift and even energy consumption—and enable practitioners to compare models, choose suitable thresholds and monitor deployed systems. Without metrics, we can’t know whether a model is useful, harmful or simply wasting resources. For high‑impact domains, robust metrics also support regulatory compliance and ethical obligations.
Quick digest of this guide
This article follows a structured approach:
- Importance of metrics: We start by explaining why metrics are essential and why relying on a single measure like accuracy can be misleading.
- Classification metrics: We demystify accuracy, precision, recall, F1‑score and the ROC–AUC, showing when to use each. The trade‑offs between false positives and false negatives are highlighted with real examples.
- Regression and forecasting metrics: We explore error metrics (MAE, MSE, RMSE), the coefficient of determination, and time‑series metrics like MAPE, sMAPE, MASE and CRPS, showing how they impact forecasting.
- Generative and LLM metrics: We cover perplexity, BLEU, ROUGE, BERTScore, METEOR, GPTScore and FID—metrics tailored to generative text and image models—and discuss RAG‑specific evaluation like faithfulness.
- Explainability and fairness: We dive into interpretability metrics such as LIME and SHAP, as well as fairness metrics like demographic parity and equalized odds. We examine why fairness evaluations are essential and how biases can creep in.
- Model drift and monitoring: We discuss data drift, concept drift and prediction drift, along with statistical tests and monitoring strategies to detect them early.
- Energy and sustainability: We introduce energy‑efficiency metrics for AI models, an emerging area of responsible AI.
- Best practices and tools: Finally, we provide evaluation best practices, describe Clarifai’s solutions, and survey emerging research and regulatory trends, then conclude with FAQs.
Let’s start by understanding why we need metrics in the first place.
Understanding performance metrics: importance and context
Machine‑learning models learn patterns from historical data, but their real purpose is to generalize to future data. Performance metrics quantify how closely a model’s outputs match desired outcomes. Without appropriate metrics, practitioners risk deploying systems that appear to perform well but fail when faced with real‑world complexities or suffer from unfair biases.
Why metrics matter
- Model selection and tuning: During development, data scientists experiment with different algorithms and hyperparameters. Metrics allow them to compare models objectively and choose the approach that best meets requirements.
- Business alignment: A “good” model is not solely defined by high accuracy. Decision‑makers care about business impact metrics like cost savings, revenue increase, user adoption and risk reduction. A model with 95 % accuracy that saves 10 hours per week may be more valuable than a 99 % accurate model that is difficult to use.
- Stakeholder trust and compliance: In regulated industries, metrics ensure models meet legal requirements. For example, fairness metrics help avoid discriminatory outcomes, and explainability metrics support transparency.
- Monitoring deployed systems: Once in production, models encounter data drift, concept drift and changing environments. Continuous monitoring metrics help detect degradation early and trigger retraining or replacement..
- Ethical and societal considerations: Metrics can expose bias and facilitate corrective action. They also inform energy consumption and environmental impact in the era of Green AI.
Pitfalls of a single metric
One of the biggest mistakes in ML evaluation is relying on a single metric. Consider a binary classifier used to screen job applicants. If the dataset is highly imbalanced (1 % positive, 99 % negative), a model that labels everyone as negative will achieve 99 % accuracy. However, such a model is useless because it never selects qualified candidates. Similarly, a high precision model might reject too many qualified applicants, whereas a high recall model could accept unqualified ones. The right balance depends on the context.
Clarifai’s holistic evaluation philosophy
Clarifai, a market leader in AI, advocates a multi‑metric approach. Its platform provides out‑of‑the‑box dashboards for accuracy, recall and F1‑score, but also tracks fairness, explainability, drift and energy consumption. With compute orchestration, you can deploy models across cloud and edge environments and compare their metrics side by side. Its model inference endpoints automatically log predictions and metrics, while local runners allow evaluation on‑premises without data leaving your environment.
Classification metrics – accuracy, precision, recall, F1 & ROC‑AUC
Classification models predict categorical labels: spam vs. ham, cancer vs. healthy, or approved vs. denied. Several core metrics describe how well they perform. Understanding these metrics and their trade‑offs is crucial for choosing the right model and threshold.
Accuracy
Accuracy is the proportion of correct predictions out of all predictions. It’s intuitive and widely used but can be misleading on imbalanced datasets. In a fraud detection system where only 0.1 % of transactions are fraudulent, a model that flags none will be nearly 100 % accurate yet miss all fraud. Accuracy should be supplemented with other metrics.
Precision and recall
Precision measures the proportion of positive predictions that are actually positive. It answers the question: When the model says “yes,” how often is it right? A spam filter with high precision rarely marks a legitimate email as spam. Recall (also called sensitivity or true positive rate) measures the proportion of actual positives that are captured. In medical diagnostics, a high recall ensures that most disease cases are detected. Often there is a trade‑off between precision and recall: improving one can worsen the other.
F1‑score
The F1‑score combines precision and recall using the harmonic mean. It is particularly useful when dealing with imbalanced classes. The harmonic mean penalizes extreme values; thus a model must maintain both decent precision and recall to achieve a high F1. This makes F1 a better indicator than accuracy in tasks like rare disease detection, where the positive class is much smaller than the negative class.
ROC curve and AUC
The Receiver Operating Characteristic (ROC) curve plots the true positive rate against the false positive rate at various threshold settings. The Area Under the ROC Curve (AUC) quantifies the overall ability of the model to distinguish between classes. An AUC of 1.0 indicates perfect discrimination, whereas 0.5 suggests random guessing. AUC is particularly useful when classes are imbalanced or when thresholds may change after deployment.
Additional classification metrics
- Specificity (true negative rate): measures how well the model identifies negative cases.
- Matthews correlation coefficient (MCC): a balanced measure that considers all four confusion matrix categories.
- Balanced accuracy: the average of recall for each class, useful for imbalanced data.
Expert insights
- Contextual trade‑offs: In medical testing, false negatives could be life‑threatening, so recall takes priority; in spam filtering, false positives annoy users, so precision may be more important.
- Business impact metrics: Technical metrics must be mapped to business outcomes, such as cost of errors and user satisfaction. A model that slightly reduces accuracy but halves manual review time may be preferable.
- Clarifai advantage: The Clarifai platform automatically logs confusion matrices and computes precision‑recall curves. Built‑in dashboards help you identify the right operating threshold and evaluate models on new data slices without coding.
Regression metrics – MAE, MSE, RMSE & R²
Regression models predict continuous values such as housing prices, temperature or credit risk scores. Unlike classification, there is no “correct class”; instead we measure errors.
Mean Absolute Error (MAE)
MAE is the average absolute difference between predicted and actual values. It is easy to interpret because it is expressed in the same units as the target variable. MAE treats all errors equally and is robust to outliers.
Mean Squared Error (MSE) & Root Mean Squared Error (RMSE)
MSE is the average of squared errors. Squaring penalizes larger errors more heavily, making MSE sensitive to outliers. RMSE is simply the square root of MSE, returning the metric to the original units. RMSE is often preferred in practice because it is interpretable yet emphasizes large deviations.
Coefficient of determination (R²)
R² measures the proportion of variance in the dependent variable that is predictable from the independent variables. An R² of 1 means the model explains all variability; 0 means it explains none. Adjusted R² accounts for the number of predictors and penalizes adding variables that do not improve the model. Although widely used, R² can be misleading if the data violate linear assumptions.
When to use each metric
- MAE is robust and useful when outliers should not overly influence the model.
- MSE/RMSE are better when large errors are undesirable (e.g., energy load forecasting where big underestimates can cause failures). RMSE is often easier to interpret.
- R² is useful for comparing models with the same dependent variable, but it should not be the sole metric. Low R² values can still be acceptable if predictions are close enough for the task.
Expert insights
- Multiple metrics: Practitioners should use a combination of MAE, RMSE and R² to capture different perspectives. This helps avoid overfitting to a single metric.
- Domain relevance: In finance, a few large errors may be catastrophic, so RMSE is important; in budgeting applications where each dollar counts, MAE might suffice.
- Clarifai integration: Clarifai allows you to define custom metrics; regression endpoints return prediction logs that you can pipe into dashboards. Integration with data warehouses and business intelligence tools lets you overlay business metrics (e.g., revenue) with error metrics.
Forecasting & time‑series metrics – MAE, MAPE, sMAPE, MASE, CRPS
Time‑series forecasting introduces additional challenges: seasonality, trend shifts and scale variations. Metrics must account for these factors to provide meaningful comparisons. presents a concise summary of forecasting metrics.
Mean Absolute Percentage Error (MAPE)
MAPE expresses the error as a percentage of the actual value. It is scale‑invariant, making it useful for comparing forecasts across different units. However, it fails when actual values approach zero, producing extremely large errors or undefined values.
Symmetric MAPE (sMAPE)
sMAPE adjusts MAPE to treat over‑ and under‑predictions symmetrically by normalizing the absolute error by the average of the actual and predicted values. This prevents the metric from ballooning when actual values are near zero.
Mean Absolute Scaled Error (MASE)
MASE scales the MAE by the in‑sample MAE of a naïve forecast (e.g., previous period). It enables comparison across series and indicates whether the model outperforms a simple benchmark. A MASE less than 1 means the model is better than the naïve forecast, while values greater than 1 indicate underperformance.
Continuous Ranked Probability Score (CRPS)
Traditional metrics like MAE and MAPE work on point forecasts. CRPS evaluates probabilistic forecasts by integrating the squared difference between the predicted cumulative distribution and the actual outcome. CRPS rewards both sharpness (narrow distributions) and calibration (distribution matches reality), providing a more holistic measure.
Expert insights
- Forecasting decisions: In demand forecasting, MAPE and sMAPE help businesses plan inventory; a high error could result in stockouts or overstock. sMAPE is better when data contain zeros or near‑zero values.
- Probabilistic models: As probabilistic forecasting (e.g., quantile forecasts) becomes more common, CRPS is increasingly important. It encourages models to produce well‑calibrated distributions.
- Clarifai’s support: Clarifai’s platform can orchestrate time‑series models and compute these metrics at run time. With compute orchestration, you can run forecasting models on streaming data and evaluate CRPS automatically.
Generative AI & language model metrics – Perplexity, BLEU, ROUGE, BERTScore & FID
Generative models have exploded in popularity. Evaluating them requires metrics that capture not just correctness but fluency, diversity and semantic alignment. Some metrics apply to language models, others to image generators.
Perplexity
Perplexity measures how “surprised” a language model is when predicting the next word. Lower perplexity indicates that the model assigns higher probabilities to the actual sequence, implying better predictive capability. A perplexity of 1 means the model perfectly predicts the next word; a perplexity of 10 suggests the model is essentially guessing among ten equally likely options. Perplexity does not require a reference answer and is particularly useful for evaluating unsupervised generative models.
BLEU
The Bilingual Evaluation Understudy (BLEU) score compares a generated sentence with one or more reference sentences, measuring the precision of n‑gram overlaps. It penalizes shorter outputs via a brevity penalty. BLEU is widely used in machine translation but may not correlate well with human perception for long or open‑ended texts.
ROUGE
ROUGE (Recall‑Oriented Understudy for Gisting Evaluation) measures recall rather than precision. Variants like ROUGE‑N and ROUGE‑L evaluate overlapping n‑grams and the longest common subsequence. ROUGE is popular for summarization tasks.
METEOR, WER, BERTScore & GPTScore
- METEOR improves upon BLEU by considering synonym matches and stemming, offering higher correlation with human judgments.
- Word Error Rate (WER) measures transcription accuracy by computing the number of insertions, deletions and substitutions.
- BERTScore uses contextual embeddings from a pretrained language model to compute semantic similarity between generated and reference texts. Unlike n‑gram metrics, it captures deeper meaning.
- GPTScore (also known as LLM‑as‑a‑Judge) uses a large language model to evaluate another model’s output. It shows promise but raises questions about reliability and biases.
Fréchet Inception Distance (FID)
For generative images, the FID compares the distribution of generated images to that of real images by computing the difference between their mean and covariance in a feature space extracted by an Inception network. Lower FID scores indicate closer alignment with the real image distribution. FID has become the standard metric for evaluating generative image models.
RAG‑specific metrics
Retrieval‑Augmented Generation (RAG) models rely on a retrieval component to provide context. Evaluation metrics include faithfulness (does the model stay true to retrieved sources), contextual relevance (is the retrieved information relevant) and hallucination rate (how often the model invents facts). These metrics are still evolving and often require human or LLM‑based judgments.
Expert insights
- Beyond n‑grams: N‑gram metrics like BLEU and ROUGE can discourage creative or diverse generation. Embedding‑based metrics such as BERTScore address this by capturing semantic similarity.
- Limitations of perplexity: Perplexity assumes access to model probabilities; it is less useful when working with black‑box APIs.
- FID adoption: FID is widely used in research competitions because it correlates well with human judgments.
- Clarifai’s capabilities: Clarifai’s generative platform provides evaluation pipelines for text and image models. You can compute BLEU, ROUGE, FID and BERTScore directly through the dashboard or via API. Clarifai also offers RAG pipelines with metrics for hallucination and context relevance, helping you improve retrieval strategies.
Explainability & interpretability metrics – LIME, SHAP and beyond
Model interpretability is critical for trust, debugging and regulatory compliance. It answers the question “Why did the model make this prediction?” While accuracy tells us how well a model performs, interpretability tells us why. Two popular methods for generating feature importance scores are LIME and SHAP.
Local Interpretable Model‑agnostic Explanations (LIME)
LIME creates local surrogate models by perturbing inputs around a prediction and fitting a simple, interpretable model (e.g., linear regression or decision tree) to approximate the complex model’s behaviour. Strengths:
- Model agnostic: Works with any black‑box model.
- Produces intuitive explanations for a single prediction.
- Supports different data types (text, images, tabular).
Limitations:
- Local explanations may not generalize globally.
- Sensitive to how the neighborhood is defined; different perturbations can lead to different explanations.
- Instability makes repeated runs produce different explanations.
SHapley Additive exPlanations (SHAP)
SHAP assigns each feature an importance value by calculating its average contribution across all possible feature orderings, grounded in cooperative game theory. Strengths:
- Provides both local and global explanations.
- Theoretically consistent—features with larger contributions receive higher scores.
- Produces effective visualizations (e.g., summary plots).
Limitations:
- Computationally expensive, particularly with many features.
- Assumes feature independence, which may not hold in real data.
Other interpretability measures
- Integrated gradients and DeepLIFT compute attribution scores for deep networks using path integrals.
- Grad‑CAM produces heatmaps for convolutional networks.
- Counterfactual explanations suggest minimal changes to flip the prediction.
Expert insights
- Interpretability is contextual: A doctor may require different explanations than a data scientist. Explanations must be tailored to the domain and user.
- Beware of oversimplification: Local approximations like LIME can oversimplify complex models and may mislead if treated as global truths. Practitioners should combine local and global explanations.
- Clarifai’s explainability features: Clarifai provides built‑in explanation tools that leverage both SHAP and integrated gradients. Visual dashboards highlight which input features influenced a prediction, and API endpoints allow users to generate explanations programmatically.
Fairness & ethical metrics – demographic parity, equalized odds & beyond
Even highly accurate models can cause harm if they systematically disadvantage certain groups. Fairness metrics are essential for identifying and mitigating bias.
Why bias occurs
Bias can enter at any stage: measurement bias (faulty labels), representation bias (underrepresented groups), sampling bias (non‑random sampling), aggregation bias (combining groups incorrectly) and omitted variable bias. For example, a facial recognition system trained on predominantly lighter‑skinned faces may misidentify darker‑skinned individuals. A hiring model trained on past hiring data may perpetuate historical inequities.
Demographic parity
Demographic parity requires that the probability of a positive outcome is independent of sensitive attributes. In a resume screening system, demographic parity means equal selection rates across demographic groups. Failing to meet demographic parity can generate allocation harms, where opportunities are unevenly distributed.
Equalized odds
Equalized odds is stricter than demographic parity. It demands that different groups have equal true positive rates and false positive rates. A model may satisfy demographic parity but produce more false positives for one group; equalized odds avoids this by enforcing equality on both types of errors. However, it may lower overall accuracy and can be challenging to achieve.
Equal opportunity and the Four‑Fifths rule
Equal opportunity is a relaxed version of equalized odds, requiring equal true positive rates across groups but not equal false positive rates. The Four‑Fifths rule (80 % rule) is a heuristic from U.S. employment law. It states that a selection rate for any group should not be less than 80 % of the rate for the highest‑selected group. Although frequently cited, the Four‑Fifths rule can mislead because fairness must be considered holistically and within legal context.
Fairness evaluation research
Recent research proposes k‑fold cross‑validation with t‑tests to evaluate fairness across protected attributes. This approach provides statistical confidence intervals for fairness metrics and avoids spurious conclusions. Researchers emphasize that fairness definitions should be context‑dependent and adaptable.
Expert insights
- No one‑size‑fits‑all: Demographic parity may be inappropriate when base rates differ legitimately (e.g., disease prevalence). Equalized odds may impose undue costs on some groups. Practitioners must collaborate with stakeholders to choose metrics.
- Avoid misuse: The Four‑Fifths rule, when applied outside its legal context, can give a false sense of fairness. Fairness is broader than compliance and should focus on harm reduction.
- Regulatory landscape: Policies like the EU AI Act and Algorithmic Accountability Act emphasise transparency and fairness. Keeping abreast of these regulations is vital.
- Clarifai’s fairness tooling: Clarifai’s platform lets you define sensitive attributes and compute demographic parity, equalized odds and other fairness metrics. It offers dashboards to compare models across demographic segments and supports fairness constraints during model training.
Model drift & monitoring – tracking data, concept & prediction drift
Model performance isn’t static. Real‑world data shift over time due to evolving user behaviour, market trends or external shocks. Model drift is a catch‑all term for these changes. Continuous monitoring is essential to detect drift early and maintain model reliability.
Types of drift
- Data drift (covariate shift): The distribution of input features changes while the relationship between input and output remains the same. For example, a recommendation system may see new customer demographics.
- Concept drift: The relationship between features and the target variable changes. During the COVID‑19 pandemic, models predicting sales based on historical patterns failed as consumer behaviour shifted dramatically.
- Prediction drift: The distribution of predictions changes, possibly indicating issues with input distribution or concept drift.
Detecting drift
Several statistical tests help detect drift:
- Jensen–Shannon divergence measures the similarity between two probability distributions; larger values indicate drift.
- Kolmogorov–Smirnov (KS) test compares the cumulative distribution functions of two samples to assess whether they differ significantly.
- Population Stability Index (PSI) quantifies distributional change over time; values above a threshold signal drift.
- Proxy metrics: When labels are delayed or unavailable, unsupervised drift metrics act as proxies.
Monitoring techniques
- Holdout testing: Evaluate the model on a reserved set not used in training.
- Cross‑validation: Partition data into folds and average performance across them.
- Stress testing: Probe the model with edge cases or synthetic shifts to identify fragility.
- A/B testing: Compare the current model with a new model on live traffic.
Expert insights
- Early detection matters: In production, labels may arrive weeks later. Drift metrics provide early warning signals to trigger retraining.
- Use multiple indicators: Combining distributional tests with performance metrics improves detection reliability.
- Clarifai’s monitoring: Clarifai’s Model Monitor service tracks data distributions and outputs. It alerts you when PSI or JS divergence exceeds thresholds. Integration with compute orchestration means you can retrain or swap models automatically.
Energy & sustainability metrics – measuring AI’s environmental impact
Large models consume significant energy. As awareness of climate impact grows, energy metrics are emerging to complement traditional performance measures.
AI Energy Score
The AI Energy Score initiative establishes standardized energy‑efficiency ratings for AI models, focusing on controlled benchmarks across tasks and hardware. The project uses star ratings from 1 to 5 to indicate relative energy efficiency: 5 stars for the most efficient models and 1 star for the least efficient. Ratings are recalibrated regularly as new models are evaluated.
Methodology
- Benchmarks focus on inference energy consumption rather than training, as inference presents more variability.
- Tasks, hardware (e.g., NVIDIA H100 GPUs) and configurations are standardized to ensure comparability.
- Efficiency should be considered alongside performance; a slower but more accurate model may be acceptable if its energy cost is justified.
Expert insights
- Green AI movement: Researchers argue that energy consumption should be a first‑class metric. Energy‑efficient models lower operational costs and carbon footprint.
- Best practices: Use model compression (e.g., pruning, quantization), choose energy‑efficient hardware and schedule heavy tasks during low‑carbon periods.
- Clarifai’s sustainability features: Clarifai optimizes compute scheduling and supports running models on energy‑efficient edge devices. Energy metrics can be integrated into evaluation pipelines, enabling organizations to track carbon impact.
Best practices for evaluating ML models – lifecycle & business considerations
Evaluation isn’t a one‑time event. It spans the model lifecycle from ideation to retirement. Here are best practices to ensure robust evaluation.
Use appropriate validation techniques
- Train/test split: Divide data into training and testing sets. Ensure the test set represents future use cases.
- Cross‑validation: Perform k‑fold cross‑validation to reduce variance and better estimate generalization.
- Evaluation on unseen data: Test the model on data it has never encountered to gauge real‑world performance.
- Temporal splits: For time‑series, split chronologically to avoid leakage.
Align metrics with business goals
Metrics must capture what matters to stakeholders: cost, risk, compliance and user experience. For example, cost of errors, time savings, revenue impact and user adoption are crucial business metrics.
Balance multiple objectives
No single metric can represent all facets of model quality. Combine accuracy, fairness, interpretability, drift resilience and sustainability. Use multi‑objective optimization or scoring systems.
Set thresholds and calibrate
Determine decision thresholds using metrics like precision‑recall curves or cost–benefit analysis. Calibration ensures predicted probabilities reflect actual likelihoods, improving decision quality.
Document and communicate
Maintain transparent documentation of datasets, metrics, biases and assumptions. Communicate results in plain language to stakeholders, emphasizing limitations.
Continuous improvement
Monitor models in production, track drift and fairness metrics, and retrain or update when necessary. Establish feedback loops with domain experts and end‑users.
Expert insights
- Holistic evaluation: Experts emphasise that evaluation should consider the entire sociotechnical context, not just algorithmic performance.
- Stakeholder collaboration: Engage legal, ethical and domain experts to choose metrics and interpret results. This builds trust and ensures compliance.
- Clarifai’s MLOps: Clarifai provides versioning, lineage tracking and compliance reporting. You can run experiments, compare metrics, and share dashboards with business stakeholders.
Tools & platforms for metric tracking – Clarifai and the ecosystem
Modern ML projects demand tools that can handle data management, model training, evaluation and deployment in an integrated way. Here’s how Clarifai fits into the ecosystem.
Clarifai’s product stack
- Compute orchestration: Orchestrate models across cloud, on‑prem and edge. This ensures consistent evaluation environments and efficient resource utilization.
- Model inference endpoints: Deploy models via RESTful APIs; automatically log predictions and ground truth to compute metrics like accuracy, precision and recall.
- Local runners: Run models in secure environments without sending data to external servers; important for privacy‑sensitive industries.
- Dashboards and analytics: Visualize metrics (confusion matrices, ROC curves, fairness dashboards, drift charts, energy usage) in real time. Drill down by feature, demographic group or time window.
Integrations with the wider ecosystem
Clarifai integrates with open‑source libraries and third‑party tools:
- Fairlearn: Use Fairlearn metrics for demographic parity, equalized odds and equal opportunity. Clarifai can ingest the outputs and display them on fairness dashboards.
- Evidently: Monitor drift using PSI, JS divergence and other statistical tests; Clarifai’s Model Monitor can call these functions automatically. The Evidently guide emphasises concept and data drift’s impact on ML systems.
- Interpretability libraries: Clarifai supports SHAP and integrated gradients; results appear in the platform’s explainability tab.
Case studies and examples
- Retail demand forecasting: A retailer uses Clarifai to orchestrate time‑series models on edge devices in stores. Metrics like MAPE and sMAPE are calculated on streaming sales data and displayed in dashboards. Alerts trigger when error exceeds thresholds.
- Healthcare diagnosis: A hospital deploys an image classifier using Clarifai’s endpoints. They monitor precision and recall separately to minimise false negatives. Fairness dashboards show equalized odds across patient demographics, helping satisfy regulatory requirements.
- Generative search: A media company uses Clarifai’s generative pipeline to summarize articles. BLEU, ROUGE and BERTScore metrics are computed automatically. RAG metrics track hallucination rate, and energy metrics encourage efficient deployment.
Expert insights
- Unified platform benefits: Consolidating data ingestion, model deployment and evaluation reduces the risk of misaligned metrics and ensures accountability. Clarifai provides an all‑in‑one solution.
- Custom metrics: The platform supports custom metric functions. Teams can implement domain‑specific metrics and integrate them into dashboards.
Emerging trends & research – from RAG metrics to fairness audits
The ML landscape evolves rapidly. Here are some trends shaping performance measurement.
RAG evaluation and LLMs as judges
As retrieval‑augmented generation becomes mainstream, new metrics are emerging:
- Faithfulness: Measures whether the generated answer strictly follows retrieved sources. Lower faithfulness indicates hallucinations. Often evaluated via human annotators or LLMs.
- Contextual relevance: Assesses whether retrieved documents are pertinent to the query. Non‑relevant context can lead to irrelevant or incorrect answers.
- Hallucination rate: The percentage of generated statements not grounded in sources. Reducing hallucinations is critical for trustworthy systems.
Large language models themselves are used as judges—LLM‑as‑a‑Judge—to rate outputs. This technique is convenient but raises concerns about subjective biases in the evaluating model. Researchers stress the need for calibration and cross‑model evaluations.
Fairness audits and statistical testing
Research advocates rigorous fairness audits using k‑fold cross‑validation and statistical t‑tests to compare performance across groups. Audits should involve domain experts and affected communities. Automated fairness evaluations are complemented with human review and contextual analysis.
Energy metrics and Green AI
With increasing climate awareness, energy consumption and carbon emission metrics are expected to be integrated into evaluation frameworks. Tools like AI Energy Score provide standardized comparisons. Regulators may require disclosure of energy usage for AI services.
Regulations and standards
Regulatory frameworks like the EU AI Act and the Algorithmic Accountability Act emphasise transparency, fairness and safety. Industry standards (e.g., ISO/IEC 42001) may codify evaluation methods. Staying ahead of these regulations helps organisations avoid penalties and maintain public trust.
Clarifai’s research initiatives
Clarifai participates in industry consortia to develop RAG evaluation benchmarks. The company is exploring faithfulness metrics, improved fairness audits and energy‑efficient inference in its R&D labs. Early access programs allow customers to test new metrics before they become mainstream.
Conclusion & FAQs – synthesizing lessons and next steps
Performance metrics are the compass that guides machine‑learning practitioners through the complexity of model development, deployment and maintenance. There is no single “best” metric; rather, the right combination depends on the problem, data, stakeholders and ethical considerations. As AI becomes ubiquitous, metrics must expand beyond accuracy to encompass fairness, interpretability, drift resilience and sustainability.
Clarifai’s platform embodies this holistic approach. It offers tools to deploy models, monitor a wide range of metrics and integrate open‑source libraries, allowing practitioners to make informed decisions with transparency. Whether you are building a classifier, forecasting demand, generating text, or deploying an LLM‑powered application, thoughtful measurement is key to success.
Frequently asked questions
Q: How do I choose between accuracy and F1‑score?
A: Accuracy is suitable when classes are balanced and false positives/negatives have similar costs. F1‑score is better for imbalanced datasets or when precision and recall trade‑offs matter.
Q: What is a good ROC‑AUC value?
A: A ROC‑AUC of 0.5 means random guessing. Values above 0.8 generally indicate good discrimination. However, interpret AUC relative to your problem and consider other metrics like precision–recall curves.
Q: How can I detect bias in my model?
A: Compute fairness metrics such as demographic parity and equalized odds across sensitive groups. Use statistical tests and consult domain experts. Tools like Clarifai and Fairlearn can automate these analyses.
Q: What is the FID score and why does it matter?
A: FID (Fréchet Inception Distance) measures the similarity between generated images and real images in a feature space. Lower FID scores indicate more realistic generations.
Q: Do I need energy metrics?
A: If your organisation is concerned about sustainability or operates at scale, tracking energy efficiency is advisable. Energy metrics help reduce costs and carbon footprint.
Q: Can Clarifai integrate with my existing MLOps stack?
A: Yes. Clarifai supports API‑based integrations, and its modular design allows you to plug in fairness libraries, drift detection tools, or custom metrics. You can run models on Clarifai’s cloud, your own infrastructure or edge devices.
Q: How often should I retrain my model?
A: There is no one‑size‑fits‑all answer. Monitor drift metrics and business KPIs; retrain when performance drops below acceptable thresholds or when data distribution shifts.
By embracing a multi‑metric approach and leveraging modern tooling, data teams can build AI systems that are accurate, fair, explainable, robust and sustainable. As you embark on new AI projects, remember that metrics are not just numbers but stories about your model’s behaviour and its impact on people and the planet.