Deals are flat, the pipeline looks busy, and your development team says they are stretched. The obvious fix is another franchise sales rep. Before you post the job, find out whether you have a capacity problem or a process problem.
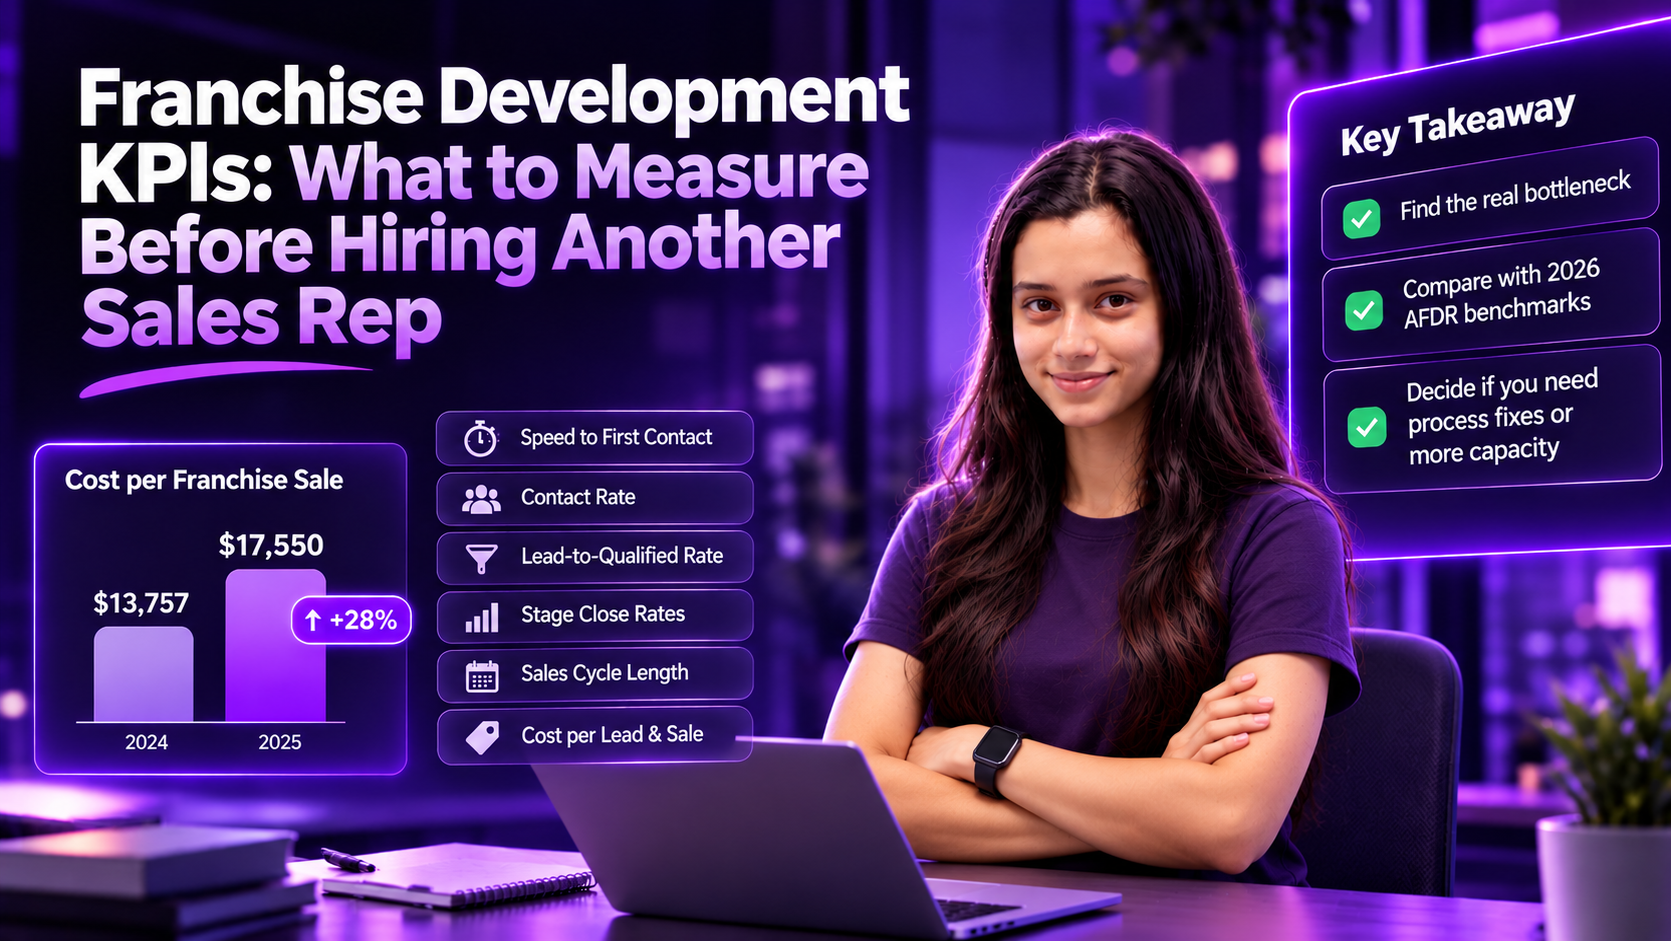
Guessing wrong is getting expensive. Franchise Update Media’s 2026 Annual Franchise Development Report (AFDR) found that the cost to secure each new franchisee jumped to $17,550 in 2025, up from $13,757 the year before. Yet only 49% of franchisors track cost per sale at all.
A new rep inherits whatever your process already leaks. These seven franchise development KPIs show where it leaks, and whether more people would actually help. They cover franchise sales and development, not unit-level operations metrics like same-store sales or labor cost.
Why Another Rep Is Often the Wrong First Fix
Hiring adds capacity. It does not fix slow follow-up, loose qualification or a confusing path to Discovery Day. If those are the real constraint, a new rep simply pushes more candidates through the same leaky steps.
FranConnect’s 2025 Franchise Sales Index, built on platform data from 460+ brands and about 3.4 million leads, points the same way. From 2023 to 2025, lead volume grew just 7%, while lead-to-agreement conversion nearly doubled, from 0.76% to 1.50%. Most of the growth in signed agreements came from converting better, not from more leads.
The Index also shows how most leads are lost. The biggest closed-lost category is not candidates who said no or failed financial qualification. It is “unresponsive”: leads who responded once, were never reached, or stopped responding. The good news is that this number moves. No-response losses fell 30% across Index brands between 2023 and 2025. That makes it a process signal before it is a headcount signal.
Seven Franchise Development KPIs to Track Before You Hire
Track activity KPIs (speed, contact rate and selling time) monthly, by rep. Outcome KPIs need more patience. With an average cycle of 24 weeks, recent inquiry cohorts have not had time to close, so their close rates look artificially low. Judge close rates only on cohorts at least six months old, and use stage-entry rates and the age of open deals as early signals for newer ones.
1. Speed to First Contact
The time from inquiry to the first real contact attempt, split by business hours and after hours. Slow responses while reps still have open calendar time point to routing. Slow responses while every rep is fully booked point to capacity.
2. Contact Rate and Unresponsive Losses
The share of leads you actually reach, and the share of closed-lost leads marked unresponsive. Because non-response is the largest closed-lost reason among brands in FranConnect’s Index, a high rate here usually means your follow-up cadence needs work, not your headcount.
3. Lead-to-Qualified Rate
The share of inquiries that meet your qualification criteria. A low rate is usually a lead source or targeting problem. No new rep can convert candidates who were never a fit.
4. Stage Close Rates
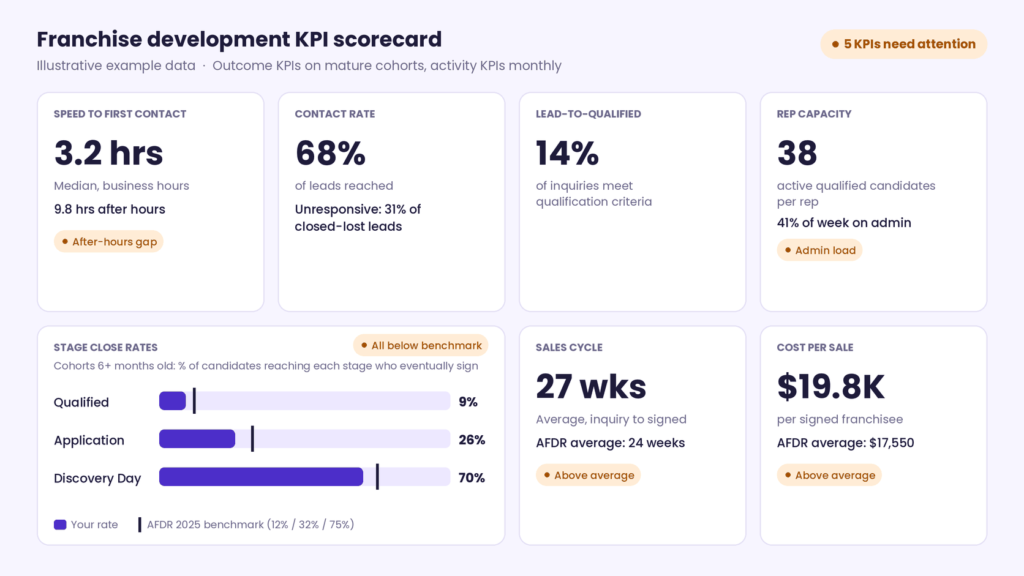
Of the candidates who reach each stage (qualified, application, Discovery Day), the share who eventually sign. This is how the AFDR reports its benchmarks, so it is the version you can compare directly with the table below. Track next-stage rates too, such as application to Discovery Day, to see where candidates stall, but compare close rates to the benchmark. Our guide on why qualified buyers drop off before Discovery Day covers the most common causes.
5. Sales Cycle Length
The weeks from first inquiry to signed agreement, measured by signing month. Track the average to compare with the AFDR’s 24-week figure, and the median so a few very slow deals do not skew the picture. Because this only counts deals that have signed, watch the age of open deals too: if they are getting older, your cycle is lengthening before the signed-deal numbers show it.
6. Cost per Lead and Cost per Sale, by Source
Track both, broken down by portal, broker, referral and website. Count lead and advertising spend only (portal fees, ads, events and broker fees), not salaries, and keep that definition fixed so the numbers stay comparable over time. That definition appears to match the AFDR’s basis. When you compare with the AFDR’s high-performer figures, leave broker deals out, as they do. Source mix often matters more than effort: in the FranConnect Index, internal network leads (existing franchisees, referrals and development prospecting) converted far better than internet leads.
7. Rep Capacity and Selling Time
Active qualified candidates per rep, and the share of each rep’s week spent in real candidate conversations rather than on data entry, scheduling and chasing documents. This is the only KPI on the list that measures capacity directly, so measure it before you hire.
How to Calculate Each KPI
| # | KPI | Formula | CRM fields needed | Cadence |
|---|---|---|---|---|
| 1 | Speed to first contact | Median time from inquiry to first contact attempt | Inquiry timestamp, first-attempt timestamp | Monthly, by rep; business vs. after hours |
| 2 | Contact rate | Leads reached ÷ leads received | Contact status | Monthly, by rep and source |
| 3 | Unresponsive losses | Leads closed as unresponsive ÷ all closed-lost leads | Closed-lost reason | Monthly, by rep and source |
| 4 | Lead-to-qualified rate | Qualified leads ÷ leads received | Qualification status, inquiry date | Monthly, by inquiry cohort |
| 5 | Stage close rate | Signed agreements ÷ candidates who reached the stage | Stage-entry dates, signed date | Inquiry cohorts at least six months old; stage-entry rates for newer cohorts |
| 6 | Sales cycle length | Average and median weeks from inquiry to signed agreement | Inquiry date, signed date | By signing month, plus open-deal age |
| 7 | Cost per lead / cost per sale | Lead and advertising spend by source (no salaries) ÷ leads; same spend ÷ signed agreements | Lead source, spend by source | Quarterly, by source |
| 8 | Rep capacity | Active qualified candidates ÷ reps | Lead owner, stage | Monthly, by rep |
| 9 | Selling time | Hours in candidate conversations ÷ hours worked | Activity log or time sample | Monthly, by rep |
Franchise Development KPI Benchmarks
| KPI | Industry reference | Source |
|---|---|---|
| Leads to signed agreement | 2% (2025) | AFDR |
| Of qualified leads, share who sign | 12% | AFDR |
| Of applicants, share who sign | 32% | AFDR |
| Of Discovery Day attendees, share who sign | 75% | AFDR |
| Average sales cycle | 24 weeks | AFDR |
| Cost per lead | $351 average; $343 for high performers (nonbroker) | AFDR |
| Cost per signed franchisee | $17,550 average; $13,332 for high performers (nonbroker) | AFDR |
| Conversion by lead source | Internal network 18.9%, trade show 13.5%, brokers 3.9%, internet 0.9%, franchise website 0.6% | FranConnect |
| Speed to first contact | No universal threshold; set internal targets | FranConnect |
| Rep capacity | No reliable industry benchmark; set internal targets | — |
Sources: Franchise Update Media, 2026 Annual Franchise Development Report (2025 data); FranConnect, 2025 Franchise Sales Index. “High performers” are AFDR respondents that exceeded their recruitment goals; their figures exclude broker deals, so they are a target rather than a like-for-like comparison with the averages. The AFDR is a survey of franchisors, while the Index is behavioral data from brands on FranConnect’s platform, which is why their overall conversion rates differ (2% vs. 1.50%). Compare yourself with one source consistently.
Capacity Problem or Process Problem? A Simple Test
Activity KPIs need about one quarter of data. Outcome KPIs need two quarters or more, so recent cohorts have time to close. Then match what you see to the most likely cause.
| If you see this | It is most likely | Fix this first |
|---|---|---|
| Slow first response, but reps have open calendar time | A routing problem | Route inquiries instantly and cover after-hours leads |
| A high share of leads closed as unresponsive | A follow-up problem | Set a standard multi-channel follow-up cadence |
| A low lead-to-qualified rate | A lead source problem | Move spend toward sources that convert |
| One stage’s close rate far below the benchmark | A stage-specific problem | Fix that stage, such as FDD walkthroughs or validation support |
| Reps spend much of their week on admin | A workflow problem | Remove admin before adding people |
| Close rates near benchmark, admin reduced, reps fully booked and response times slipping | A real capacity problem | Hire |
The rule is simple: hire when the numbers show your process works and your people are full. Until then, every new rep multiplies the leak instead of closing it.
Does Another Rep Pay Off? A Simple Break-Even
Run the numbers before you post the job. Here is a hypothetical example:
- A new development rep costs $120,000 a year, fully loaded with salary, commission, benefits and tools.
- Each new franchise brings a $40,000 initial fee. Subtract the AFDR’s average $17,550 cost to secure a franchisee, and each signing nets about $22,450 before royalties.
- The rep needs at least six extra signings a year ($120,000 ÷ $22,450 ≈ 5.3) just to cover their own cost, before any ramp-up time.
Two caveats raise that bar. First, an initial fee is not pure margin: part of it funds training, onboarding and any broker commission. Second, this example treats the $17,550 as a lead and advertising cost and counts the rep separately. That is an assumption: the AFDR describes its development budgets as advertising spend, not salaries or overhead, but does not spell out what its cost-per-sale figure includes. If your own cost per sale already includes sales payroll, do not subtract it twice.
Now compare a process fix. If after-hours routing and better follow-up close the gap between a 10% qualified-lead close rate and the AFDR’s 12% benchmark, across 300 qualified leads a year, that is also six more signings, at a lower and mostly one-time cost for tooling and setup.
Hypothetical example. Use your own franchise fee, royalty value and rep costs. Royalties over the agreement term raise the value of each signing and lower the break-even point.
Want help turning these KPIs into a working scorecard from your CRM data? Book a demo call with Weam.
Where AI Fits Before You Hire
AI will not replace a good development rep, but it can give back the hours your reps lose to admin. According to the AFDR, 52% of brands already use AI in franchise development, yet 68% say it is too soon to tell whether it is driving more deals. Most of that use sits in email personalization and chatbots, while only 9% use AI for candidate screening.
The better starting point is the work behind your KPIs. Governed AI workflows can log every inquiry, send an approved first response after hours, book first calls, chase missing documents and compile a weekly KPI report. We cover similar workflows in 10 AI workflows that stop revenue leaks for multi-location businesses, and the wider shift in how AI is transforming franchise development.
Keep people in charge of qualification decisions, disclosure and anything touching earnings. Our guide to AI governance for franchisors shows how to set those guardrails. Weam works with franchise teams as an AI implementation partner, designing these workflows with clear approval rules.
Frequently Asked Questions
What are the most important franchise development KPIs?
Speed to first contact, contact rate, lead-to-qualified rate, stage close rates, sales cycle length, cost per lead and cost per sale by source, and rep capacity. Together they show where candidates stall and whether your team is truly at capacity.
What is a good franchise sales conversion rate?
The 2026 AFDR reports that 2% of all leads become signed franchisees, while FranConnect’s platform data shows 1.50%. Rates vary widely by sector: FranConnect found QSR brands converting at 2.81% and full-service restaurants at 0.44%. Benchmark against your own sector and history.
How many signings does a franchise sales rep need to pay for themselves?
Divide the rep’s fully loaded annual cost by the net value of one signing: the initial fee minus onboarding, commission and acquisition costs, before royalties. In the hypothetical break-even example above, a $120,000 rep needs at least six extra signings a year. Use your own fee, costs and royalty value.
How many candidates should one franchise development rep manage?
There is no reliable industry benchmark. Track active qualified candidates per rep alongside response time. The point where response times start slipping is your real capacity limit.
When should a franchisor hire another franchise sales rep?
When stage close rates are near benchmark, admin has already been reduced, and reps are fully booked while response times slip. Before that, fixing the process usually delivers more deals for less money.
Measure First, Then Hire
At $17,550 per signed franchisee, every hiring decision in franchise development should start with data. Track these seven franchise development KPIs for two quarters, run the capacity test and the break-even, and fix the process gaps they reveal. If your reps are still full after that, you will hire with confidence and know exactly what the new person needs to fix.
If you want to see how governed AI workflows could free up your development team’s time before you add headcount, book a demo call with Weam.