Visual Studio March Update – Build Your Own Custom Agents


This month’s Visual Studio update gives you new ways to customize GitHub Copilot. Custom agents allow you to build specialized Copilot agents tailored to your team’s workflow, backed by the tools and knowledge sources that matter to your project. Alongside that, agent skills bring reusable instruction sets, and a new find_symbol tool gives agents language-aware navigation across your codebase.

Beyond agents, we’re continuing to invest in the diagnostics experience with Copilot-powered profiling directly from Test Explorer and real-time perf tips during debugging. Security gets a boost too, with Copilot now helping you fix NuGet vulnerabilities right from Solution Explorer.

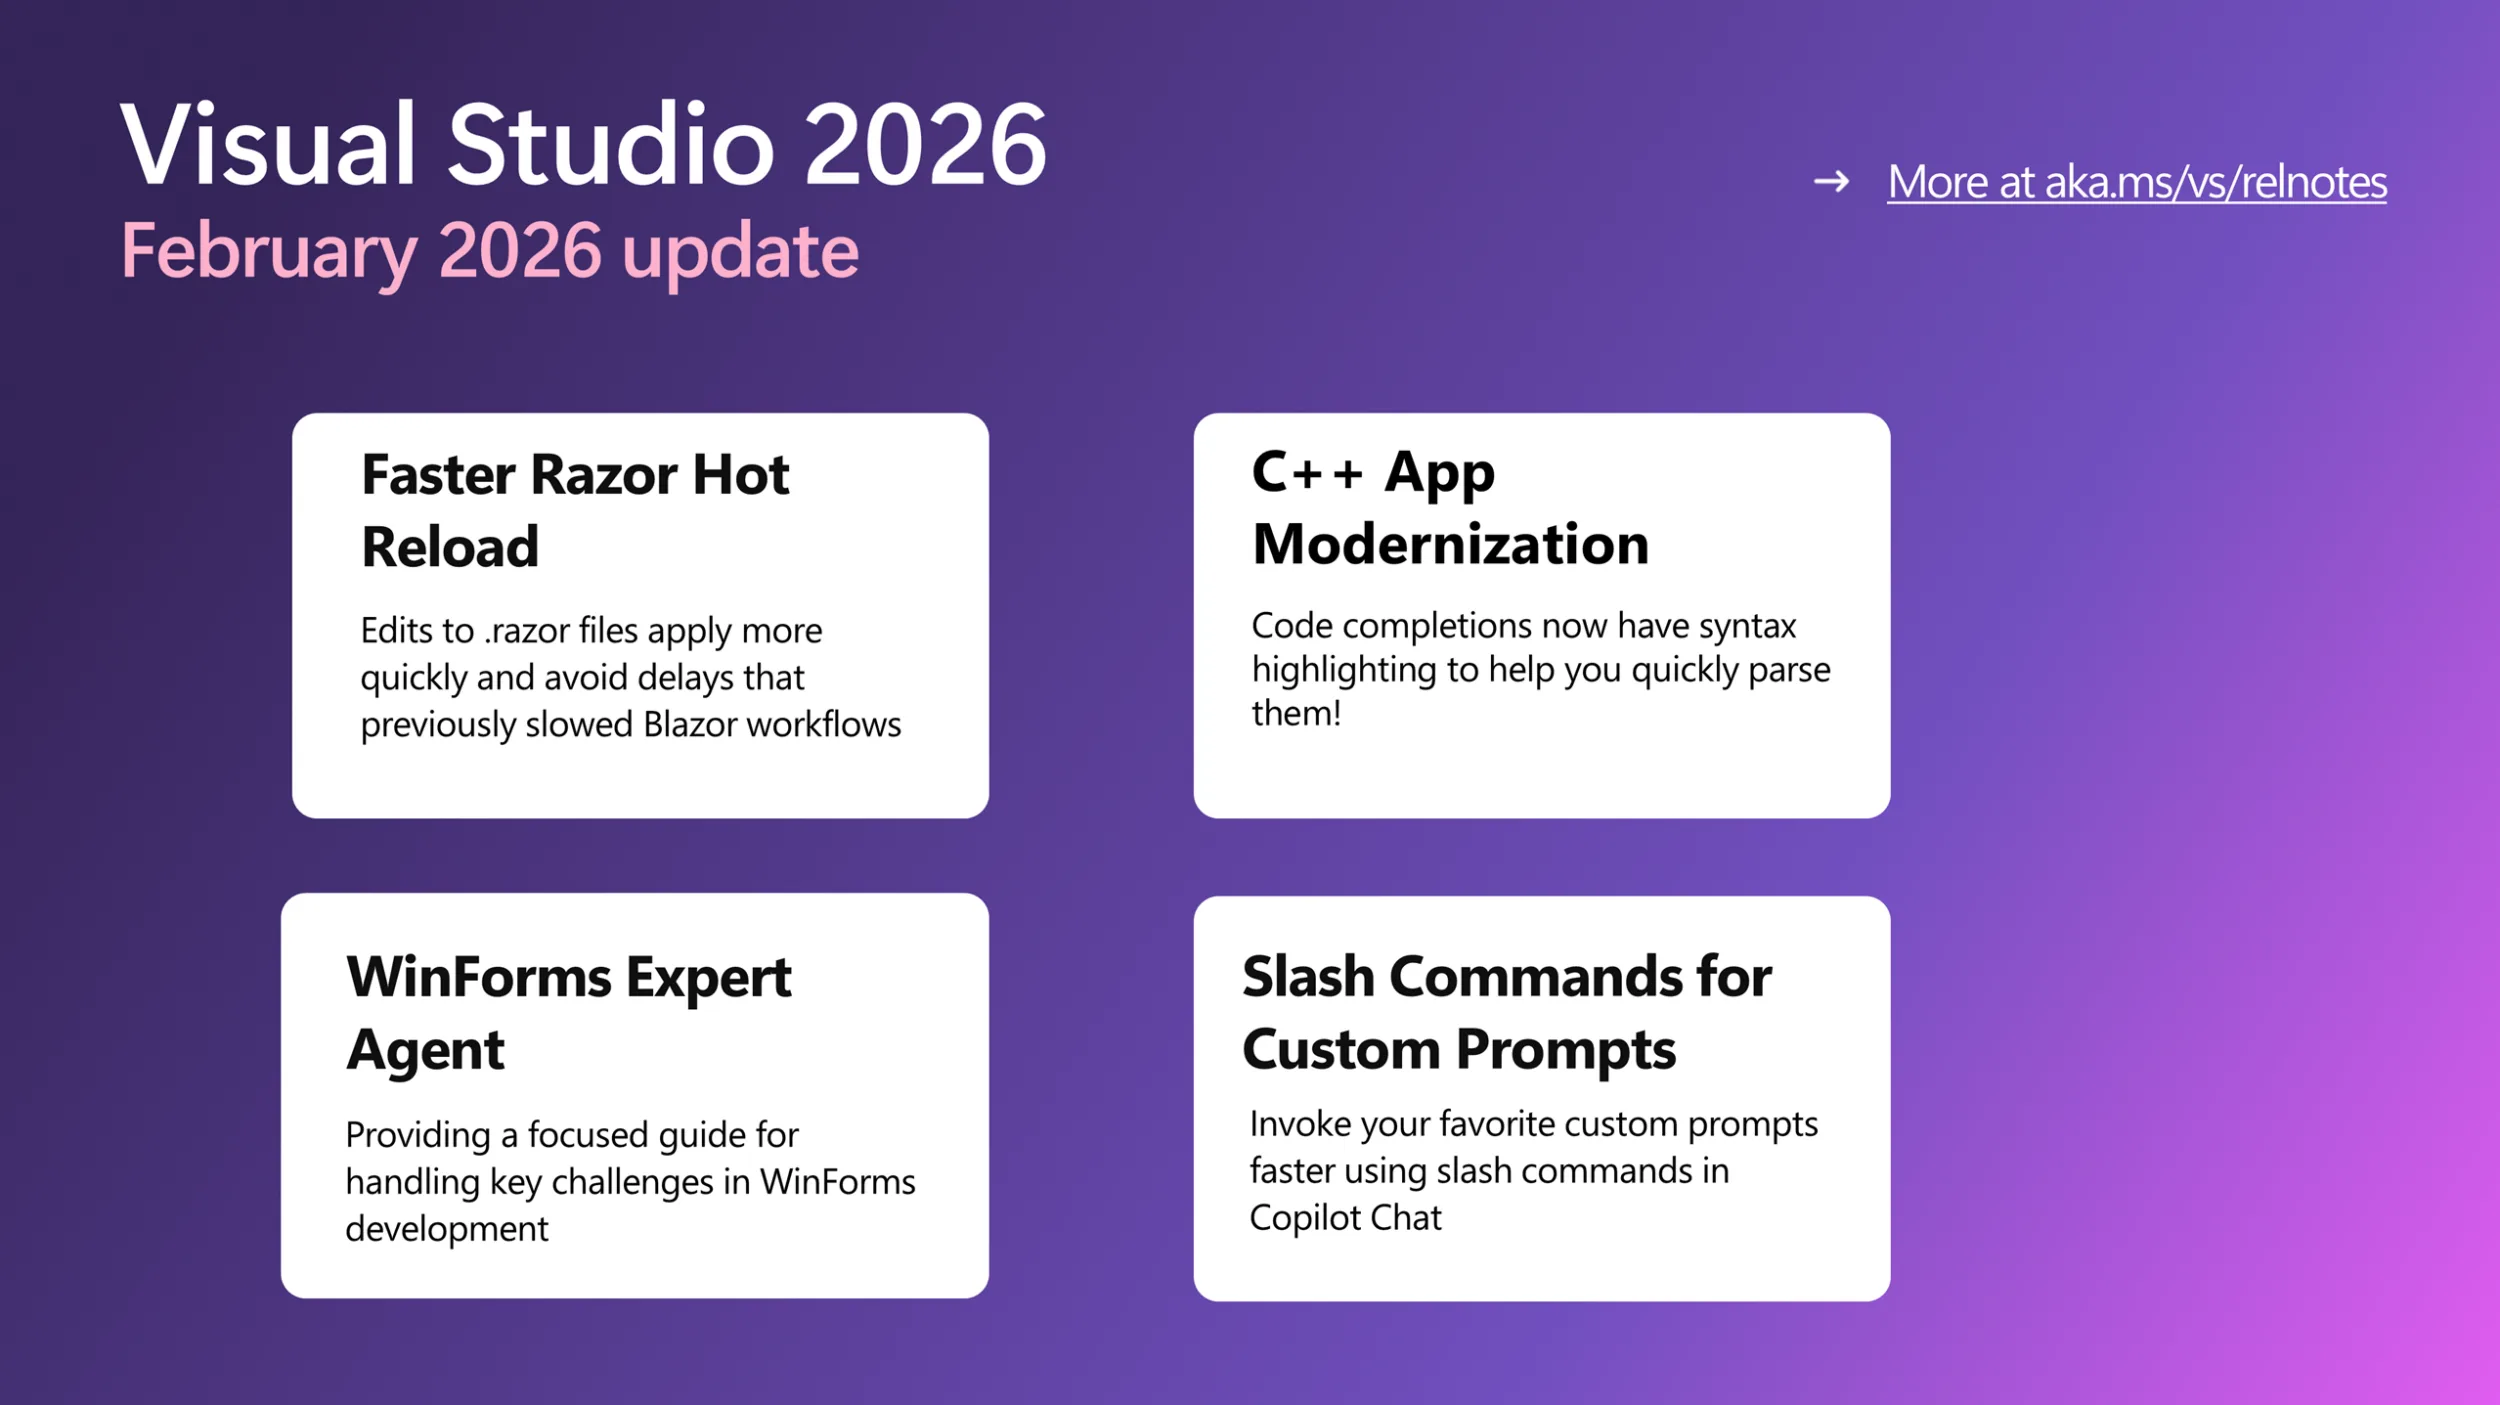
Download Visual Studio 2026 Insiders to try these features today.

Build your own custom agents

Want Copilot to follow your team’s coding standards, run your build pipeline, or query your internal docs? Custom agents make that possible. They’re specialized Copilot agents defined as .agent.md files in your repository, with full access to workspace awareness, code understanding, tools, your preferred model, and MCP connections to external knowledge sources.

Drop an .agent.md file into .github/agents/ in your repo, and it shows up in the agent picker ready to use.

vs18 4 custom agents image

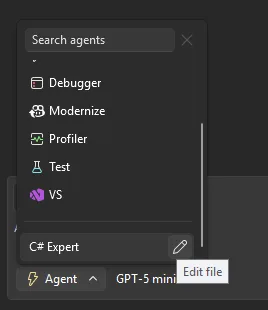
A few things to keep in mind: if you don’t specify a model, the agent uses whatever you’ve selected in the model picker. Tool names can vary across GitHub Copilot platforms, so check the tools available in Visual Studio to make sure your agent works as expected. The awesome-copilot repo has community-contributed agent configurations you can use as starting points.

Use agent skills

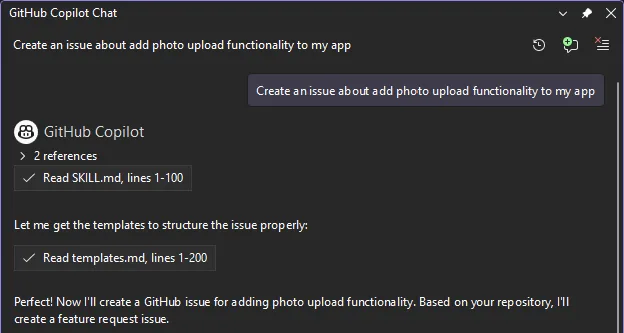
Skills are picked up automatically from several locations in your repository (such as .github/skills/) or your user profile (such as ~/.copilot/skills/). Each skill lives in its own directory with a `SKILL.md` file that follows the Agent Skills specification. When a skill is activated, it appears in the chat so you know it’s being applied.

vs18 4 agent skills image

Check out the awesome-copilot repo for community-shared skills, and look for more user-friendly flows for browsing and creating skills inside Visual Studio in upcoming releases.

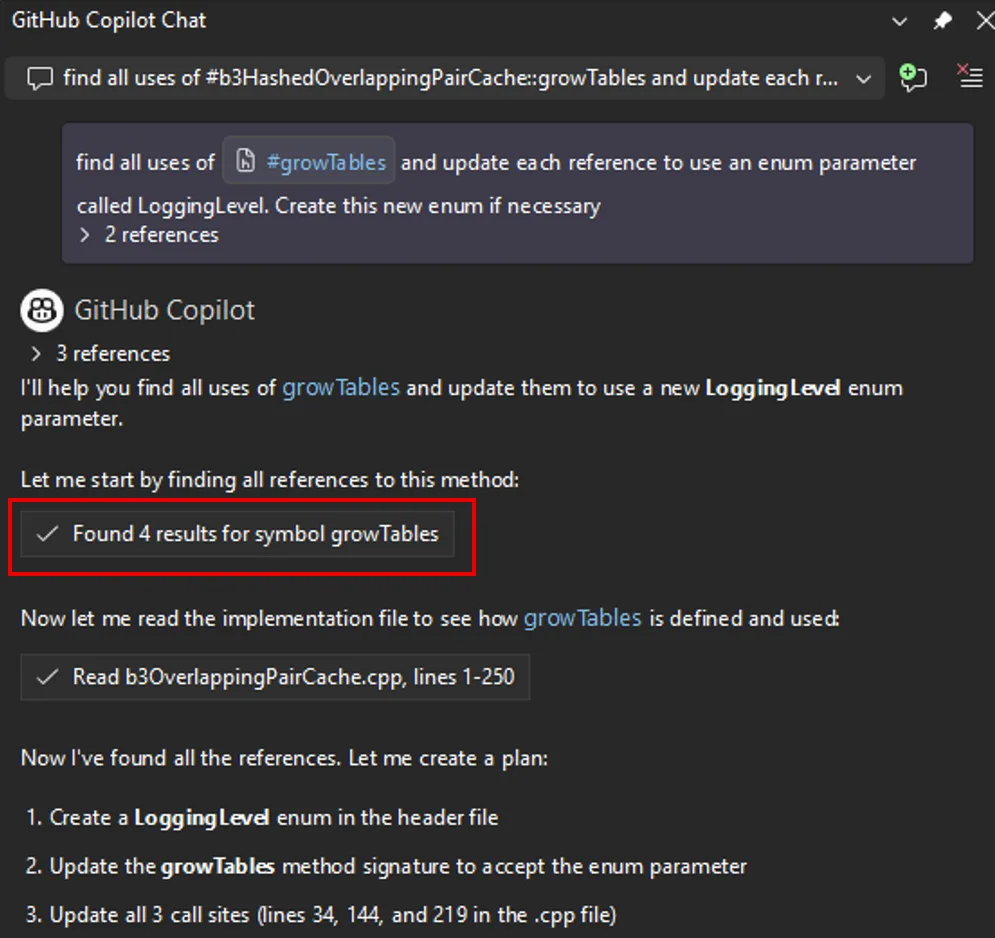
Find_symbol tool for agent mode

Copilot’s agent mode now has language-aware symbol navigation. The new find_symbol tool lets the agent find all references to symbols across your project and access metadata like type information, declarations, and scope. This means when you ask Copilot to refactor a method or update a parameter across call sites, it can actually see your code’s structure rather than guessing from text.

vs18 4 find symbol image

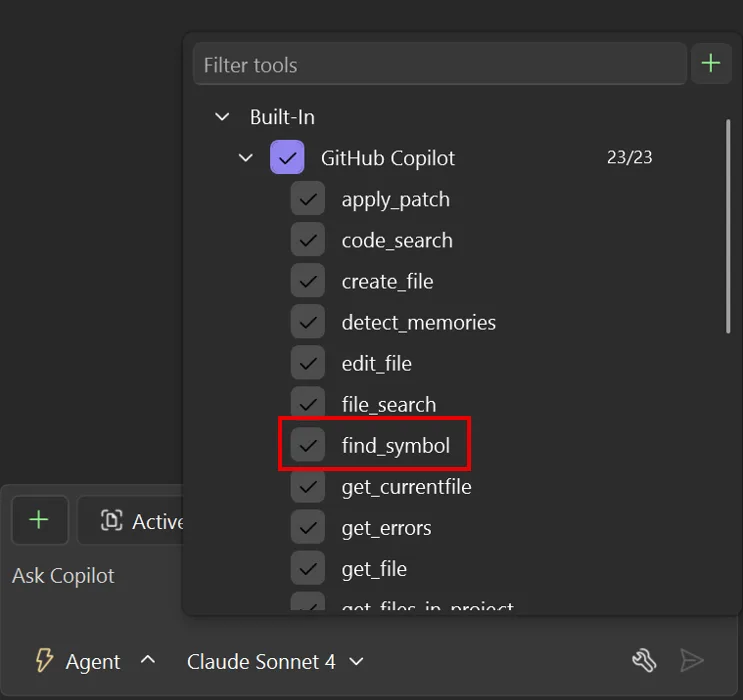
Enable the tool, and Copilot uses it automatically when answering questions or suggesting code changes. The difference is noticeable: instead of searching for text patterns, the agent navigates your code using language services.

vs18 4 find symbol example image

Supported languages include C++, C#, Razor, and TypeScript, plus any language with a supported LSP extension installed. For best results, use AI models that support tool-calling. Learn more at AI model comparison.

Enterprise MCP governance

MCP server usage in Visual Studio now respects allowlist policies set through GitHub. Admins can specify which MCP servers are allowed within their organizations. When an allowlist is configured, only approved servers can be connected. If you try to use an unauthorized server, you’ll see an error explaining the restriction. This helps organizations control which MCP servers process sensitive data and maintain compliance with security policies.

Profile Tests with Copilot

Ever wanted to profile a specific test without wrestling with profiler configuration? There’s now a Profile with Copilot command right in the Test Explorer context menu.

vs18 4 profile test with copilot image

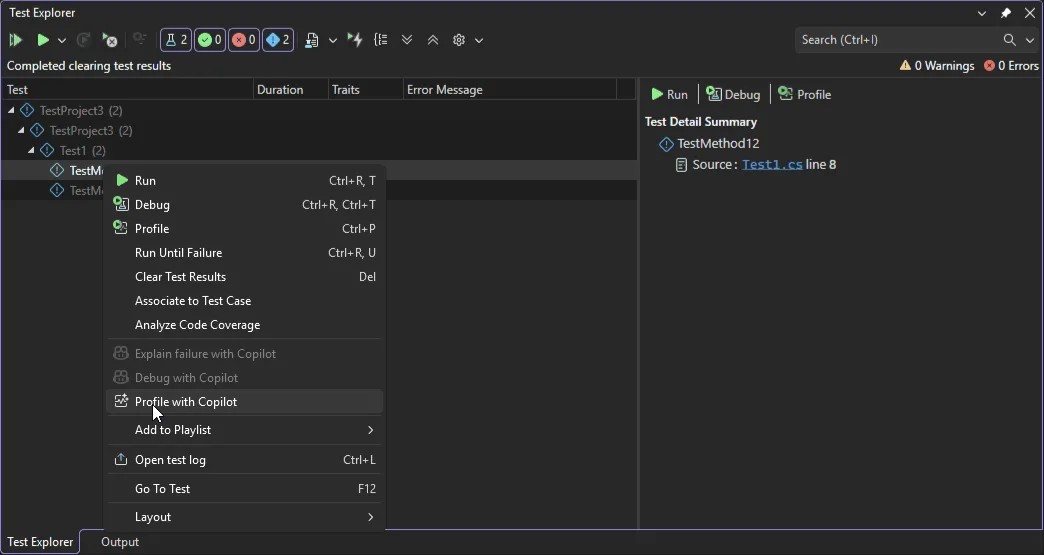
When selected, the Profiling Agent automatically runs the chosen test and analyzes its performance, combining CPU usage and instrumentation data to deliver actionable insights. By default, it uses Instrumentation profiling and is currently supported in .NET. If you need deeper analysis, you can launch the selected test directly from the Copilot chat window and choose additional profiling tools.

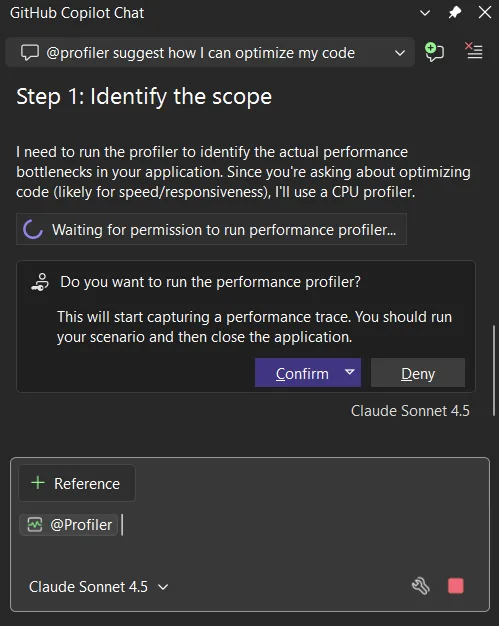
Perf tips powered by live profiling

Performance optimization now happens while you debug, not after. As you step through code, Visual Studio shows execution time and performance signals inline for each step. When you spot a slow line, just click the Perf Tip and ask Copilot for optimization suggestions on the spot.

vs18 4 profiler agent perf tip image

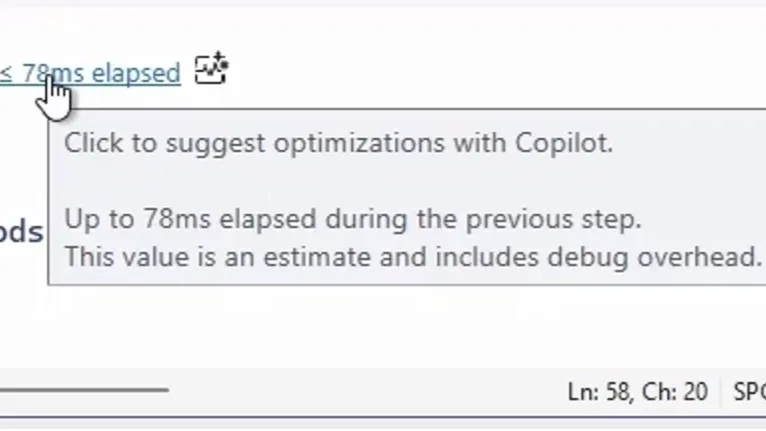
The Profiler Agent captures runtime data during debugging automatically: elapsed time, CPU usage, and memory behavior. Copilot uses this data to pinpoint performance hot spots and suggest targeted fixes. This keeps optimization part of your regular debugging workflow instead of something you tackle later.

Fix vulnerabilities with Copilot

Spotted a NuGet package vulnerability? Copilot can now help you fix it directly from Solution Explorer. When a vulnerability is detected, you’ll see a notification with a Fix with GitHub Copilot link. Click through, and Copilot analyzes the vulnerability, recommends and implements targeted dependency updates that keep your packages secure without disrupting your workflow.

vs18 4 fix with copilot link image

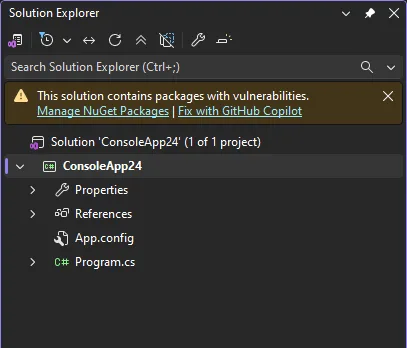
No more manual vulnerability research or hunting down correct package versions. You address security issues right when they’re discovered.

HTML rich copy/cut

Need to paste code into a presentation, an Azure DevOps work item, or a web-based document? Visual Studio now supports HTML clipboard format when cutting or copying code from the editor. Syntax highlighting and formatting carry over when you paste into HTML-based applications. It’s turned on by default. To customize, go to Tools > Options > Text Editor > Advanced where you can toggle Copy rich text on copy/cut and set the max length.

From our entire team, thank you for choosing Visual Studio! For the latest updates, resources, and news, check out the Visual Studio Hub and stay in touch.

Happy coding!

The Visual Studio team

Visual Studio February Update – Visual Studio Blog


This month’s Visual Studio update continues our focus on helping you move faster and stay in flow, with practical improvements across AI assistance, debugging, testing, and modernization. Building on the momentum from January’s editor updates, the February release brings smarter diagnostics and targeted support for real world development scenarios, from WinForms maintenance to C++ modernization.

All of the features highlighted are available in the Visual Studio 2026 Stable Channel as part of the February 2026 feature update (18.3). Please update to the latest version to try out these new features!

WinForms Expert Agent

The WinForms Expert agent provides a focused guide for handling key challenges in WinForms development. It covers several important areas:
Designer vs. regular code: Understand which C# features apply to designer-generated code and business logic.

  • Modern .NET patterns: Updated for .NET 8-10, including MVVM with Community Toolkit, async/await with proper InvokeAsync overloads, Dark mode with high-DPI support, and nullable reference types.
  • Layout: Advice on using TableLayoutPanel and FlowLayoutPanel for responsive, cross-device design.
  • CodeDOM serialization: Rules for property serialization and avoiding common issues with [DefaultValue] and ShouldSerialize*() methods.
  • Exception handling: Patterns for async event handlers and robust application-level error handling.

The agent serves as an expert reviewer for your WinForms code, providing comprehensive guidance on everything from naming controls to ensuring accessibility. The WinForms Agent is automatically implemented and included in the system prompt when necessary.

Smarter Test Generation with GitHub Copilot

Visual Studio now includes intelligent test generation with GitHub Copilot, making it faster to create and refine unit tests for your C# code. This purpose-built workflow works seamlessly with xUnit, NUnit, and MSTest.

GitHub Copilot Chat pane in Visual Studio showing a new chat thread. The Copilot Chat welcome screen appears with a message about checking accuracy, a prompt asking ‘generate tests for my entire solution,’ and the selected model labeled Claude Haiku 4.5. The input box includes a reference button and test generation command.

Simply type @Test in GitHub Copilot Chat, describe what you want to test, and Copilot generates the test code for you. Whether you’re starting fresh or improving coverage on existing projects, this feature helps you write tests faster without leaving your workflow.

Slash Commands for Custom Prompts

Invoke your favorite custom prompts faster using slash commands in Copilot Chat. Type / and your custom prompts appear at the top of the list, marked with a bookmark icon for easy identification.

Copilot Chat slash command menu in Visual Studio showing available commands such as quality check, clear, explain, fix, and generate, with Agent mode enabled and Claude Sonnet 4.5 selected in the chat input area.

We’ve also added two additional commands:

/generateInstructions: Automatically generate a copilot-instructions.md file for your repository using project context like coding style and preferences

/savePrompt: Extract a reusable prompt from your current chat thread and save it for later use via / commands

These shortcuts make it easier to build and reuse your workflow patterns.

C++ App Modernization

GitHub Copilot app modernization for C++ is now available in Public Preview. GitHub Copilot app modernization for C++ helps you update your C++ projects to use the latest versions of MSVC and to resolve upgrade-related issues. You can find our user documentation on Microsoft Learn.

Split view in Visual Studio showing a Markdown file on the left and a rendered preview on the right with an Executive Summary and Key Findings for an MSVC Build Tools upgrade including errors and warnings.

DataTips in IEnumerable Visualizer

You can now use DataTips in the IEnumerable Visualizer while debugging. Just hover over any cell in the grid to see the full object behind that value, the same DataTip experience you’re used to in the editor or Watch window.

When you hover over a cell, a DataTip shows all the object’s properties in one place. This makes it much easier to debug collections with complex or nested data. Whether it’s a List<T> of objects or a dictionary with structured values, one hover lets you quickly inspect everything inside.

Visual Studio IEnumerable Visualizer showing the expression lpvm.Posts. A table displays one row with columns for PostViewModel properties, including Categories with a count of one, AllCategories, NewCategory, and AllowComments set to True. A tooltip shows a CategoryViewModel object with an option to view raw data.

Analyze Call Stack with Copilot

You can now Analyze Call Stack with Copilot to help you quickly understand what your app is doing when debugging stops. When you pause execution, you can select Analyze with Copilot in the Call Stack window. Copilot reviews the current stack and explains why the app isn’t progressing whether the thread is waiting on work, looping, or blocked by something.

This makes the call stack more than just a list of frames. It becomes a helpful guide that shows what’s happening in your app so you can move faster toward the real fix.

Profiler agent with Unit Test support

The Profiler Agent (@profiler) now works with unit tests. You can use your existing tests to check performance improvements, making it easier to measure and optimize your code in more situations. The agent can discovers relevant unit tests/BenchmarkDotNet benchmarks that exercise performance-critical code paths.

If no good tests or benchmarks are available, it automatically creates a small measurement setup so you can capture a baseline and compare results after changes. This unit-test-focused approach also makes the Profiler Agent useful for C++ projects, where benchmarks aren’t always practical, but unit tests often already exist.

GitHub Copilot Chat showing profiler suggestion to optimize code step identify scope message requesting permission to run CPU performance profiler with confirm and deny buttons and model selector visible

Faster and More Reliable Razor Hot Reload

Hot Reload for Razor files are now faster and more reliable. By hosting the Razor compiler inside the Roslyn process, edits to .razor files apply more quickly and avoid delays that previously slowed Blazor workflows. We also reduced the number of blocked edits, with more changes now applying without requiring a rebuild, including file renames and several previously unsupported code edits. When a rebuild is still required, Hot Reload can now automatically restart the app instead of ending the debug session, helping you stay in flow.

We are continuing to invest in features that help you understand, test, and improve existing code, not just write new code. Try these updates in the Visual Studio 2026 Stable Channel and let us know what is working well and where we can improve. Your feedback directly shapes what we build next.