Microsoft Build kicks off today in San Francisco, June 2 and 3. If you cannot make it in person, the sessions are streaming online for free, and I want to walk you through what we are announcing for Visual Studio this week.
One idea tie most of it together. Code is an asset, not just an artifact. The tools around it should help you keep it healthy, correct, and easy to evolve as your codebase grows. Every announcement below is a step toward that.
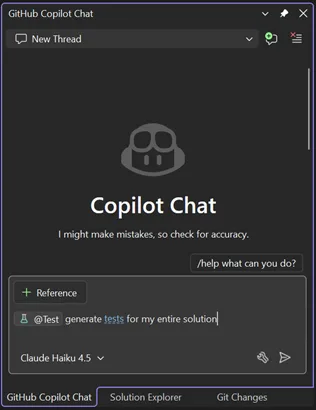
Agents that participate in the work, not next to it
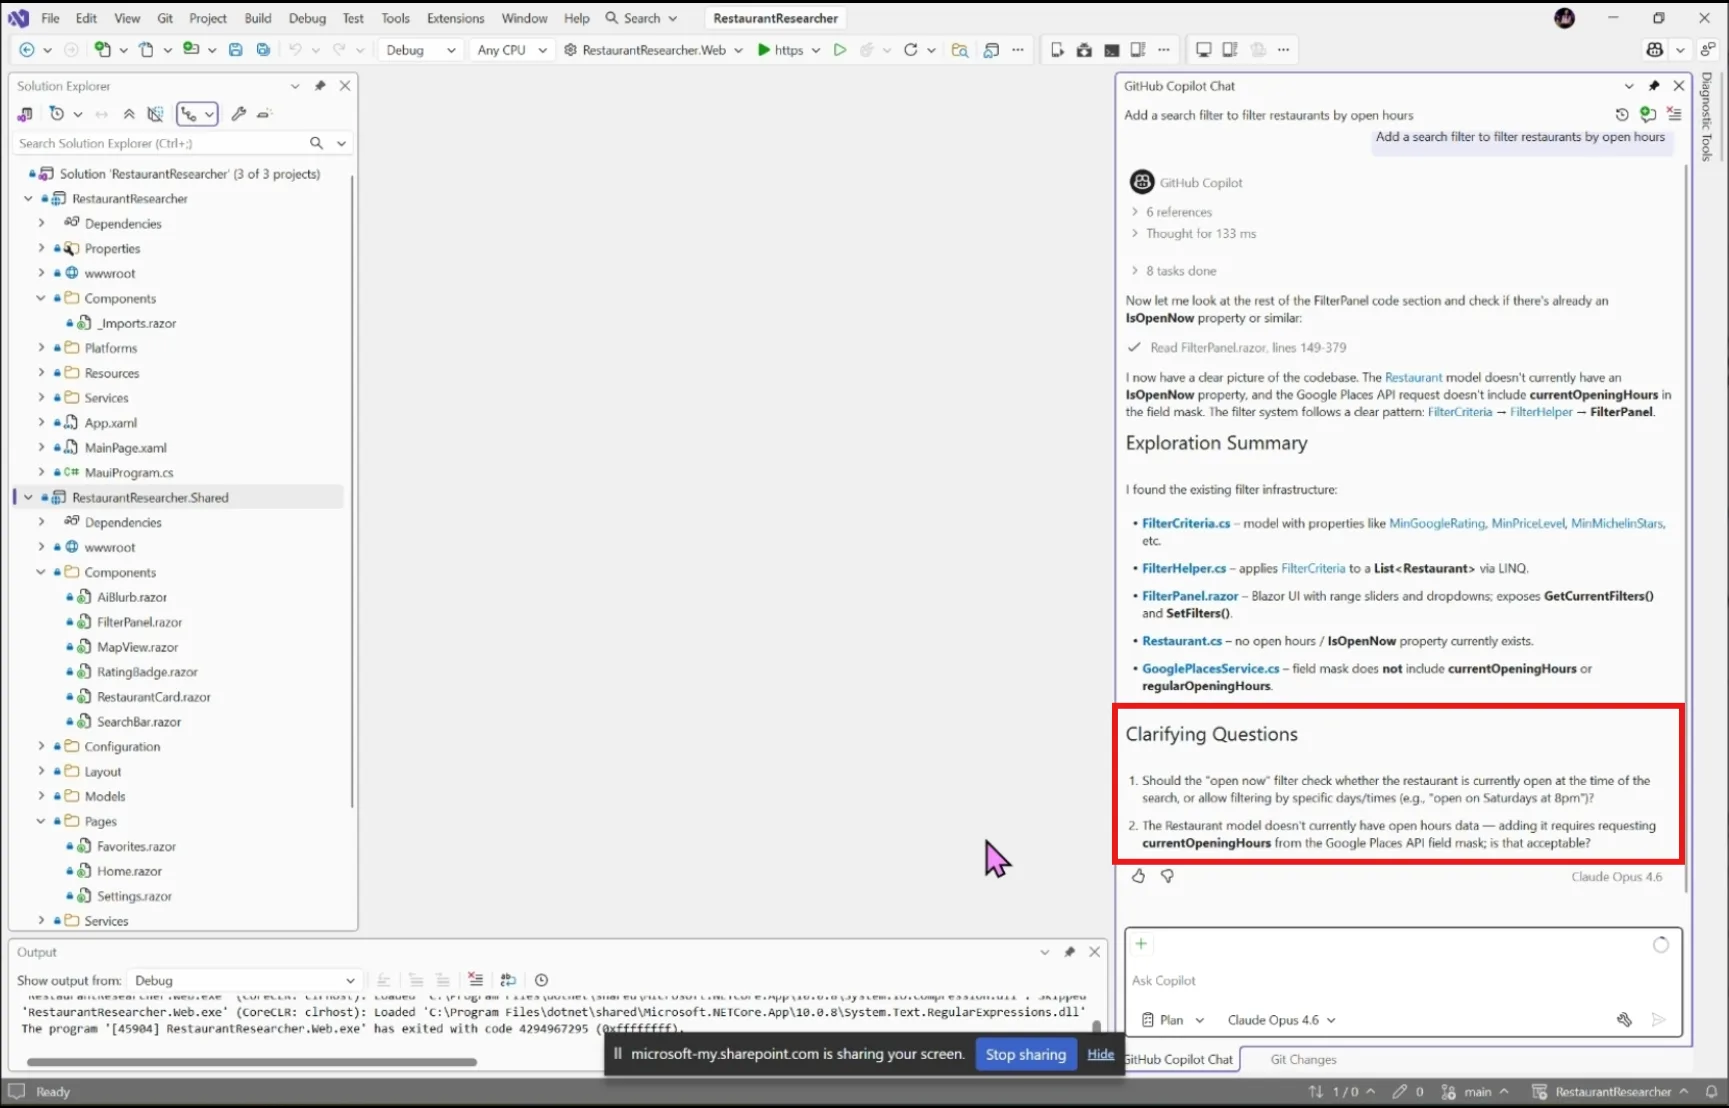
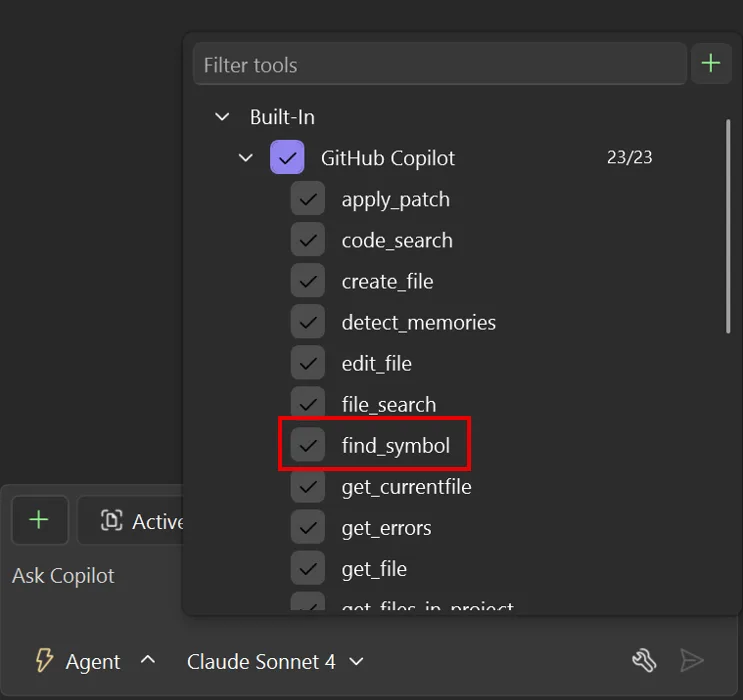
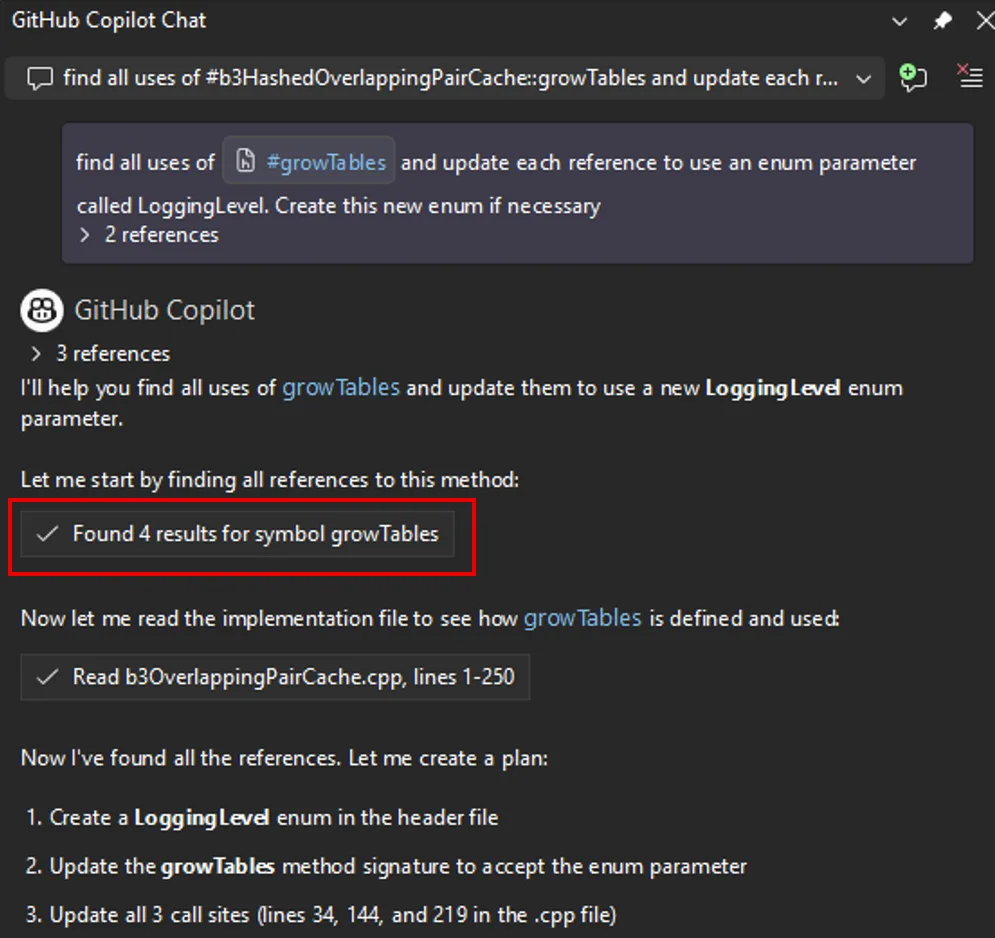
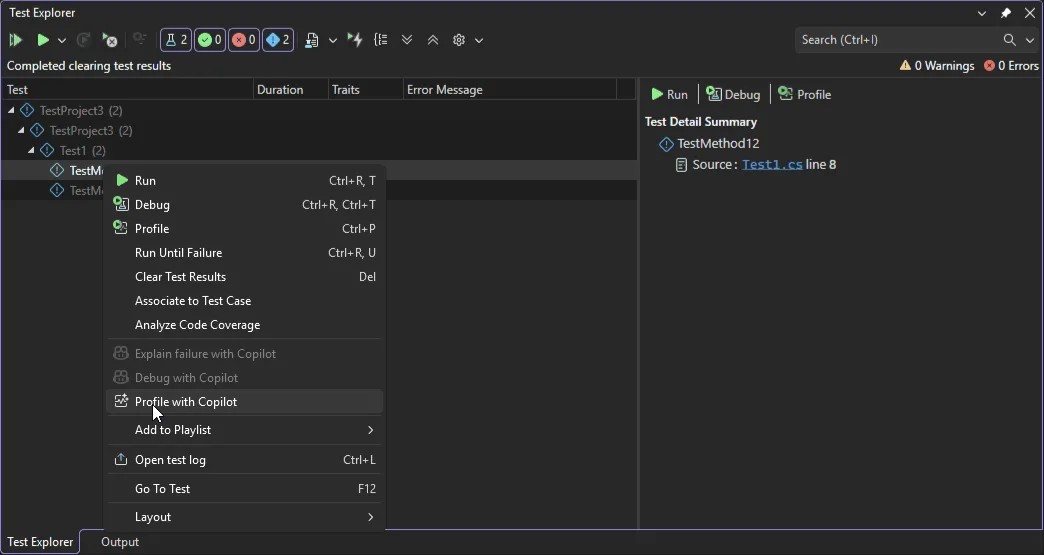
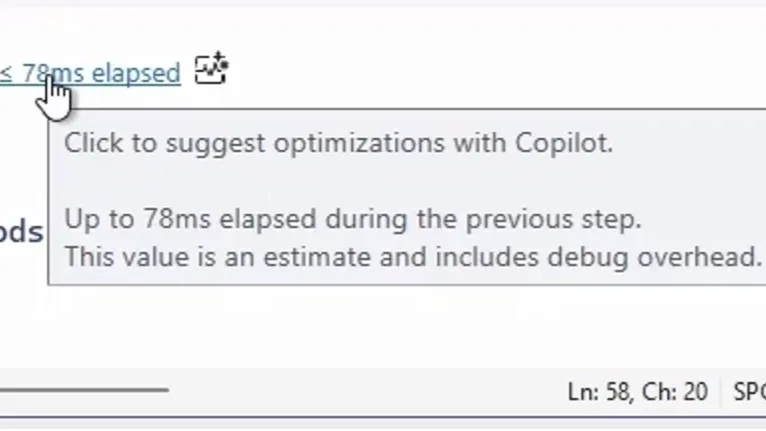
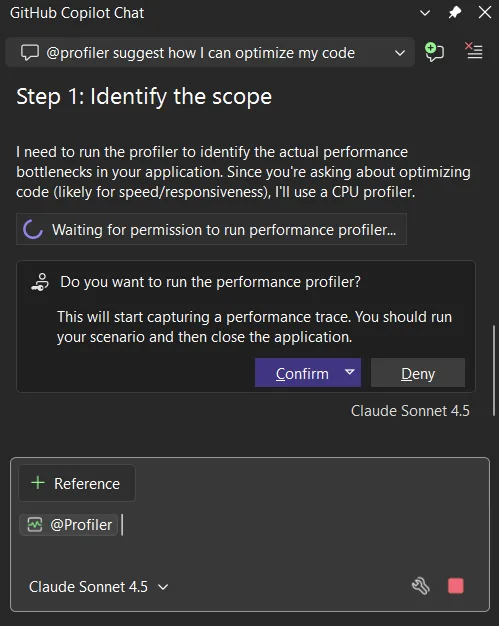
GitHub Copilot in Visual Studio is moving beyond chat and completions. The direction is agents that can participate more actively in the development lifecycle, helping with debugging, profiling, and testing alongside you.
This is not about replacing the tools you already rely on. It is about connecting them more effectively. The debugger, profiler, and test tools already provide deep insight. Agents help turn that insight into action:
- Identify issues faster
- Explain what is going on
- Suggest concrete fixes
- Help validate the results
This matters most if you work in large C# or C++ codebases where the hard problems are not “write this function” but “figure out why this thing is slow under load.” That is the work Visual Studio has always been built for. Agents extend it.
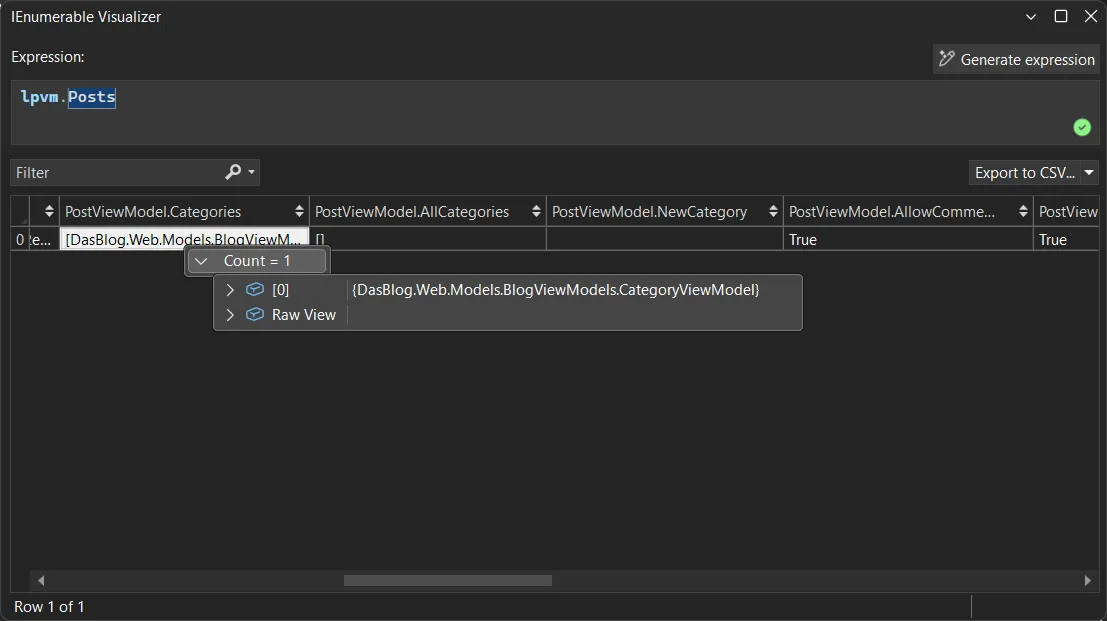
Catching errors before the build starts
This one is small and I think you will notice it daily.
Today, a build can still run even when there are obvious errors already sitting in the Error List. The build runs, you wait, the build fails on something you could have seen up front.
We are changing that flow so Visual Studio checks errors and warnings before the build starts. Simple change. Real time saved. The kind of thing that adds up across a week.
Merge conflicts with less manual work
Merge conflicts are something every developer runs into, and they are rarely a good use of anyone’s time.
We are working on AI-assisted conflict resolution to reduce the manual effort these situations require. The goal is not to auto-merge everything. The goal is to help you understand the conflict, make a sensible decision, and get back to the work you were actually doing.
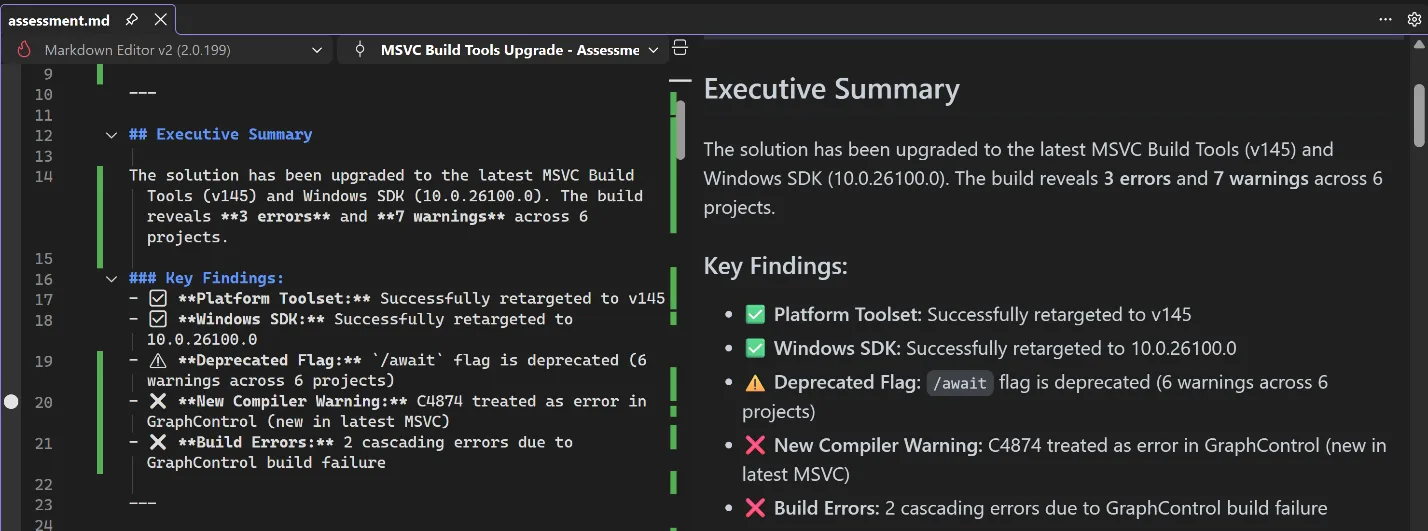
Modernization that moves your apps forward
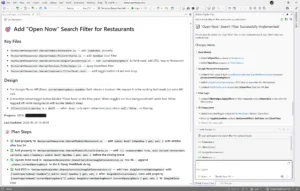
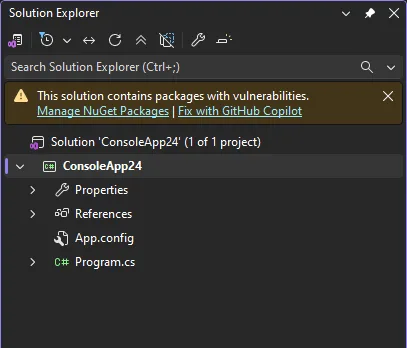
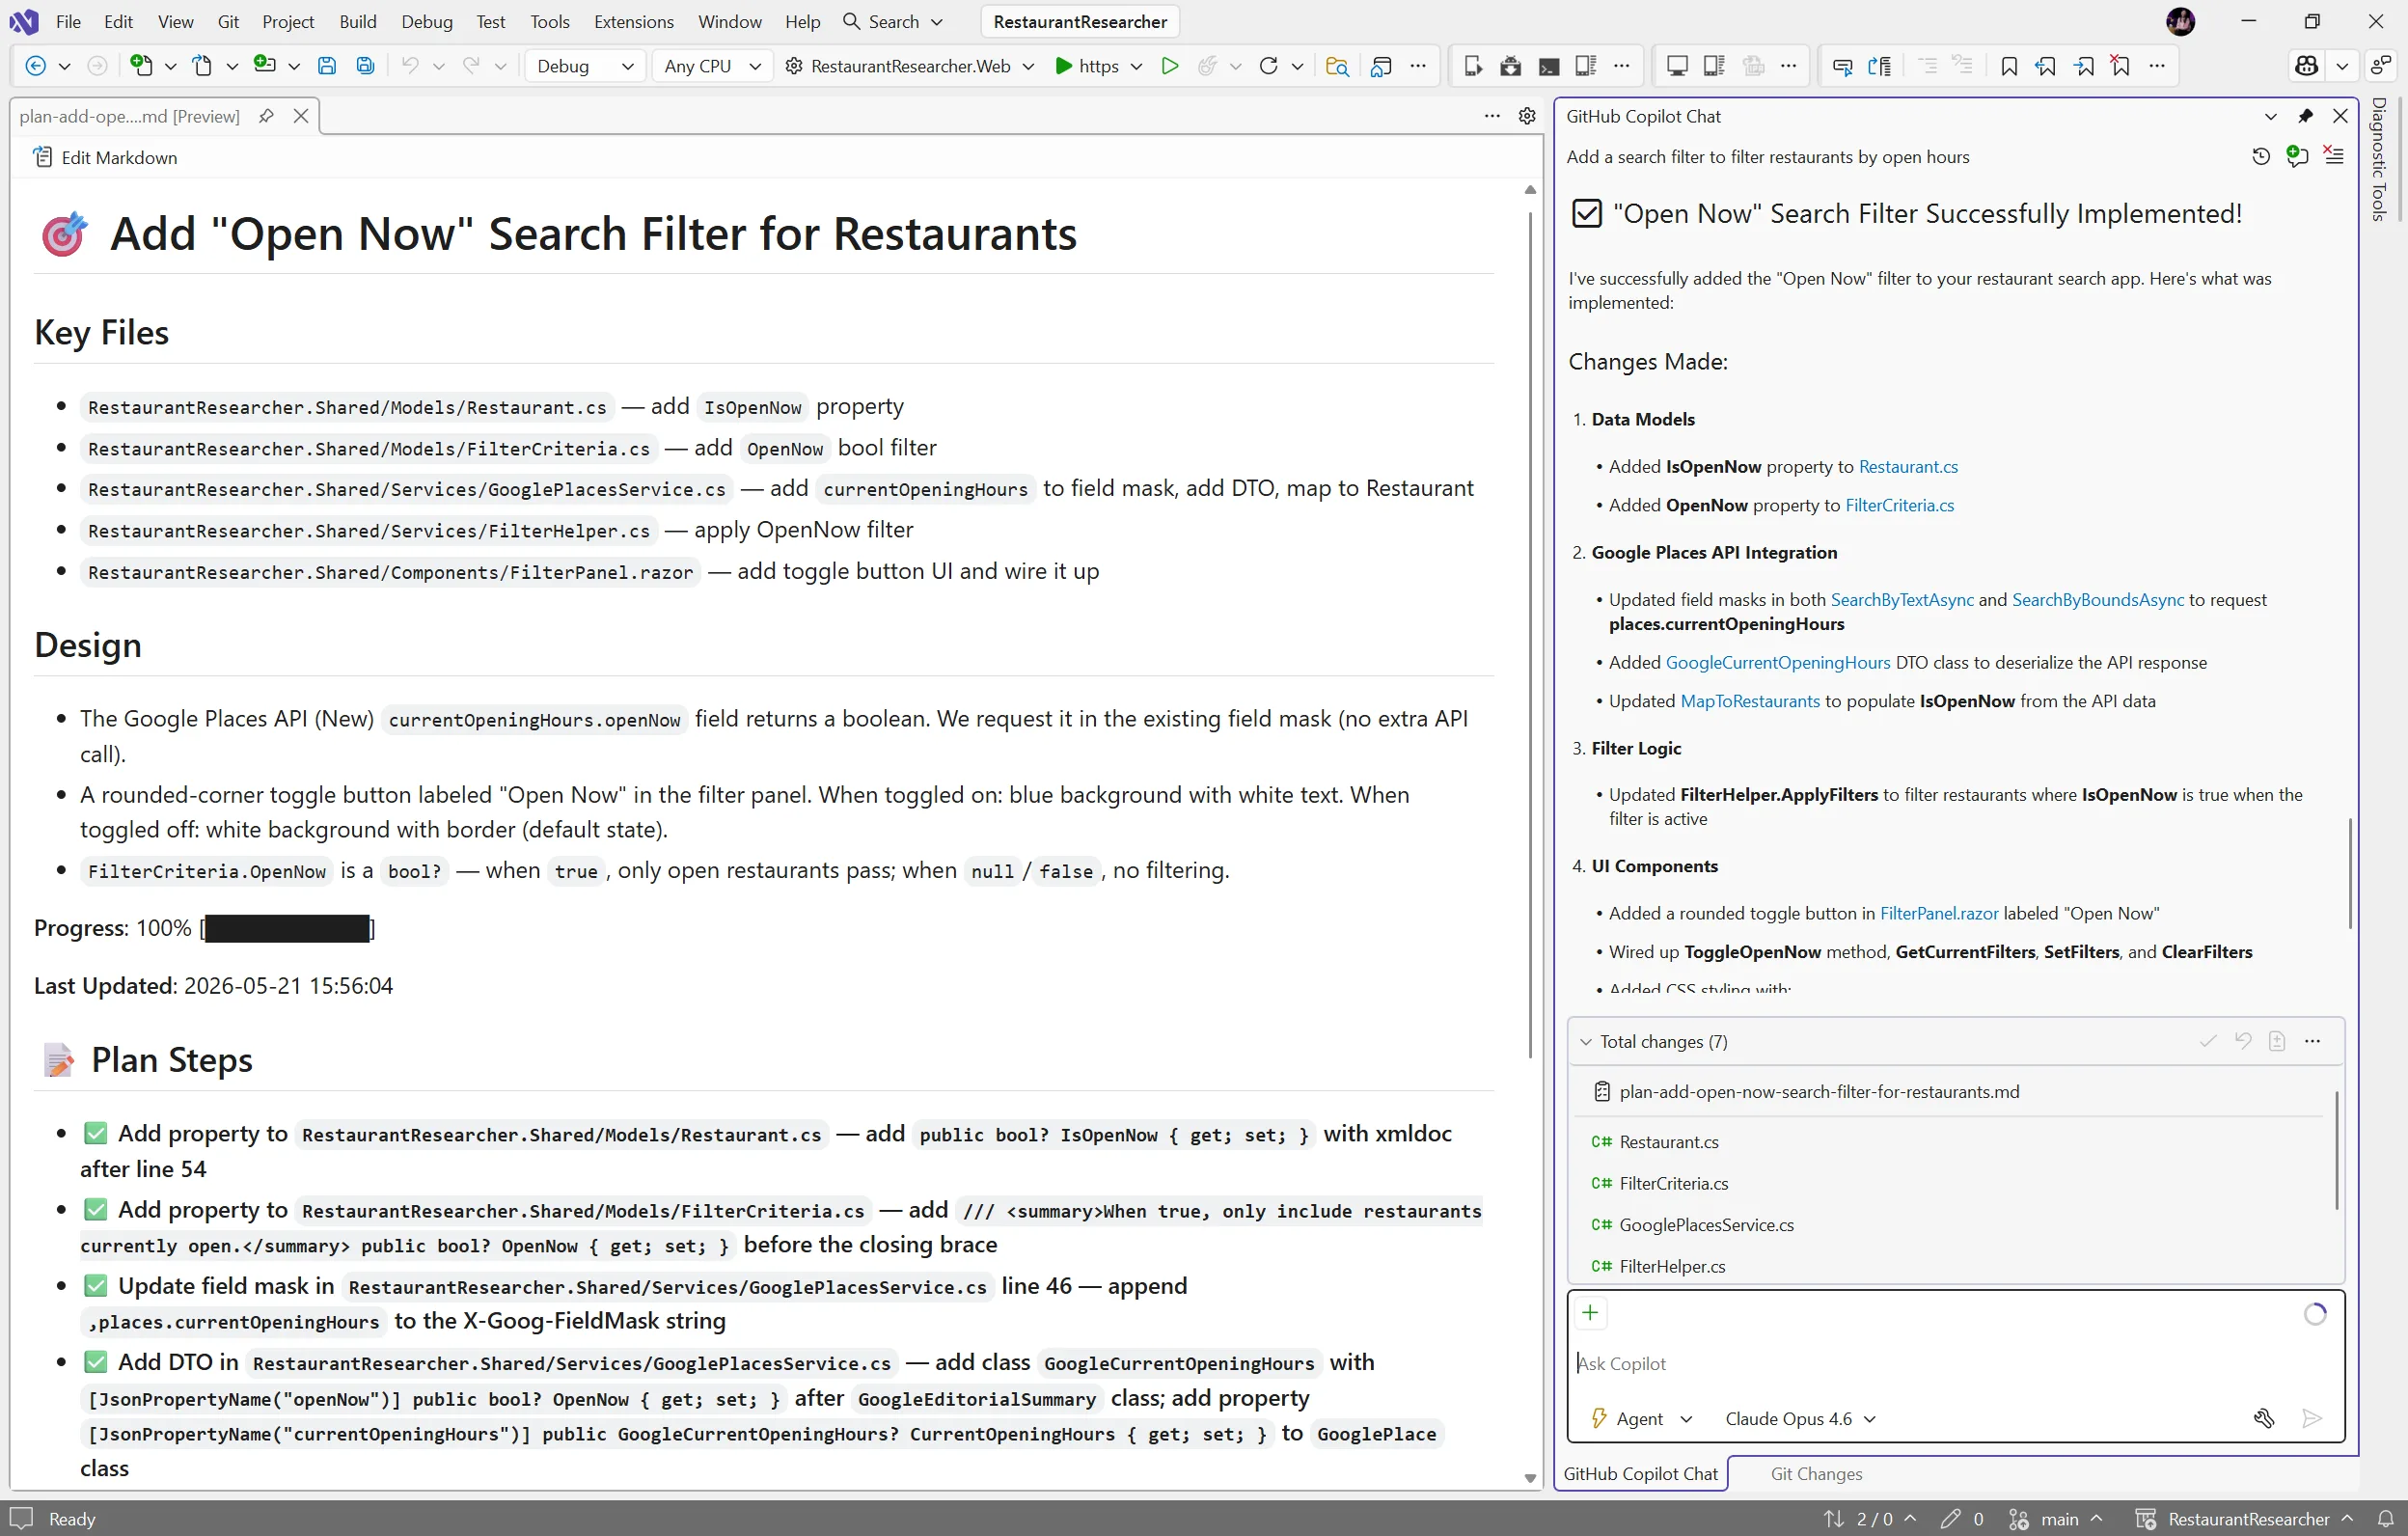
This summer, we are bringing new capabilities to GitHub Copilot modernization, the integrated agent experience built into Visual Studio that helps you upgrade your applications to the latest .NET stack.
You can migrate Web Forms applications to Blazor for a modern, component-based web stack. You can add Aspire to existing apps for cloud-ready observability and orchestration. The modernization agent assesses your project, builds a plan, and executes upgrades step by step, helping you improve performance and security without starting from scratch.
If you have been carrying a Web Forms app for years because the rewrite math never penciled out, this is worth a fresh look.
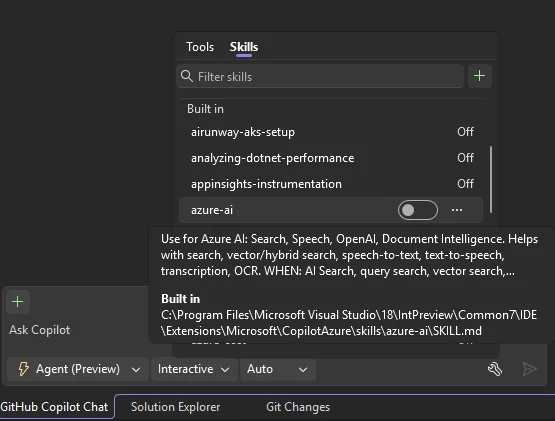
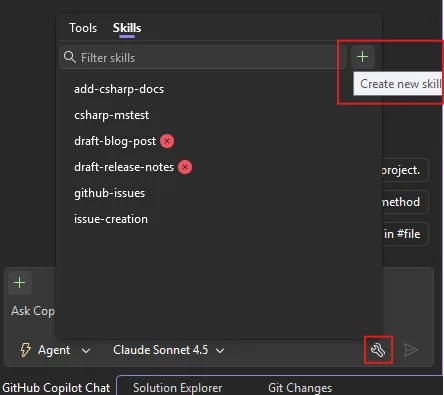
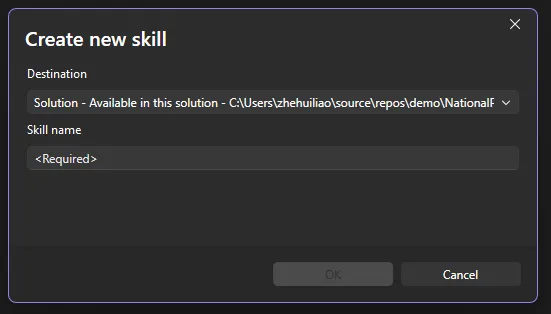
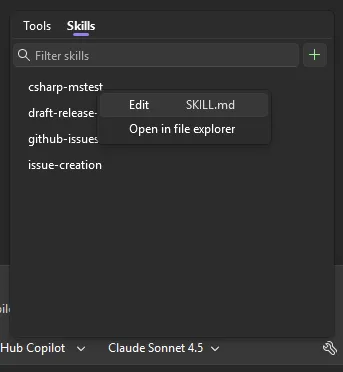
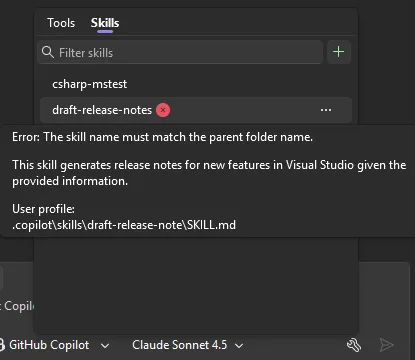
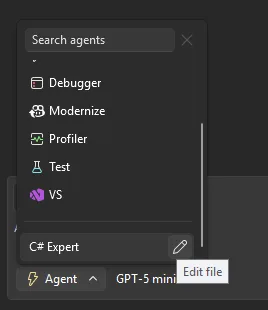
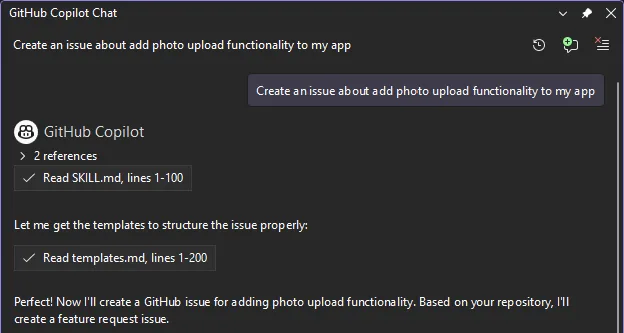
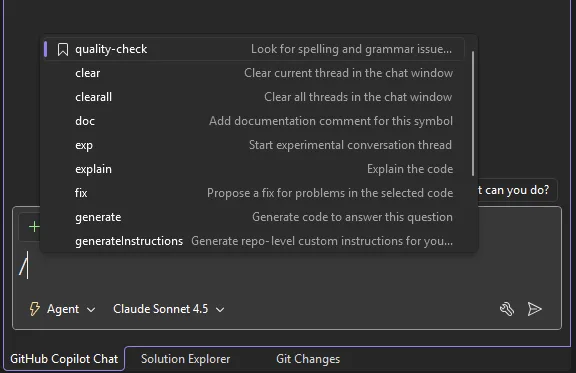
Skills that show up when you need them
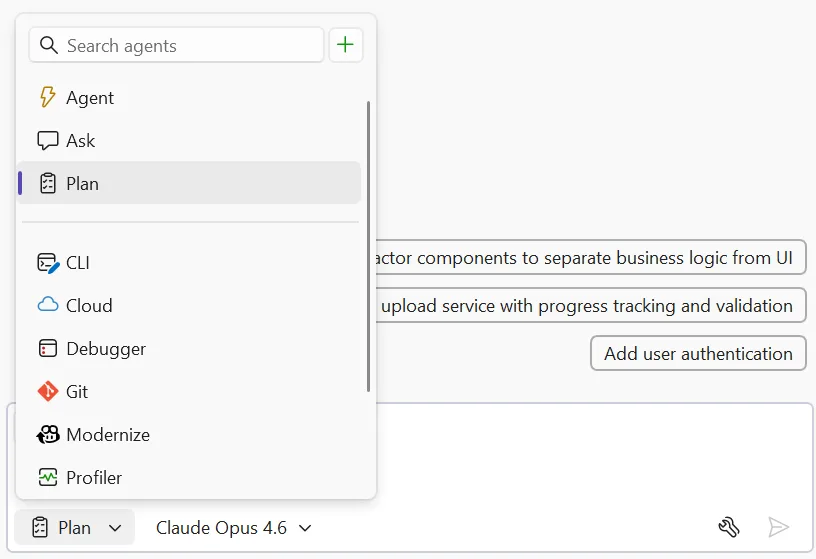
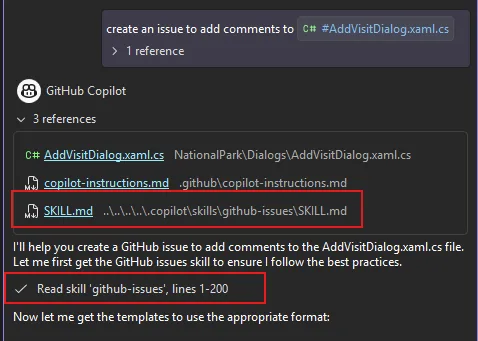
One of the harder problems with AI tooling is that the right capability often exists, but it shows up at the wrong moment, or you have to know to ask for it.
We are introducing Microsoft-authored skills that apply automatically based on your project type and the task at hand. Less prompting. Less guesswork. A more helpful experience overall. The right capabilities show up when you need them, without requiring you to already know they exist.
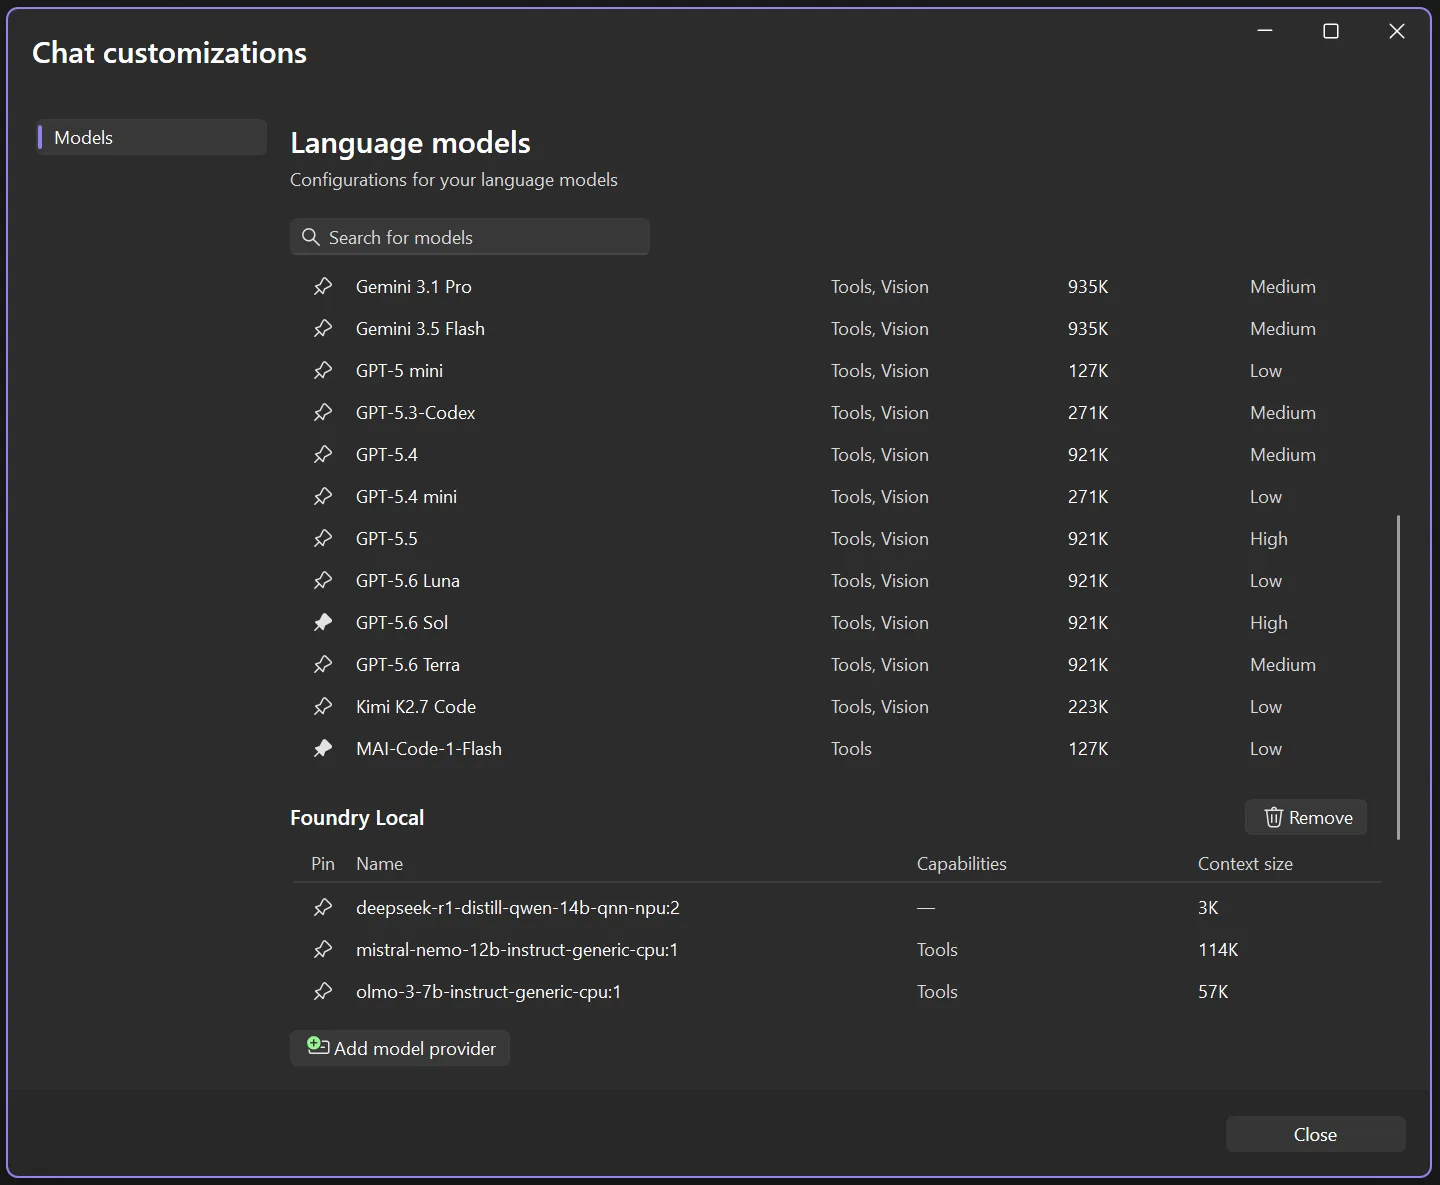
Bring your own key, bring your own model
This is the one I have been waiting to talk about.
Historically, AI integration in Visual Studio has been limited to a small set of sanctioned endpoints. That works for a lot of developers, but it has left real customers behind, including teams whose environments call for different choices.
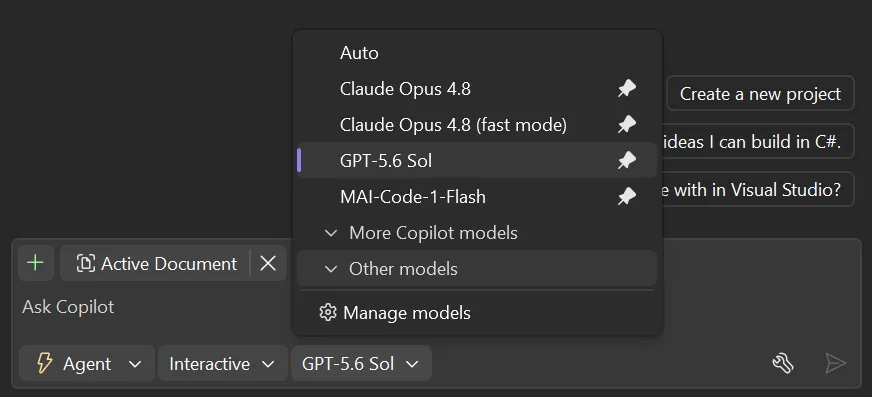
We are moving toward a BYOK approach, bring your own key or model, so you can use different AI models whether they run locally or in the cloud. That gives you more flexibility around performance, cost, and compliance based on the needs of your environment.
If you have been waiting for Visual Studio to meet your environment instead of asking your environment to bend, this is the announcement to watch.
Built on the GitHub Copilot SDK
Underneath all of this is a more unified foundation. Visual Studio is moving to the GitHub Copilot SDK as the foundation for its AI integration going forward.
This one sits below the surface. You will not see it in a menu. What it means in practice is that we can move faster, stay aligned with the broader ecosystem, and bring new capabilities into Visual Studio sooner. Worth knowing about, even though you will mostly feel it through everything else getting better.
Where this is heading
If there is one way to sum up this roadmap, it is this. We are focused on a set of meaningful improvements that remove friction from the inner loop and make day-to-day development feel better.
Code that compiles by default. Faster feedback before you build. Smarter handling of real-world pain points like merge conflicts. AI that works with your tools, not next to them. Flexibility in how you bring AI into your environment.
All of it is designed to fit how you already use Visual Studio, not force you into a different workflow.
Watch it live at Build this week
If you want to see this work in action, here are the sessions I would put on your schedule. All times in Pacific.
Microsoft Build opening keynote (KEY01) Tuesday, June 2, 9:30 AM to 12:00 PM PT Satya Nadella and Microsoft leaders open the week with how Microsoft is creating new opportunities for developers across our platforms in this era of AI. This is the one that sets the frame for everything else.
GitHub, Copilot, VS Code, and More: Live from San Francisco (LIVE104) Wednesday, June 3, 9:00 AM to 11:00 AM PT The closest thing Build has to a hallway conversation with the engineers shipping the work. Live demos, surprise guests, live coding, straight from the teams. Watch this one live if you can.
GitHub Copilot in Visual Studio: Agents That Debug, Profile, and Test (BRK207) Wednesday, June 3, 4:00 PM to 4:45 PM PT This is the demo-heavy session on the agents work above, with Mads Kristensen and Nik Karpinsky from the Visual Studio team. You will see agents root-cause bugs using live runtime behavior, pinpoint performance bottlenecks, and build test coverage to catch regressions before they ship. If you work in enterprise C#, .NET, or C++, this is the one.
Make GitHub Copilot Work Your Way: Custom Tools, Context and Workflows (LAB502D) Self-paced lab, opens Tuesday, June 2, at 12:00 PM PT Build custom Copilot agents from scratch, create reusable Agent Skills, and connect to external services via MCP. Works across VS Code, Visual Studio, CLI, and Copilot coding agent. Complete it on your own schedule.
The full Build schedule, including everything streaming online for free, is at build.microsoft.com.
If something we announced today changes how you think about your day-to-day in Visual Studio, I want to hear about it.


