What Is Medallion Architecture? Bronze, Silver & Gold Explained


Introduction: Why We Need a Layered Approach to Data

Quick Summary: What is medallion architecture?
Medallion architecture is a layered data engineering pattern that progressively transforms raw data into highly trusted, business‑ready assets. It leverages bronze, silver and gold layers (and sometimes pre‑bronze and platinum) to enable traceability, scalability and analytics at scale. This article explores its purpose, benefits and challenges, compares it with data mesh and data fabric, and explains how Clarifai’s AI platform can enhance medallion pipelines. We’ll also look at emerging trends like real‑time analytics and AI‑ready pipelines, providing actionable guidance for data teams.

Quick Digest

  • Medallion architecture organises data into layers—bronze (raw), silver (cleaned), gold (business‑ready)—to improve quality and governance.
  • The bronze layer ingests raw data with minimal transformation, capturing duplicates and metadata.
  • The silver layer cleans, deduplicates and standardises data using modeling techniques like Data Vault; it ensures data quality with schema enforcement and DataOps practices.
  • The gold layer aggregates and enriches data into dimensional models for analytics and machine learning.
  • An optional platinum layer enables real‑time analytics and advanced AI models.
  • Medallion architecture complements data mesh and data fabric; hybrid approaches can balance domain ownership and layered quality.
  • Challenges include complexity, potential duplication and latency; real‑time use cases may need additional architectures.
  • Clarifai’s compute orchestration and local runners can support AI models across medallion layers, reducing compute costs by up to 90% and enabling offline development.

What Is Medallion Architecture?

Medallion architecture is a data engineering pattern that divides your data lake or lakehouse into distinct layers. Originally popularised by Databricks and other modern data platforms, it allows teams to incrementally improve data quality as it moves from raw ingestion to analytics. The naming is inspired by Olympic medals—bronze, silver and gold—to symbolise progressively increasing value and trust. Some modern implementations introduce a pre‑bronze staging layer for high‑velocity ingestion and a platinum layer for advanced analytics and real‑time AI.

The architecture’s design is motivated by several core needs:

  • Trust and Quality. Raw data often contains errors, missing values and inconsistent formats. By moving through layers of cleansing, standardisation and enrichment, the data becomes more reliable and ready for consumption.
  • Modularity and Traceability. Layered pipelines isolate tasks and make it easier to trace lineage from input to output. This modularity also helps teams manage complex transformations, roll back errors and maintain governance.
  • Scalability and Reproducibility. Each layer can be engineered for parallel processing and automated with orchestration tools. Research shows that medallion architecture reduces redundancy and enhances reproducibility in AI pipelines.
  • Compliance and Auditability. Storing raw data in bronze preserves full fidelity for auditing; subsequent layers maintain metadata and lineage needed for regulatory compliance—crucial in healthcare, finance and other highly regulated industries.

Beyond these benefits, medallion architecture aligns with MLOps principles: it allows data scientists, ML engineers and business analysts to collaborate on a shared pipeline. In the next sections, we explore each layer in depth.

Bronze Layer – Raw Data Ingestion

The bronze layer is the foundation of the medallion architecture. It collects and stores data from a variety of sources—transactional systems, sensors, logs, CRM platforms, social media and more. Importantly, the bronze layer applies minimal transformation, preserving the raw state of the data for two reasons: fidelity and future reprocessing.

Key Functions

  1. Ingestion from Multiple Sources. Data engineers use tools like Azure Data Factory, AWS Glue, Kafka or Delta Live Tables to ingest data in real time or batch. Sources range from structured relational data to semi‑structured logs and fully unstructured files.
  2. Schema Inference and Metadata Capture. While the bronze layer doesn’t enforce a strict schema, it should record metadata about the data—source, timestamp, ingestion method—to support lineage tracking and replay.
  3. Change Data Capture (CDC). Modern platforms enable CDC to capture incremental changes from source systems. This reduces ingestion load and speeds up downstream processing.
  4. Pre‑Bronze Staging (Optional). For high‑velocity IoT or streaming data, some architectures introduce a pre‑bronze stage that temporarily stores raw events before normalizing. This stage addresses extreme throughput scenarios like clickstream analytics or sensor telemetry.

Expert Insights

  • Data engineers emphasise that the bronze layer should capture duplicates and retain context because downstream layers may need to reconcile or revisit historical records.
  • Research indicates that the bronze layer’s flexible schema supports versioning and evolution of data models, which is essential for long‑lived analytical applications.
  • A case study in healthcare shows that having a complete raw record allowed investigators to re‑examine outliers in clinical trial data; without such a layer, the anomalies would have been lost, compromising patient safety.

Creative Example

Imagine a genomics company collecting raw sequence data from lab instruments. The bronze layer stores each file exactly as it appears—fastq sequences, metadata tags, instrument logs—without filtering anything out. The team then uses this data later to reconstruct experiments if a problem arises.

Silver Layer – Cleansing & Transformation

Once raw data resides in bronze, the silver layer performs data cleansing, integration and standardisation. Its goal is to transform messy data into a unified and trustworthy dataset suitable for business consumption and machine learning.

Core Responsibilities

  1. Data Cleaning. Remove duplicates, fix missing values and enforce data types. Tools like dbt, Spark and SQL scripts apply rules based on data contracts.
  2. Integration and Harmonization. Join data from multiple bronze sources, align on common keys and derive canonical forms. Many organisations implement Data Vault modeling here, which stores historical changes in hubs, links and satellites.
  3. Quality Gates and Expectations. Use frameworks like Pandera or Great Expectations to define expectations for each column (e.g., uniqueness, range checks, anomaly detection). Data contracts encode these rules and alert stakeholders when violations occur.
  4. Schema Enforcement and ACID Transactions. Platforms like Delta Lake provide ACID guarantees, enabling safe concurrent writes and reads while ensuring that each transaction is atomic and consistent.
  5. Change Data Processing. Implement incremental updates using CDC logs or streaming; avoid full reloads to speed up transformations and reduce cost.
  6. Historisation. For slowly changing dimensions (like product attributes or patient demographics), maintain history in satellites so that analytics can reproduce states as of a specific date.

Expert Insights

  • A research paper introduces hub‑star modeling for the silver layer, combining hubs and star schema design to simplify modeling and support large‑scale analytics.
  • Data quality experts argue that data contracts and validation frameworks are key to preventing downstream errors; missing quality controls can lead to misinformed decisions and financial losses.
  • In a biotech scenario, silver layer transformations unify patient records from multiple hospitals into a FHIR‑compatible format. This ensures interoperability and enables AI models to train on standardised patient data.
  • The IJSRP case study claims that implementing medallion architecture with Delta Lake and CDC reduced ETL latency by 70% and cut costs by 60%.

Creative Example

Consider a retail company with data from online orders, physical stores and call centers. The silver layer merges these sources, ensures that “Customer ID” refers to the same person across systems, removes duplicates and fills missing addresses. It then standardises data types so that analytics queries can join on consistent keys.

Gold Layer – Business‑Ready & Analytical

The gold layer is where data becomes business ready. It delivers curated, high‑value datasets to analysts, data scientists and end‑user applications.

What Happens in the Gold Layer?

  1. Dimensional Modeling. Transform data into star or snowflake schemas, with fact tables capturing transactions and dimension tables storing attributes. This structure improves query performance and readability.
  2. Aggregations and Summaries. Calculate metrics and key performance indicators (KPIs) like sales by region, average patient length of stay or gene expression statistics.
  3. Data Products. Create domain‑specific data marts or semantic layers that business users can consume via dashboards, BI tools or machine‑learning notebooks. The gold layer often underpins Power BI, Tableau or Looker models.
  4. Machine‑Learning Ready Data. Provide clean, feature‑rich datasets for training ML models. For example, in biotech, aggregated gene expression data may feed into AI algorithms for drug discovery.

Expert Insights

  • Studies show that the gold layer drastically reduces time to insight and increases trust in data. Financial institutions report improved governance and faster analytics after adopting medallion architecture.
  • However, some experts warn that repeated transformations across layers can lead to latency and cost overhead, especially when data volumes are high.
  • A healthcare case study found that a well‑designed gold layer reduced data analysis time from days to hours, enabling rapid clinical trial analyses and improved patient outcomes.
  • Another study reports that the gold layer supports advanced AI tasks like predicting patient readmissions or fraud detection due to its consistent and curated format.

Creative Example

Imagine an investment bank tracking transactions across thousands of accounts. The gold layer aggregates data into a customer 360° view, summarising assets, liabilities and trading activity. This enables risk analysts to detect anomalies quickly and regulators to audit the bank’s compliance. Machine‑learning models also feed on this gold data to predict credit risk.

Platinum Layer & Real‑Time Analytics

As data teams push the boundaries of analytics, many organisations introduce an optional platinum layer. While medallion architecture is historically a three‑tier model, modern demands (e.g., high‑frequency trading, autonomous vehicles, IoT) require low‑latency access to curated data. The platinum layer is where real‑time intelligence emerges.

What Is the Platinum Layer?

  1. Real‑Time Analytics. It combines streaming data from sensors or events with the curated context from bronze, silver and gold. For instance, a financial trading system might merge streaming quotes with gold‑layer portfolio data to compute real‑time risk metrics.
  2. Advanced Transformations. The platinum layer may host predictive models, cross‑domain aggregations and AI applications that require rapid feedback loops.
  3. Multiple Entry Points. Data may flow directly from bronze, silver or gold into the platinum layer depending on the use case, enabling flexible pipelines.

Debates on the Platinum Layer

  • Proponents argue that real‑time analytics can’t wait for batch‑oriented silver or gold refreshes. The platinum layer provides an action layer where streaming meets context, enabling operational decisions like fraud detection or industrial automation.
  • Critics caution that adding another layer duplicates data, increases complexity and may create silos. They recommend using event‑driven architectures or micro‑layers instead.
  • Some experts note that pre‑bronze staging combined with the platinum layer provides a balanced approach: high‑velocity data is buffered before normalisation, then integrated for real‑time analytics.

Creative Example

A logistics company uses sensors to track truck locations every second. The platinum layer merges these streams with gold‑layer delivery schedules to detect delays in real time and automatically reroute shipments. Predictive algorithms then anticipate traffic patterns and optimize fuel usage, reducing emissions and saving costs.

Medallion vs. Data Mesh vs. Data Fabric

As the data ecosystem evolves, alternative architectural patterns have emerged. To choose the right approach, it’s important to compare medallion architecture with data mesh and data fabric.

Data Mesh

Data mesh is a decentralised, domain‑oriented approach. Instead of a central data platform, each domain (e.g., marketing, finance, operations) owns its data products and exposes them via well‑defined interfaces. Governance is federated, and teams manage their own pipelines and quality controls.

  • Strengths: Promotes domain ownership, scalability and agility. Encourages cross‑functional collaboration and reduces central bottlenecks.
  • Weaknesses: Requires a mature organisation with clear roles; can lead to inconsistent quality if governance is weak.

Data Fabric

Data fabric is an integration paradigm that connects disparate data sources (databases, SaaS applications, cloud storages) through a unified access layer. It uses metadata management, semantic models and automation to deliver data across environments without physically moving it.

  • Strengths: Simplifies integration, accelerates time to insight, and supports multi‑cloud/hybrid architectures. Ideal for organisations dealing with complex data landscapes.
  • Weaknesses: May not provide the same level of incremental quality improvement as medallion layers; requires investment in metadata and integration technology.

Medallion Architecture

  • Strengths: Provides structured approach to progressively improve quality, ensuring trust and traceability. Works well within a lakehouse or data lake environment and can integrate with both data mesh and data fabric.
  • Weaknesses: Can be complex and sometimes slower for real‑time use cases; may duplicate data across layers and require careful cost management.

When to Use Each

Use Case

Recommended Pattern

Centralised analytics requiring trust and governance

Medallion Architecture

Large organisation with multiple domain teams and autonomy

Data Mesh

Real‑time integration across heterogeneous systems

Data Fabric

Hybrid scenario with domain ownership and layered quality

Federated Medallion + Data Mesh

Some practitioners combine these approaches. For example, each domain implements its own medallion layers (bronze, silver, gold), while a data fabric connects them across the organisation, and a federated governance model ensures consistency. Microsoft Fabric’s OneLake service exemplifies this synergy: it leverages medallion layers within domains and uses central governance to connect them.

Implementing Medallion Architecture in Modern Platforms

Implementing medallion architecture is more than a conceptual exercise—it requires careful selection of platforms, tools and processes. Below we outline a typical implementation, using Databricks and Microsoft Fabric as examples.

Step 1: Set Up a Lakehouse Environment

Choose a platform that supports ACID transactions, schema enforcement and time travel. Databricks with Delta Lake is a popular choice; Microsoft Fabric offers OneLake and Lakehouses with similar capabilities; Snowflake provides dynamic tables and Streams/Tasks for continuous ingestion.

Step 2: Design the Medallion Layers

  • Define data models for bronze, silver and gold. Use data engineering best practices like contracts before code, modularization and replay/chaos engineering to increase resilience.
  • Decide whether to include pre‑bronze or platinum layers based on streaming needs.

Step 3: Ingest Data into Bronze

Use ingestion tools (Data Factory, Glue, Kafka) to load raw data. Change Data Capture is recommended to minimize reprocessing costs and support incremental updates.

Step 4: Transform Data in Silver

  • Use dbt, Spark or Delta Live Tables to clean and integrate data.
  • Implement Data Vault modeling or hub‑star modeling for historisation.
  • Apply quality gates and expectations with frameworks like Pandera.

Step 5: Aggregate and Model Data in Gold

  • Build star schemas and aggregated tables for consumption.
  • Create data products accessible via Power BI or your preferred BI tool.
  • Provide feature stores for machine learning.

Step 6: Orchestrate and Monitor

  • Use orchestration tools such as Azure Data Factory, Airflow, Databricks Workflows or Microsoft Fabric pipelines to schedule and monitor jobs.
  • Implement observability, lineage and cost monitoring to track pipeline health.

Step 7: Consume Data & Enable AI

  • Feed gold or platinum data into ML models, dashboards or applications.
  • Integrate with MLOps platforms like Clarifai to orchestrate AI models across your compute environments.
  • Use local runners or serverless compute to deploy AI inference within the platform.

Case Studies & Research

  • An industry report found that adopting medallion architecture on Microsoft Fabric reduced report development time by 60% and increased data ownership within domains.
  • A research review concluded that containerisation and low‑code orchestration reduced deployment time by 30%, demonstrating that tools like dbt and Delta Live Tables accelerate adoption.
  • Snowflake’s Streams and Tasks make implementing bronze→silver→gold pipelines easier; dynamic tables allow near real‑time data flows with minimal overhead.

Data Quality & Governance Across Layers

Data quality is the backbone of medallion architecture. Without strong governance and validation, layering only propagates bad data downstream.

Key Concepts

  1. Data Contracts. Formal agreements between data producers and consumers specify schema, acceptable ranges, units and update frequency. Breaking contracts triggers alerts and stops pipeline execution.
  2. Quality Gates & Expectations. Tools like Pandera assert constraints (e.g., age > 0, not null, unique id) at each layer. Failures are logged and triaged.
  3. Metadata Management & Lineage. Capture data lineage from source to gold layer, including transformations and business logic. Metadata catalogs (e.g., Azure Purview, Databricks Unity Catalog) enable discovery and compliance.
  4. DataOps & Continuous Improvement. Borrowing from DevOps, DataOps emphasises version control, CI/CD pipelines for data and micro‑releases. It encourages continuous improvement of data quality and automates testing, deployment and rollback.

Expert Insights

  • Research indicates that robust metadata management and lineage support audit readiness and schema versioning. This is vital in regulated industries where regulators might ask for a reconstruction of past states.
  • Combining Data Vault modeling with medallion architecture enhances provenance and reproducibility.
  • Data quality frameworks must also handle privacy and PII. Ensure PII is masked or encrypted at the bronze layer and carefully propagated to downstream layers.

Creative Example

A pharmaceutical company uses medallion architecture for clinical trial data. In the silver layer, they merge patient records, apply quality checks and remove duplicates. At each transformation, metadata logs note the transformation rules. Later, when regulators audit the trial, the company can reconstruct exactly how each aggregated metric was derived, demonstrating compliance.

Challenges & Limitations of Medallion Architecture

Like any architectural pattern, medallion architecture has trade‑offs.

Complexity & Engineering Effort

  • Waterfall Delays. Critics argue that medallion architecture encourages batch processing and sequential handoffs, leading to waterfall delays. Real‑time use cases may suffer because each layer adds latency.
  • Heavy Transformations. The silver layer often requires significant engineering to deduplicate, standardise and integrate data. This demands skilled engineers and may slow iteration.
  • Duplication & Storage Costs. Each layer stores its own copy of the data. For massive datasets, this duplication can become expensive.
  • Risk of Stale Data. If gold layers are refreshed infrequently, insights may be outdated.
  • Platinum Layer Controversy. Some argue that introducing a platinum layer adds complexity and creates silos, increasing cost and decreasing collaboration.

When Medallion Might Not Fit

  • Real‑Time & Event‑Driven Use Cases. Streaming architectures like Lambda or Kappa patterns may be better suited.
  • Small, Agile Teams. For small companies with limited engineering bandwidth, medallion architecture might be overkill. Simpler pipelines or data mesh can suffice.
  • Domain‑Focused Organisations. Data mesh emphasises domain ownership and may better align with cross‑functional teams.

Mitigation Strategies

  • Automate & Orchestrate. Use low‑code tools, dynamic tables and workflows to reduce manual overhead and refresh frequency.
  • Hybrid Architectures. Combine medallion with streaming frameworks or domain‑driven patterns to achieve both quality and agility.
  • Cost Management. Use object storage with compression and choose long‑term retention policies to manage duplication costs.
  • Training & Documentation. Invest in training engineers and documenting pipelines to avoid misconfiguration and reduce errors.

Emerging Trends – AI‑Ready Pipelines & Generative AI

The data landscape is evolving rapidly, with AI‑first organisations demanding pipelines that are not just analytics ready but AI ready. Here are key trends impacting medallion architecture.

Generative AI & Synthetic Data

Generative AI models like GPT and Diffusion require high‑quality data to learn patterns. Medallion architecture provides a structured pipeline to deliver such data. However, generative models also produce synthetic data which can be fed back into the pipeline, creating a loop. Data teams must ensure that synthetic data is labelled and validated.

A notable example is the AI‑designed drug rentosertib, which improved lung function by about 98 mL in interstitial pulmonary fibrosis patients during phase 2a trials. This shows the potential for AI models to accelerate drug discovery, but they rely on meticulously curated training data—a job for the medallion pipeline.

Compute Sustainability & Efficiency

The compute demands of AI are skyrocketing. According to a report, meeting AI compute demand could require 200 GW of new power and $2.8 trillion in infrastructure investments by 2030. Data pipelines must therefore be cost‑ and energy‑efficient.

Clarifai’s compute orchestration addresses this by enabling dynamic autoscaling, GPU fractioning and vendor‑agnostic deployments. The platform reduces compute costs by up to 90% and increases utilization 3.7×.

Federated & Hybrid Architectures

Multi‑cloud and hybrid deployments are becoming the norm. Medallion pipelines must accommodate data sovereignty, cross‑region replication and regional compliance. Combining data mesh with medallion layers ensures that each domain can manage its own pipeline while still benefiting from central governance.

Privacy & Security by Design

With stricter regulations (GDPR, HIPAA), data architectures must embed privacy features. Medallion architecture facilitates privacy by isolating raw data with restricted access (bronze) and propagating only necessary fields to downstream layers.

Domain‑Driven & Model‑Driven Design

Modern design trends encourage aligning data modeling with domain contexts (data mesh) and using model‑driven design (Data Vault, hub‑star) to bridge raw and curated data. These concepts are gaining traction in 2025.

Clarifai’s Role in Medallion Architecture & AI Pipelines

Clarifai is a market leader in AI and provides a comprehensive platform for building, deploying and orchestrating AI models. Its products align closely with medallion architecture and AI‑ready pipelines.

Compute Orchestration

Clarifai’s compute orchestration allows users to deploy any AI model on any compute environment—cloud, on‑premises, edge or multi‑site. This is particularly valuable for medallion pipelines because each layer may require different compute resources. Key features include:

  • Vendor‑Agnostic Deployments. Models can run on NVIDIA, Intel or AMD GPUs and across AWS, Azure or GCP clouds.
  • Dynamic Autoscaling & GPU Fractioning. The platform automatically scales compute resources up or down based on workload, reducing cost and energy consumption; GPU fractioning allows multiple models to share a GPU.
  • Serverless & On‑Prem Options. Users can run compute as a fully managed service (shared SaaS), as a dedicated VPC, or self‑managed. This flexibility suits companies with strict security or compliance needs.
  • Cost Efficiency. By optimising resource usage, Clarifai reduces compute costs by up to 90% and increases throughput, handling over 1.6 million requests per second.

Local Runners

Clarifai’s local runners enable developers to run models on local or on‑premise hardware while still benefiting from Clarifai’s API and compute plane. This is particularly useful in medallion pipelines for bronze and silver layers, where sensitive data may need to remain on‑premise due to regulatory requirements.

  • Development Flexibility. Engineers can test models on local data, iterate quickly and push to production once validated.
  • Edge & Air‑Gapped Environments. Local runners support running inference in air‑gapped networks or at the edge, making them suitable for remote facilities or regulated industries.
  • Integration with Medallion Layers. Models can ingest raw data from bronze, transform features in silver and output predictions to gold. The local runner ensures that compute is close to data, reducing latency.

Reasoning Engine & Generative AI

Clarifai’s reasoning engine powers generative AI tasks with high efficiency—544 tokens/sec and costs as low as $0.16 per million tokens. For organisations adopting medallion architecture, this means they can embed generative AI models into the platinum layer or gold layer for real‑time summarisation, Q&A or content generation.

How Clarifai Fits into Medallion Pipelines

  1. Bronze Layer: Use Clarifai’s local runners to preprocess raw images or video streams (e.g., classify samples, detect anomalies) before storing them in the bronze layer.
  2. Silver Layer: Deploy compute orchestration to run data cleansing models (e.g., OCR extraction, de‑duplication) across distributed compute resources while maintaining data governance.
  3. Gold & Platinum Layers: Use Clarifai’s reasoning engine and high‑throughput inference to generate insights from curated data—predict patient risk, summarise documents or generate synthetic data for training.
  4. Monitoring & Optimization: Clarifai’s platform includes dashboards to monitor model performance, compute usage and costs, aligning with the medallion principle of continuous improvement.

Through these integrations, Clarifai extends the medallion architecture into a full‑stack AI environment. It offers the flexibility and cost efficiency required to scale AI across industries while staying compliant and secure.

Conclusion & Actionable Takeaways

Medallion architecture has emerged as a powerful framework for building trustworthy, scalable and AI‑ready data pipelines. By progressively transforming data from raw to business‑ready states, it addresses quality, governance and analytics requirements in a structured way. However, it also introduces complexity and may not suit every scenario.

Key Takeaways:

  • Medallion architecture divides the data journey into bronze, silver and gold layers to incrementally improve quality. An optional platinum layer supports real‑time analytics and AI.
  • Each layer has distinct roles—raw ingestion, cleansing, enrichment and analytics—and benefits from tools like Delta Lake, Data Vault modeling and quality gates.
  • The architecture must be customised to organisational needs; it can be complemented by data mesh or data fabric to support domain ownership and real‑time integration.
  • Challenges include complexity, data duplication and latency, but automation, orchestration and hybrid patterns mitigate these issues.
  • Emerging trends like generative AI and compute sustainability drive the need for AI‑ready pipelines and efficient compute orchestration.

Next Steps:

  1. Assess Your Needs. Determine whether your organisation requires a layered approach or a domain‑driven model. A hybrid solution may work best.
  2. Start Small & Scale. Begin with a bronze and silver layer to address basic quality issues. Gradually implement gold and optional platinum as your team matures.
  3. Adopt DataOps Practices. Implement data contracts, quality gates and version control to ensure reliability.
  4. Integrate AI. Use platforms like Clarifai to orchestrate AI models across layers. Leverage compute orchestration for cost efficiency and local runners for secure development.
  5. Plan for the Future. Stay informed about trends in generative AI, data mesh and hybrid architectures; continuously evolve your pipeline to meet new demands.

By following these steps and leveraging the strengths of medallion architecture, data teams can build a robust foundation for analytics and AI. With Clarifai’s technology, they can further accelerate AI deployment, manage compute costs and innovate responsibly. As data continues to grow in volume and complexity, this combination of structured architecture and adaptive AI will be essential for organisations seeking to remain competitive.

Frequently Asked Questions

Q: What’s the difference between a bronze layer and a pre‑bronze layer?
A: The bronze layer stores raw data with minimal transformations, while a pre‑bronze layer (optional) is a transient staging area for extremely high‑velocity data (e.g., IoT streams). Pre‑bronze buffers events before normalising and writing them into bronze.

Q: Do I always need a gold layer?
A: Not necessarily. Small teams or early‑stage projects may choose to stop at silver and build analytics on cleansed data. A gold layer becomes essential when you need curated, performance‑optimized datasets for BI or machine learning.

Q: Is medallion architecture compatible with data mesh?
A: Yes. You can implement a federated medallion architecture where each domain manages its own bronze, silver and gold layers while a central governance framework ensures consistency.

Q: How does Clarifai integrate with medallion architecture?
A: Clarifai’s compute orchestration can run AI models across different layers and infrastructure, reducing costs and complexity. Local runners allow offline development and secure deployments. The reasoning engine offers efficient generative AI capabilities.

Q: What are the alternatives to medallion architecture?
A: Alternatives include data mesh (domain‑driven ownership) and data fabric (integrated data access layer). Real‑time streaming architectures like Kappa and Lambda may be better for event‑driven scenarios. Each has trade‑offs; you may need a hybrid approach.

By understanding the medallion architecture and its nuances—and by leveraging AI platforms like Clarifai—you can build resilient, efficient data pipelines that power next‑generation analytics and AI.


Performance Metrics in Machine Learning: Accuracy, Fairness & Drift


Machine‑learning systems have moved far beyond academic labs and into mission‑critical applications like medical diagnostics, credit decisions, content moderation, and generative search. These models power decision‑making processes, generate text and images, and react to dynamic environments; however, they are only as trustworthy as their performance. Selecting the right performance metrics is fundamental to building reliable and equitable AI. Metrics tell us whether a model is doing its job, where it might be biased, and when it needs to be retrained. In this guide we go deep into the world of ML performance metrics, covering core concepts, advanced measures, fairness, interpretability and even green AI considerations. Wherever relevant, we will highlight how Clarifai’s platform helps practitioners monitor, evaluate and improve models.

Quick summary

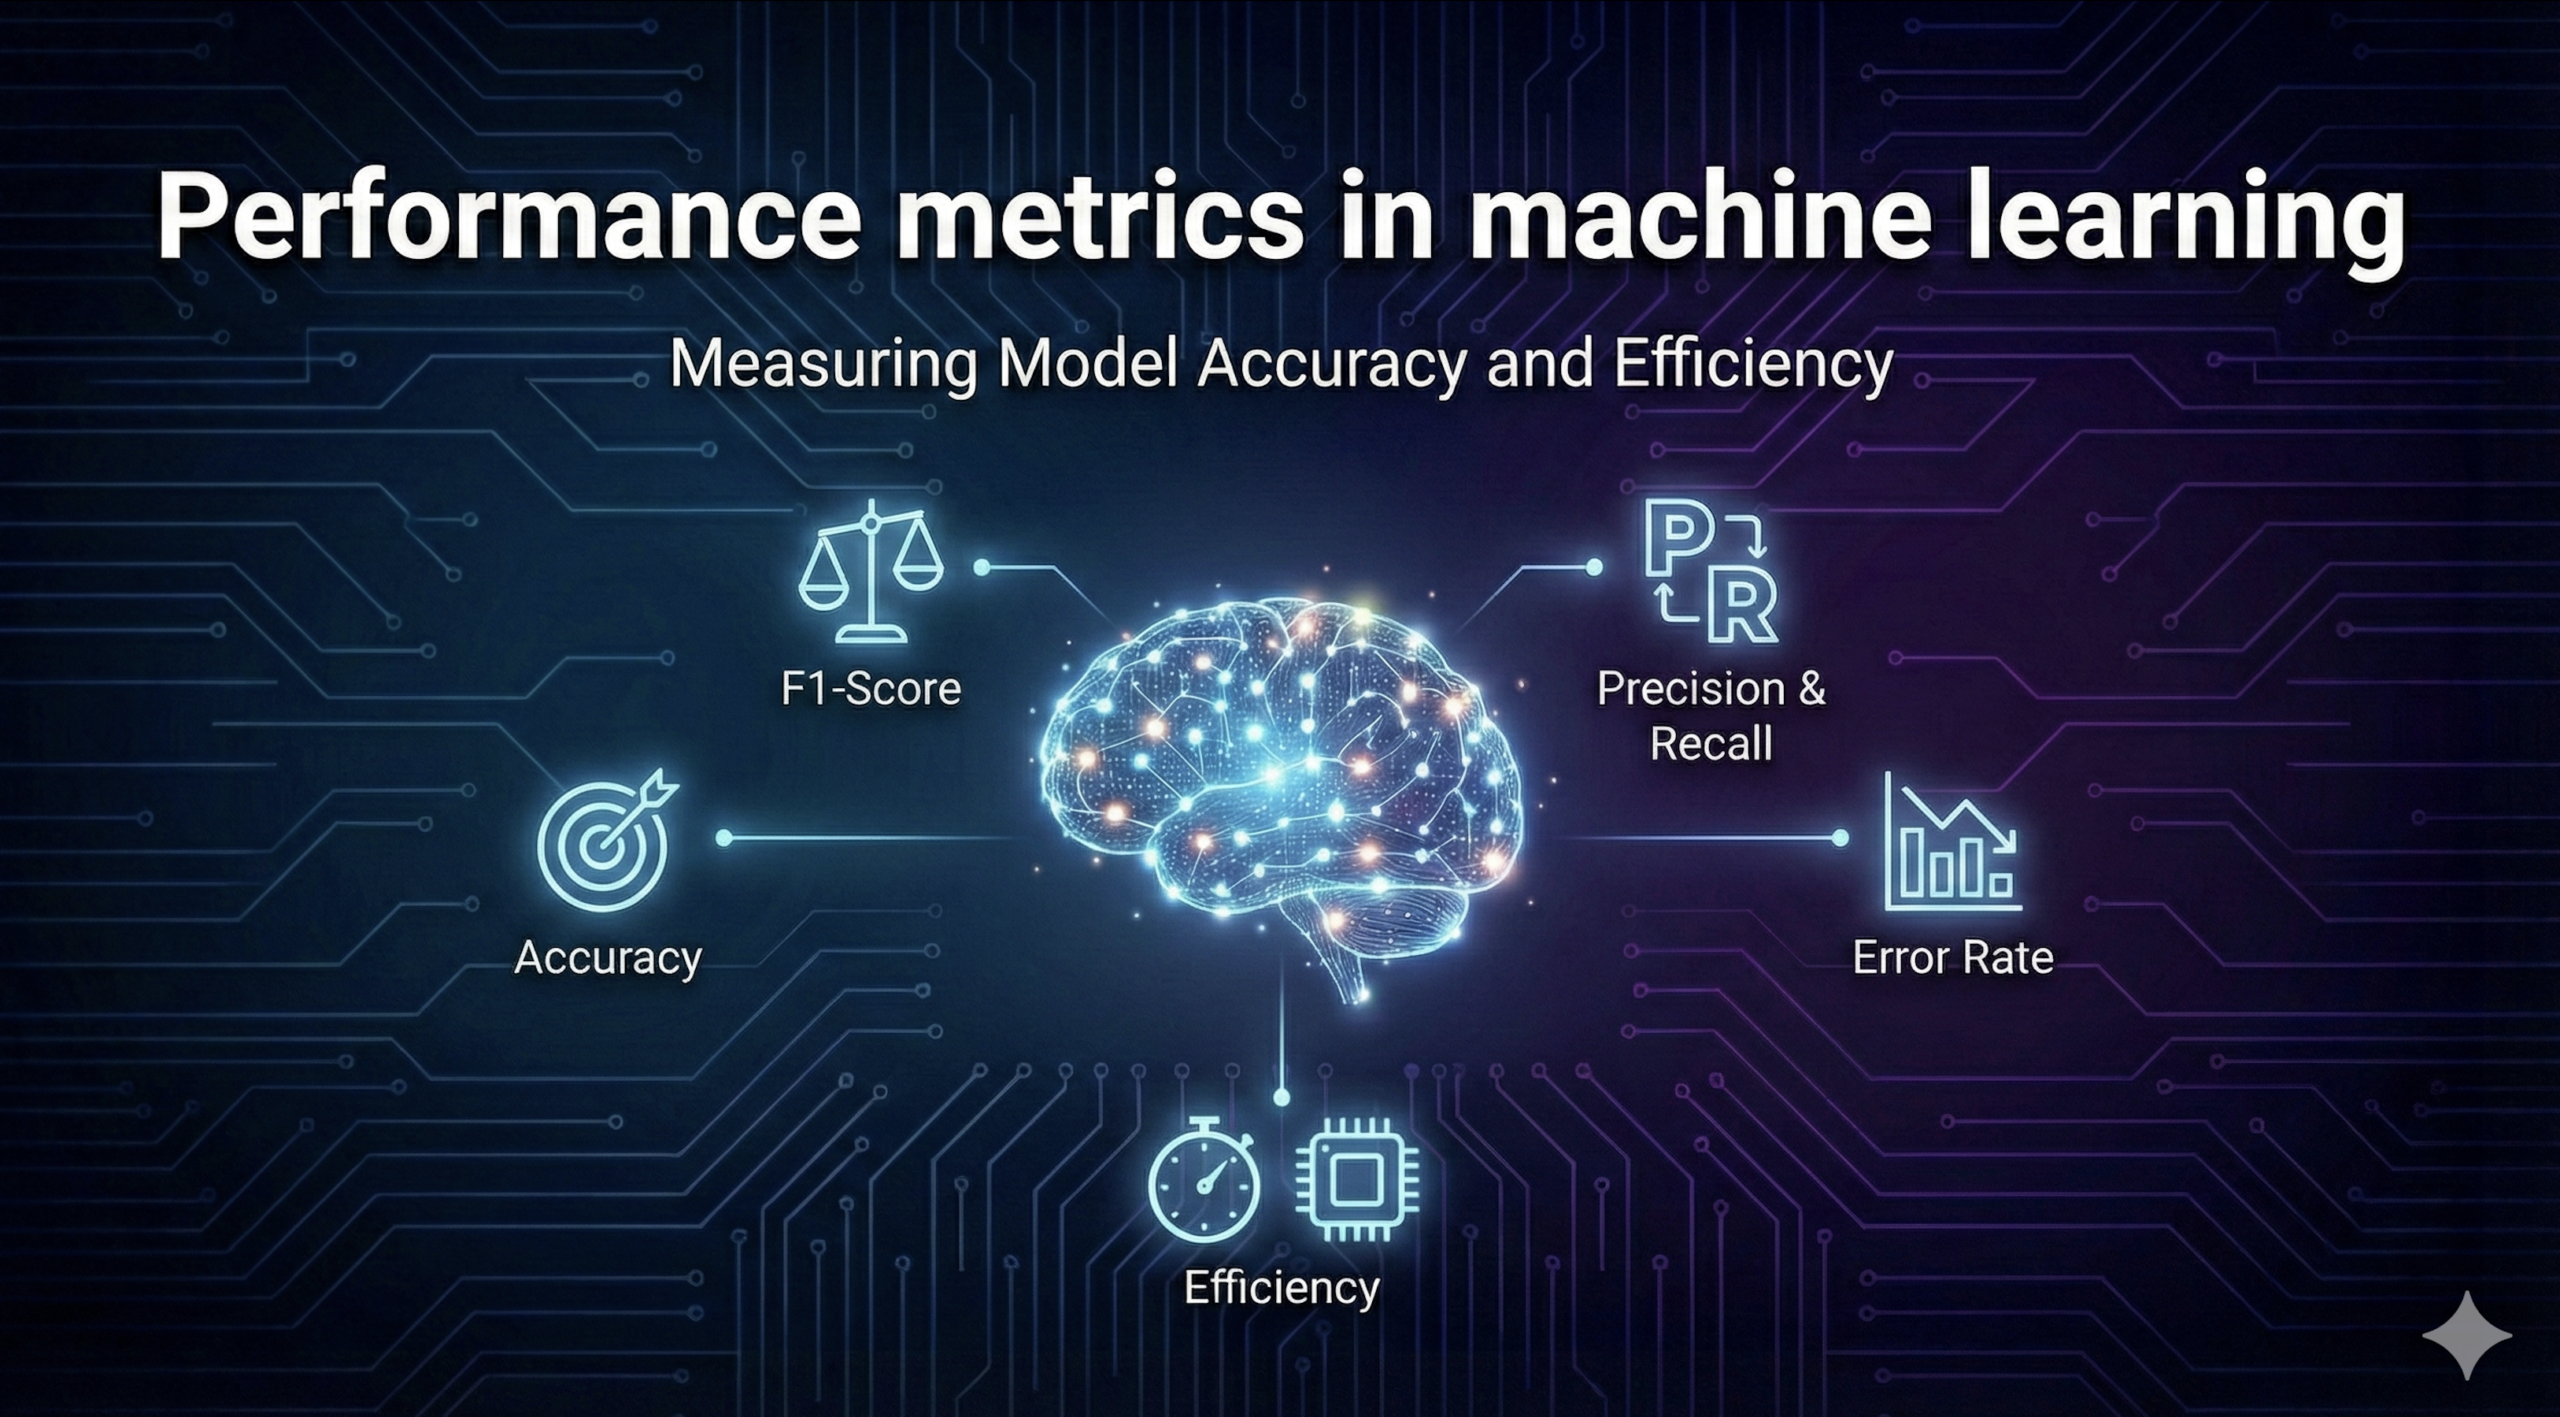
What are performance metrics in machine learning and why do they matter? Performance metrics are quantitative measures used to evaluate how well a machine‑learning model performs a specific task. They capture different aspects of model behaviour—accuracy, error rates, fairness, explainability, drift and even energy consumption—and enable practitioners to compare models, choose suitable thresholds and monitor deployed systems. Without metrics, we can’t know whether a model is useful, harmful or simply wasting resources. For high‑impact domains, robust metrics also support regulatory compliance and ethical obligations.

Quick digest of this guide

This article follows a structured approach:

  • Importance of metrics: We start by explaining why metrics are essential and why relying on a single measure like accuracy can be misleading.
  • Classification metrics: We demystify accuracy, precision, recall, F1‑score and the ROC–AUC, showing when to use each. The trade‑offs between false positives and false negatives are highlighted with real examples.
  • Regression and forecasting metrics: We explore error metrics (MAE, MSE, RMSE), the coefficient of determination, and time‑series metrics like MAPE, sMAPE, MASE and CRPS, showing how they impact forecasting.
  • Generative and LLM metrics: We cover perplexity, BLEU, ROUGE, BERTScore, METEOR, GPTScore and FID—metrics tailored to generative text and image models—and discuss RAG‑specific evaluation like faithfulness.
  • Explainability and fairness: We dive into interpretability metrics such as LIME and SHAP, as well as fairness metrics like demographic parity and equalized odds. We examine why fairness evaluations are essential and how biases can creep in.
  • Model drift and monitoring: We discuss data drift, concept drift and prediction drift, along with statistical tests and monitoring strategies to detect them early.
  • Energy and sustainability: We introduce energy‑efficiency metrics for AI models, an emerging area of responsible AI.
  • Best practices and tools: Finally, we provide evaluation best practices, describe Clarifai’s solutions, and survey emerging research and regulatory trends, then conclude with FAQs.

Let’s start by understanding why we need metrics in the first place.

Understanding performance metrics: importance and context

Machine‑learning models learn patterns from historical data, but their real purpose is to generalize to future data. Performance metrics quantify how closely a model’s outputs match desired outcomes. Without appropriate metrics, practitioners risk deploying systems that appear to perform well but fail when faced with real‑world complexities or suffer from unfair biases.

Why metrics matter

  • Model selection and tuning: During development, data scientists experiment with different algorithms and hyperparameters. Metrics allow them to compare models objectively and choose the approach that best meets requirements.
  • Business alignment: A “good” model is not solely defined by high accuracy. Decision‑makers care about business impact metrics like cost savings, revenue increase, user adoption and risk reduction. A model with 95 % accuracy that saves 10 hours per week may be more valuable than a 99 % accurate model that is difficult to use.
  • Stakeholder trust and compliance: In regulated industries, metrics ensure models meet legal requirements. For example, fairness metrics help avoid discriminatory outcomes, and explainability metrics support transparency.
  • Monitoring deployed systems: Once in production, models encounter data drift, concept drift and changing environments. Continuous monitoring metrics help detect degradation early and trigger retraining or replacement..
  • Ethical and societal considerations: Metrics can expose bias and facilitate corrective action. They also inform energy consumption and environmental impact in the era of Green AI.

Pitfalls of a single metric

One of the biggest mistakes in ML evaluation is relying on a single metric. Consider a binary classifier used to screen job applicants. If the dataset is highly imbalanced (1 % positive, 99 % negative), a model that labels everyone as negative will achieve 99 % accuracy. However, such a model is useless because it never selects qualified candidates. Similarly, a high precision model might reject too many qualified applicants, whereas a high recall model could accept unqualified ones. The right balance depends on the context.

Clarifai’s holistic evaluation philosophy

Clarifai, a market leader in AI, advocates a multi‑metric approach. Its platform provides out‑of‑the‑box dashboards for accuracy, recall and F1‑score, but also tracks fairness, explainability, drift and energy consumption. With compute orchestration, you can deploy models across cloud and edge environments and compare their metrics side by side. Its model inference endpoints automatically log predictions and metrics, while local runners allow evaluation on‑premises without data leaving your environment.

Classification metrics – accuracy, precision, recall, F1 & ROC‑AUC

Classification models predict categorical labels: spam vs. ham, cancer vs. healthy, or approved vs. denied. Several core metrics describe how well they perform. Understanding these metrics and their trade‑offs is crucial for choosing the right model and threshold.

Accuracy

Accuracy is the proportion of correct predictions out of all predictions. It’s intuitive and widely used but can be misleading on imbalanced datasets. In a fraud detection system where only 0.1 % of transactions are fraudulent, a model that flags none will be nearly 100 % accurate yet miss all fraud. Accuracy should be supplemented with other metrics.

Precision and recall

Precision measures the proportion of positive predictions that are actually positive. It answers the question: When the model says “yes,” how often is it right? A spam filter with high precision rarely marks a legitimate email as spam. Recall (also called sensitivity or true positive rate) measures the proportion of actual positives that are captured. In medical diagnostics, a high recall ensures that most disease cases are detected. Often there is a trade‑off between precision and recall: improving one can worsen the other.

F1‑score

The F1‑score combines precision and recall using the harmonic mean. It is particularly useful when dealing with imbalanced classes. The harmonic mean penalizes extreme values; thus a model must maintain both decent precision and recall to achieve a high F1. This makes F1 a better indicator than accuracy in tasks like rare disease detection, where the positive class is much smaller than the negative class.

ROC curve and AUC

The Receiver Operating Characteristic (ROC) curve plots the true positive rate against the false positive rate at various threshold settings. The Area Under the ROC Curve (AUC) quantifies the overall ability of the model to distinguish between classes. An AUC of 1.0 indicates perfect discrimination, whereas 0.5 suggests random guessing. AUC is particularly useful when classes are imbalanced or when thresholds may change after deployment.

Additional classification metrics

  • Specificity (true negative rate): measures how well the model identifies negative cases.
  • Matthews correlation coefficient (MCC): a balanced measure that considers all four confusion matrix categories.
  • Balanced accuracy: the average of recall for each class, useful for imbalanced data.

Expert insights

  • Contextual trade‑offs: In medical testing, false negatives could be life‑threatening, so recall takes priority; in spam filtering, false positives annoy users, so precision may be more important.
  • Business impact metrics: Technical metrics must be mapped to business outcomes, such as cost of errors and user satisfaction. A model that slightly reduces accuracy but halves manual review time may be preferable.
  • Clarifai advantage: The Clarifai platform automatically logs confusion matrices and computes precision‑recall curves. Built‑in dashboards help you identify the right operating threshold and evaluate models on new data slices without coding.

Regression metrics – MAE, MSE, RMSE & R²

Regression models predict continuous values such as housing prices, temperature or credit risk scores. Unlike classification, there is no “correct class”; instead we measure errors.

Mean Absolute Error (MAE)

MAE is the average absolute difference between predicted and actual values. It is easy to interpret because it is expressed in the same units as the target variable. MAE treats all errors equally and is robust to outliers.

Mean Squared Error (MSE) & Root Mean Squared Error (RMSE)

MSE is the average of squared errors. Squaring penalizes larger errors more heavily, making MSE sensitive to outliers. RMSE is simply the square root of MSE, returning the metric to the original units. RMSE is often preferred in practice because it is interpretable yet emphasizes large deviations.

Coefficient of determination (R²)

R² measures the proportion of variance in the dependent variable that is predictable from the independent variables. An R² of 1 means the model explains all variability; 0 means it explains none. Adjusted R² accounts for the number of predictors and penalizes adding variables that do not improve the model. Although widely used, R² can be misleading if the data violate linear assumptions.

When to use each metric

  • MAE is robust and useful when outliers should not overly influence the model.
  • MSE/RMSE are better when large errors are undesirable (e.g., energy load forecasting where big underestimates can cause failures). RMSE is often easier to interpret.
  • R² is useful for comparing models with the same dependent variable, but it should not be the sole metric. Low R² values can still be acceptable if predictions are close enough for the task.

Expert insights

  • Multiple metrics: Practitioners should use a combination of MAE, RMSE and R² to capture different perspectives. This helps avoid overfitting to a single metric.
  • Domain relevance: In finance, a few large errors may be catastrophic, so RMSE is important; in budgeting applications where each dollar counts, MAE might suffice.
  • Clarifai integration: Clarifai allows you to define custom metrics; regression endpoints return prediction logs that you can pipe into dashboards. Integration with data warehouses and business intelligence tools lets you overlay business metrics (e.g., revenue) with error metrics.

Forecasting & time‑series metrics – MAE, MAPE, sMAPE, MASE, CRPS

Time‑series forecasting introduces additional challenges: seasonality, trend shifts and scale variations. Metrics must account for these factors to provide meaningful comparisons. presents a concise summary of forecasting metrics.

Mean Absolute Percentage Error (MAPE)

MAPE expresses the error as a percentage of the actual value. It is scale‑invariant, making it useful for comparing forecasts across different units. However, it fails when actual values approach zero, producing extremely large errors or undefined values.

Symmetric MAPE (sMAPE)

sMAPE adjusts MAPE to treat over‑ and under‑predictions symmetrically by normalizing the absolute error by the average of the actual and predicted values. This prevents the metric from ballooning when actual values are near zero.

Mean Absolute Scaled Error (MASE)

MASE scales the MAE by the in‑sample MAE of a naïve forecast (e.g., previous period). It enables comparison across series and indicates whether the model outperforms a simple benchmark. A MASE less than 1 means the model is better than the naïve forecast, while values greater than 1 indicate underperformance.

Continuous Ranked Probability Score (CRPS)

Traditional metrics like MAE and MAPE work on point forecasts. CRPS evaluates probabilistic forecasts by integrating the squared difference between the predicted cumulative distribution and the actual outcome. CRPS rewards both sharpness (narrow distributions) and calibration (distribution matches reality), providing a more holistic measure.

Expert insights

  • Forecasting decisions: In demand forecasting, MAPE and sMAPE help businesses plan inventory; a high error could result in stockouts or overstock. sMAPE is better when data contain zeros or near‑zero values.
  • Probabilistic models: As probabilistic forecasting (e.g., quantile forecasts) becomes more common, CRPS is increasingly important. It encourages models to produce well‑calibrated distributions.
  • Clarifai’s support: Clarifai’s platform can orchestrate time‑series models and compute these metrics at run time. With compute orchestration, you can run forecasting models on streaming data and evaluate CRPS automatically.

Generative AI & language model metrics – Perplexity, BLEU, ROUGE, BERTScore & FID

Generative models have exploded in popularity. Evaluating them requires metrics that capture not just correctness but fluency, diversity and semantic alignment. Some metrics apply to language models, others to image generators.

Perplexity

Perplexity measures how “surprised” a language model is when predicting the next word. Lower perplexity indicates that the model assigns higher probabilities to the actual sequence, implying better predictive capability. A perplexity of 1 means the model perfectly predicts the next word; a perplexity of 10 suggests the model is essentially guessing among ten equally likely options. Perplexity does not require a reference answer and is particularly useful for evaluating unsupervised generative models.

BLEU

The Bilingual Evaluation Understudy (BLEU) score compares a generated sentence with one or more reference sentences, measuring the precision of n‑gram overlaps. It penalizes shorter outputs via a brevity penalty. BLEU is widely used in machine translation but may not correlate well with human perception for long or open‑ended texts.

ROUGE

ROUGE (Recall‑Oriented Understudy for Gisting Evaluation) measures recall rather than precision. Variants like ROUGE‑N and ROUGE‑L evaluate overlapping n‑grams and the longest common subsequence. ROUGE is popular for summarization tasks.

METEOR, WER, BERTScore & GPTScore

  • METEOR improves upon BLEU by considering synonym matches and stemming, offering higher correlation with human judgments.
  • Word Error Rate (WER) measures transcription accuracy by computing the number of insertions, deletions and substitutions.
  • BERTScore uses contextual embeddings from a pretrained language model to compute semantic similarity between generated and reference texts. Unlike n‑gram metrics, it captures deeper meaning.
  • GPTScore (also known as LLM‑as‑a‑Judge) uses a large language model to evaluate another model’s output. It shows promise but raises questions about reliability and biases.

Fréchet Inception Distance (FID)

For generative images, the FID compares the distribution of generated images to that of real images by computing the difference between their mean and covariance in a feature space extracted by an Inception network. Lower FID scores indicate closer alignment with the real image distribution. FID has become the standard metric for evaluating generative image models.

RAG‑specific metrics

Retrieval‑Augmented Generation (RAG) models rely on a retrieval component to provide context. Evaluation metrics include faithfulness (does the model stay true to retrieved sources), contextual relevance (is the retrieved information relevant) and hallucination rate (how often the model invents facts). These metrics are still evolving and often require human or LLM‑based judgments.

Expert insights

  • Beyond n‑grams: N‑gram metrics like BLEU and ROUGE can discourage creative or diverse generation. Embedding‑based metrics such as BERTScore address this by capturing semantic similarity.
  • Limitations of perplexity: Perplexity assumes access to model probabilities; it is less useful when working with black‑box APIs.
  • FID adoption: FID is widely used in research competitions because it correlates well with human judgments.
  • Clarifai’s capabilities: Clarifai’s generative platform provides evaluation pipelines for text and image models. You can compute BLEU, ROUGE, FID and BERTScore directly through the dashboard or via API. Clarifai also offers RAG pipelines with metrics for hallucination and context relevance, helping you improve retrieval strategies.

Explainability & interpretability metrics – LIME, SHAP and beyond

Model interpretability is critical for trust, debugging and regulatory compliance. It answers the question “Why did the model make this prediction?” While accuracy tells us how well a model performs, interpretability tells us why. Two popular methods for generating feature importance scores are LIME and SHAP.

Local Interpretable Model‑agnostic Explanations (LIME)

LIME creates local surrogate models by perturbing inputs around a prediction and fitting a simple, interpretable model (e.g., linear regression or decision tree) to approximate the complex model’s behaviour. Strengths:

  • Model agnostic: Works with any black‑box model.
  • Produces intuitive explanations for a single prediction.
  • Supports different data types (text, images, tabular).

Limitations:

  • Local explanations may not generalize globally.
  • Sensitive to how the neighborhood is defined; different perturbations can lead to different explanations.
  • Instability makes repeated runs produce different explanations.

SHapley Additive exPlanations (SHAP)

SHAP assigns each feature an importance value by calculating its average contribution across all possible feature orderings, grounded in cooperative game theory. Strengths:

  • Provides both local and global explanations.
  • Theoretically consistent—features with larger contributions receive higher scores.
  • Produces effective visualizations (e.g., summary plots).

Limitations:

  • Computationally expensive, particularly with many features.
  • Assumes feature independence, which may not hold in real data.

Other interpretability measures

  • Integrated gradients and DeepLIFT compute attribution scores for deep networks using path integrals.
  • Grad‑CAM produces heatmaps for convolutional networks.
  • Counterfactual explanations suggest minimal changes to flip the prediction.

Expert insights

  • Interpretability is contextual: A doctor may require different explanations than a data scientist. Explanations must be tailored to the domain and user.
  • Beware of oversimplification: Local approximations like LIME can oversimplify complex models and may mislead if treated as global truths. Practitioners should combine local and global explanations.
  • Clarifai’s explainability features: Clarifai provides built‑in explanation tools that leverage both SHAP and integrated gradients. Visual dashboards highlight which input features influenced a prediction, and API endpoints allow users to generate explanations programmatically.

Fairness & ethical metrics – demographic parity, equalized odds & beyond

Even highly accurate models can cause harm if they systematically disadvantage certain groups. Fairness metrics are essential for identifying and mitigating bias.

Why bias occurs

Bias can enter at any stage: measurement bias (faulty labels), representation bias (underrepresented groups), sampling bias (non‑random sampling), aggregation bias (combining groups incorrectly) and omitted variable bias. For example, a facial recognition system trained on predominantly lighter‑skinned faces may misidentify darker‑skinned individuals. A hiring model trained on past hiring data may perpetuate historical inequities.

Demographic parity

Demographic parity requires that the probability of a positive outcome is independent of sensitive attributes. In a resume screening system, demographic parity means equal selection rates across demographic groups. Failing to meet demographic parity can generate allocation harms, where opportunities are unevenly distributed.

Equalized odds

Equalized odds is stricter than demographic parity. It demands that different groups have equal true positive rates and false positive rates. A model may satisfy demographic parity but produce more false positives for one group; equalized odds avoids this by enforcing equality on both types of errors. However, it may lower overall accuracy and can be challenging to achieve.

Equal opportunity and the Four‑Fifths rule

Equal opportunity is a relaxed version of equalized odds, requiring equal true positive rates across groups but not equal false positive rates. The Four‑Fifths rule (80 % rule) is a heuristic from U.S. employment law. It states that a selection rate for any group should not be less than 80 % of the rate for the highest‑selected group. Although frequently cited, the Four‑Fifths rule can mislead because fairness must be considered holistically and within legal context.

Fairness evaluation research

Recent research proposes k‑fold cross‑validation with t‑tests to evaluate fairness across protected attributes. This approach provides statistical confidence intervals for fairness metrics and avoids spurious conclusions. Researchers emphasize that fairness definitions should be context‑dependent and adaptable.

Expert insights

  • No one‑size‑fits‑all: Demographic parity may be inappropriate when base rates differ legitimately (e.g., disease prevalence). Equalized odds may impose undue costs on some groups. Practitioners must collaborate with stakeholders to choose metrics.
  • Avoid misuse: The Four‑Fifths rule, when applied outside its legal context, can give a false sense of fairness. Fairness is broader than compliance and should focus on harm reduction.
  • Regulatory landscape: Policies like the EU AI Act and Algorithmic Accountability Act emphasise transparency and fairness. Keeping abreast of these regulations is vital.
  • Clarifai’s fairness tooling: Clarifai’s platform lets you define sensitive attributes and compute demographic parity, equalized odds and other fairness metrics. It offers dashboards to compare models across demographic segments and supports fairness constraints during model training.

Model drift & monitoring – tracking data, concept & prediction drift

Model performance isn’t static. Real‑world data shift over time due to evolving user behaviour, market trends or external shocks. Model drift is a catch‑all term for these changes. Continuous monitoring is essential to detect drift early and maintain model reliability.

Types of drift

  • Data drift (covariate shift): The distribution of input features changes while the relationship between input and output remains the same. For example, a recommendation system may see new customer demographics.
  • Concept drift: The relationship between features and the target variable changes. During the COVID‑19 pandemic, models predicting sales based on historical patterns failed as consumer behaviour shifted dramatically.
  • Prediction drift: The distribution of predictions changes, possibly indicating issues with input distribution or concept drift.

Detecting drift

Several statistical tests help detect drift:

  • Jensen–Shannon divergence measures the similarity between two probability distributions; larger values indicate drift.
  • Kolmogorov–Smirnov (KS) test compares the cumulative distribution functions of two samples to assess whether they differ significantly.
  • Population Stability Index (PSI) quantifies distributional change over time; values above a threshold signal drift.
  • Proxy metrics: When labels are delayed or unavailable, unsupervised drift metrics act as proxies.

Monitoring techniques

  • Holdout testing: Evaluate the model on a reserved set not used in training.
  • Cross‑validation: Partition data into folds and average performance across them.
  • Stress testing: Probe the model with edge cases or synthetic shifts to identify fragility.
  • A/B testing: Compare the current model with a new model on live traffic.

Expert insights

  • Early detection matters: In production, labels may arrive weeks later. Drift metrics provide early warning signals to trigger retraining.
  • Use multiple indicators: Combining distributional tests with performance metrics improves detection reliability.
  • Clarifai’s monitoring: Clarifai’s Model Monitor service tracks data distributions and outputs. It alerts you when PSI or JS divergence exceeds thresholds. Integration with compute orchestration means you can retrain or swap models automatically.

Energy & sustainability metrics – measuring AI’s environmental impact

Large models consume significant energy. As awareness of climate impact grows, energy metrics are emerging to complement traditional performance measures.

AI Energy Score

The AI Energy Score initiative establishes standardized energy‑efficiency ratings for AI models, focusing on controlled benchmarks across tasks and hardware. The project uses star ratings from 1 to 5 to indicate relative energy efficiency: 5 stars for the most efficient models and 1 star for the least efficient. Ratings are recalibrated regularly as new models are evaluated.

Methodology

  • Benchmarks focus on inference energy consumption rather than training, as inference presents more variability.
  • Tasks, hardware (e.g., NVIDIA H100 GPUs) and configurations are standardized to ensure comparability.
  • Efficiency should be considered alongside performance; a slower but more accurate model may be acceptable if its energy cost is justified.

Expert insights

  • Green AI movement: Researchers argue that energy consumption should be a first‑class metric. Energy‑efficient models lower operational costs and carbon footprint.
  • Best practices: Use model compression (e.g., pruning, quantization), choose energy‑efficient hardware and schedule heavy tasks during low‑carbon periods.
  • Clarifai’s sustainability features: Clarifai optimizes compute scheduling and supports running models on energy‑efficient edge devices. Energy metrics can be integrated into evaluation pipelines, enabling organizations to track carbon impact.

Best practices for evaluating ML models – lifecycle & business considerations

Evaluation isn’t a one‑time event. It spans the model lifecycle from ideation to retirement. Here are best practices to ensure robust evaluation.

Use appropriate validation techniques

  • Train/test split: Divide data into training and testing sets. Ensure the test set represents future use cases.
  • Cross‑validation: Perform k‑fold cross‑validation to reduce variance and better estimate generalization.
  • Evaluation on unseen data: Test the model on data it has never encountered to gauge real‑world performance.
  • Temporal splits: For time‑series, split chronologically to avoid leakage.

Align metrics with business goals

Metrics must capture what matters to stakeholders: cost, risk, compliance and user experience. For example, cost of errors, time savings, revenue impact and user adoption are crucial business metrics.

Balance multiple objectives

No single metric can represent all facets of model quality. Combine accuracy, fairness, interpretability, drift resilience and sustainability. Use multi‑objective optimization or scoring systems.

Set thresholds and calibrate

Determine decision thresholds using metrics like precision‑recall curves or cost–benefit analysis. Calibration ensures predicted probabilities reflect actual likelihoods, improving decision quality.

Document and communicate

Maintain transparent documentation of datasets, metrics, biases and assumptions. Communicate results in plain language to stakeholders, emphasizing limitations.

Continuous improvement

Monitor models in production, track drift and fairness metrics, and retrain or update when necessary. Establish feedback loops with domain experts and end‑users.

Expert insights

  • Holistic evaluation: Experts emphasise that evaluation should consider the entire sociotechnical context, not just algorithmic performance.
  • Stakeholder collaboration: Engage legal, ethical and domain experts to choose metrics and interpret results. This builds trust and ensures compliance.
  • Clarifai’s MLOps: Clarifai provides versioning, lineage tracking and compliance reporting. You can run experiments, compare metrics, and share dashboards with business stakeholders.

Tools & platforms for metric tracking – Clarifai and the ecosystem

Modern ML projects demand tools that can handle data management, model training, evaluation and deployment in an integrated way. Here’s how Clarifai fits into the ecosystem.

Clarifai’s product stack

  • Compute orchestration: Orchestrate models across cloud, on‑prem and edge. This ensures consistent evaluation environments and efficient resource utilization.
  • Model inference endpoints: Deploy models via RESTful APIs; automatically log predictions and ground truth to compute metrics like accuracy, precision and recall.
  • Local runners: Run models in secure environments without sending data to external servers; important for privacy‑sensitive industries.
  • Dashboards and analytics: Visualize metrics (confusion matrices, ROC curves, fairness dashboards, drift charts, energy usage) in real time. Drill down by feature, demographic group or time window.

Integrations with the wider ecosystem

Clarifai integrates with open‑source libraries and third‑party tools:

  • Fairlearn: Use Fairlearn metrics for demographic parity, equalized odds and equal opportunity. Clarifai can ingest the outputs and display them on fairness dashboards.
  • Evidently: Monitor drift using PSI, JS divergence and other statistical tests; Clarifai’s Model Monitor can call these functions automatically. The Evidently guide emphasises concept and data drift’s impact on ML systems.
  • Interpretability libraries: Clarifai supports SHAP and integrated gradients; results appear in the platform’s explainability tab.

Case studies and examples

  • Retail demand forecasting: A retailer uses Clarifai to orchestrate time‑series models on edge devices in stores. Metrics like MAPE and sMAPE are calculated on streaming sales data and displayed in dashboards. Alerts trigger when error exceeds thresholds.
  • Healthcare diagnosis: A hospital deploys an image classifier using Clarifai’s endpoints. They monitor precision and recall separately to minimise false negatives. Fairness dashboards show equalized odds across patient demographics, helping satisfy regulatory requirements.
  • Generative search: A media company uses Clarifai’s generative pipeline to summarize articles. BLEU, ROUGE and BERTScore metrics are computed automatically. RAG metrics track hallucination rate, and energy metrics encourage efficient deployment.

Expert insights

  • Unified platform benefits: Consolidating data ingestion, model deployment and evaluation reduces the risk of misaligned metrics and ensures accountability. Clarifai provides an all‑in‑one solution.
  • Custom metrics: The platform supports custom metric functions. Teams can implement domain‑specific metrics and integrate them into dashboards.

Emerging trends & research – from RAG metrics to fairness audits

The ML landscape evolves rapidly. Here are some trends shaping performance measurement.

RAG evaluation and LLMs as judges

As retrieval‑augmented generation becomes mainstream, new metrics are emerging:

  • Faithfulness: Measures whether the generated answer strictly follows retrieved sources. Lower faithfulness indicates hallucinations. Often evaluated via human annotators or LLMs.
  • Contextual relevance: Assesses whether retrieved documents are pertinent to the query. Non‑relevant context can lead to irrelevant or incorrect answers.
  • Hallucination rate: The percentage of generated statements not grounded in sources. Reducing hallucinations is critical for trustworthy systems.

Large language models themselves are used as judges—LLM‑as‑a‑Judge—to rate outputs. This technique is convenient but raises concerns about subjective biases in the evaluating model. Researchers stress the need for calibration and cross‑model evaluations.

Fairness audits and statistical testing

Research advocates rigorous fairness audits using k‑fold cross‑validation and statistical t‑tests to compare performance across groups. Audits should involve domain experts and affected communities. Automated fairness evaluations are complemented with human review and contextual analysis.

Energy metrics and Green AI

With increasing climate awareness, energy consumption and carbon emission metrics are expected to be integrated into evaluation frameworks. Tools like AI Energy Score provide standardized comparisons. Regulators may require disclosure of energy usage for AI services.

Regulations and standards

Regulatory frameworks like the EU AI Act and the Algorithmic Accountability Act emphasise transparency, fairness and safety. Industry standards (e.g., ISO/IEC 42001) may codify evaluation methods. Staying ahead of these regulations helps organisations avoid penalties and maintain public trust.

Clarifai’s research initiatives

Clarifai participates in industry consortia to develop RAG evaluation benchmarks. The company is exploring faithfulness metrics, improved fairness audits and energy‑efficient inference in its R&D labs. Early access programs allow customers to test new metrics before they become mainstream.

Conclusion & FAQs – synthesizing lessons and next steps

Performance metrics are the compass that guides machine‑learning practitioners through the complexity of model development, deployment and maintenance. There is no single “best” metric; rather, the right combination depends on the problem, data, stakeholders and ethical considerations. As AI becomes ubiquitous, metrics must expand beyond accuracy to encompass fairness, interpretability, drift resilience and sustainability.

Clarifai’s platform embodies this holistic approach. It offers tools to deploy models, monitor a wide range of metrics and integrate open‑source libraries, allowing practitioners to make informed decisions with transparency. Whether you are building a classifier, forecasting demand, generating text, or deploying an LLM‑powered application, thoughtful measurement is key to success.

Frequently asked questions

Q: How do I choose between accuracy and F1‑score?
A: Accuracy is suitable when classes are balanced and false positives/negatives have similar costs. F1‑score is better for imbalanced datasets or when precision and recall trade‑offs matter.

Q: What is a good ROC‑AUC value?
A: A ROC‑AUC of 0.5 means random guessing. Values above 0.8 generally indicate good discrimination. However, interpret AUC relative to your problem and consider other metrics like precision–recall curves.

Q: How can I detect bias in my model?
A: Compute fairness metrics such as demographic parity and equalized odds across sensitive groups. Use statistical tests and consult domain experts. Tools like Clarifai and Fairlearn can automate these analyses.

Q: What is the FID score and why does it matter?
A: FID (Fréchet Inception Distance) measures the similarity between generated images and real images in a feature space. Lower FID scores indicate more realistic generations.

Q: Do I need energy metrics?
A: If your organisation is concerned about sustainability or operates at scale, tracking energy efficiency is advisable. Energy metrics help reduce costs and carbon footprint.

Q: Can Clarifai integrate with my existing MLOps stack?
A: Yes. Clarifai supports API‑based integrations, and its modular design allows you to plug in fairness libraries, drift detection tools, or custom metrics. You can run models on Clarifai’s cloud, your own infrastructure or edge devices.

Q: How often should I retrain my model?
A: There is no one‑size‑fits‑all answer. Monitor drift metrics and business KPIs; retrain when performance drops below acceptable thresholds or when data distribution shifts.

By embracing a multi‑metric approach and leveraging modern tooling, data teams can build AI systems that are accurate, fair, explainable, robust and sustainable. As you embark on new AI projects, remember that metrics are not just numbers but stories about your model’s behaviour and its impact on people and the planet.


Meta Acquires AI Wearable Startup Limitless. What Does This Mean for User Privacy?


Meta made another major move in the race to own the future of AI wearables, acquiring Limitless AI, a startup best known for its AI-powered pendant that records and transcribes real-time conversations. Continue reading “Meta Acquires AI Wearable Startup Limitless. What Does This Mean for User Privacy?”

What Is Cloud Optimization? Practical Guide to Optimizing Cloud Usage


Quick Digest

Question

Answer

What is cloud optimization?

Cloud optimization is the continuous practice of matching the right resources to each workload to maximize performance and value while eliminating waste. Instead of simply buying compute or storage at the lowest rate, it looks at how much you actually need and when, then right-sizes deployments, automates scaling and leverages techniques like containers, serverless functions and spot capacity to reduce cost and carbon footprint.

Why does it matter now?

In 2025, organizations face rapidly growing AI workloads, rising energy costs and intense scrutiny over sustainability. Studies show 90 % of enterprises over‑provision compute resources and 60 % under‑utilize network capacity. At the same time, AI budgets are rising 36 % year‑over‑year, but only about half of firms can quantify ROI. Optimizing cloud usage ensures you get the most out of your spend while addressing environmental and regulatory pressures.

How do you optimize usage?

Start with visibility and tagging, then adopt a FinOps culture that brings engineers, finance and product teams together. Key tactics include rightsizing instances, shutting down idle resources, autoscaling, using spot or reserved capacity, containerization, lifecycle policies for storage and automating deployments. Modern platforms like Clarifai’s compute orchestration automate many of these tasks with GPU fractioning, intelligent batching and serverless scaling, enabling you to run AI workloads anywhere at a fraction of the cost.

What about sustainability?

Sustainability moved from a long‑term aspiration to an immediate operational constraint in 2025. AI‑driven growth intensified pressure on power, water and land resources, leading to new design models and more transparent carbon reporting. Strategies such as optimizing water usage effectiveness (WUE), adopting renewable energy, using colocation and even exploring small modular reactors (SMRs) are emerging.

This article dives deep into what cloud optimization really means, why it matters more than ever, and how to implement it effectively. Each section includes expert insights, real data, and forward‑looking trends to help you build a resilient, cost‑efficient, and sustainable cloud strategy.

Understanding Cloud Optimization

How does cloud optimization differ from simply cutting costs?

Cloud optimization is about aligning resource usage with actual demand, not just negotiating better pricing. Traditional cost reduction focuses on lowering the rate you pay (through long‑term commitments or discounts), while usage optimization ensures you don’t pay for capacity you don’t need. ProsperOps distinguishes between these two approaches—rate optimization (e.g., reserved instances) can reduce per‑unit cost by up to 72 %, but only when workloads are right‑sized and efficiently scheduled. Usage optimization goes further by matching provisioned resources to workload requirements, removing idle assets, and automating scale‑down.

Expert Insights

  • ProsperOps: Emphasizes that rate and usage optimization must work together; long‑term discounts can save up to 72% when workloads are right‑sized.
  • FinOps Foundation: Lists opportunities such as storage optimization, autoscaling, containerization, spot instances, network optimization, scheduling, and automation as essential tactics.
  • Clarifai’s Compute Orchestration: Provides GPU fractioning, batching, and serverless autoscaling to optimize AI workloads across clouds and on‑premises, cutting compute costs by over 70%

Why Cloud Optimization Matters in 2025

Why is optimization critical now?

The year 2025 marks a turning point for cloud usage. Rapid AI adoption and macroeconomic pressures have led to unprecedented scrutiny of cloud spend and sustainability:

  • Widespread inefficiencies: Research shows 60% of organizations underutilize network resources and 90% overprovision compute. Idle resources and sprawl lead to waste.
  • Surging AI costs: A survey of engineering teams revealed that AI budgets are set to rise 36 % in 2025, yet only about half of organizations can measure the return on those investments. Without optimization, these costs will spiral.
  • Growing environmental impact: Data centers already consume about 1.5% of global electricity and 1 % of total CO₂ emissions. Training state‑of‑the‑art models can use the same energy as tens of thousands of homes and hundreds of thousands of liters of water. In 2025, sustainability is no longer optional; regulators and communities demand action.
  • C‑suite involvement: Rising cloud prices and regulatory scrutiny have brought finance leaders into cloud decisions. Forrester notes that CFOs now influence cloud strategy and governance.

Expert Insights

  • CloudKeeper report: Finds that AI and automation can reduce unexpected cost spikes by 20 % and improve rightsizing by 15–30 %. It also notes that multi‑cloud modernization (e.g., ARM‑based processors) can cut compute costs by 40 %.
  • CloudZero research: Reports that AI budgets will rise 36 % and only half of organizations can assess ROI—a clear call for better monitoring and measurement.
  • Data Center Knowledge: Describes how sustainability became an operational constraint, with AI workloads stressing power, water and land resources, leading to new design models and policies.

Core Strategies for Usage Optimization

What are the key tactics to eliminate waste?

Optimizing cloud usage is a multi‑disciplinary discipline involving engineering, finance and operations. The following tactics—grounded in industry best practices—form the basis of any optimization program:

  1. Visibility and Tagging: Create a single source of truth for cloud resources. Accurate tagging and cost allocation enable accountability and granular insights.
  2. Rightsizing Compute and Storage: Match instance sizes and storage tiers to workload requirements. Rightsizing can involve downsizing over‑provisioned instances, scaling to zero during idle periods, and moving infrequently accessed data to cheaper tiers.
  3. Shutting Down Idle Resources: Schedule or automate shutdown of development, staging or experiment environments when not in use. Tools can detect idle VMs, unused snapshots, or unattached volumes and decommission them.
  4. Autoscaling and Load Balancing: Use managed services and autoscaling policies to scale out when demand spikes and scale back in when demand drops. Combine horizontal scaling with load balancing to spread traffic efficiently.
  5. Serverless and Containers: Move episodic or event‑driven workloads to serverless functions and run microservices in containers or Kubernetes clusters. Containers allow dense packing of workloads, while serverless eliminates idle capacity.
  6. Spot and Commitment Discounts: Use spot/preemptible instances for batch and fault‑tolerant workloads and pair them with reserved or savings plans for baseline usage. Dynamic portfolio management yields significant savings.
  7. Data Transfer and Network Optimization: Optimize data egress and ingress by placing workloads in the same region, using edge caches and compressing data. For network heavy workloads, choose providers or colocation partners with predictable egress pricing.
  8. Scheduling and Orchestration: Use cron‑based or event‑driven schedulers to start and stop resources automatically. Clarifai’s compute orchestration can scale down to zero and batch inference requests to minimize idle time.
  9. Automation and AI: Implement automated cost anomaly detection, continuous monitoring and predictive analytics. Modern FinOps platforms use machine learning to forecast spend and generate actionable recommendations.

Expert Insights

  • FinOps Foundation: Recommends storage optimization, serverless computing, autoscaling, containerization, spot instances, scheduling and network optimization as high‑impact areas.
  • Flexential research: Emphasizes the importance of visibility, governance and continuous optimization and outlines tactics such as rightsizing, shutting down idle resources, using reserved instances and tiered storage.
  • Clarifai compute orchestration: Offers an automated control plane that orchestrates GPU fractioning, batching, autoscaling and spot instances across any cloud or on‑prem hardware, enabling cost‑efficient AI deployments.

Rightsizing and Compute Optimization

How do you right‑size compute resources?

Rightsizing is the practice of tailoring compute and memory resources to the actual demand of your applications. The process involves continuous measurement, analysis and adjustment:

  1. Collect metrics: Monitor CPU, memory, storage and network utilization at granular intervals. Tag resources properly and use observability tools to correlate metrics with workloads.
  2. Identify under‑utilized instances: Use FinOps tools or providers’ recommendations to find VMs running at low utilization. CloudKeeper notes that 90 % of compute resources are over‑provisioned.
  3. Resize or migrate: Downgrade to smaller instance sizes, consolidate workloads using container orchestration, or move to more efficient architectures (e.g., ARM‑based processors) that can cut costs by 40 %.
  4. Schedule non‑production environments: Turn off dev/test environments outside working hours, and use “scale to zero” functions for serverless or containerized workloads.
  5. Leverage spot and reserved capacity: For baseline workloads, commit to reserved capacity. For bursty or batch jobs, use spot instances with automation to handle interruptions.
  6. Use GPU fractioning and batching: For AI workloads, Clarifai’s compute orchestration splits GPUs among multiple jobs, packs models efficiently and batches inference requests, delivering 70 %+ cost savings.

Expert Insights

  • CloudKeeper: Reports that modernization strategies like adopting ARM‑based compute and serverless architectures reduce costs by up to 40 %.
  • Flexential: Advocates for rightsizing compute and storage and shutting down idle resources to achieve continuous optimization.
  • Clarifai: Notes that GPU fractioning and time slicing in its compute orchestration platform enable customers to cut compute costs by over 70 % and run AI workloads on any hardware.

Storage and Data Transfer Optimization

How can you reduce storage and network costs?

Storage and data transfer often hide large amounts of waste. An effective strategy addresses both capacity and egress:

  1. Tiered storage and lifecycle policies: Move infrequently accessed data to cheaper storage classes (e.g., infrequent access, cold storage) and set automated lifecycle rules to archive or delete old snapshots.
  2. Snapshot and volume cleanup: Delete outdated snapshots and detach unused volumes. The FinOps Foundation highlights storage optimization as one of the first actions in usage optimization.
  3. Data compression and deduplication: Use compression algorithms and deduplication to reduce data footprint before storage or transfer.
  4. Optimize data egress: Place compute and data in the same regions to minimize egress charges, use CDN/edge caches for frequently accessed content, and minimize cross‑cloud data movement.
  5. Network and transfer choices: Evaluate different providers’ network pricing structures. In multi‑cloud environments, use direct connections or colocation facilities to reduce egress fees and latency.

Expert Insights

  • FinOps Foundation: Lists removing snapshots and unattached volumes, using lifecycle policies and leveraging tiered storage as high‑impact actions.
  • Flexential: Advises adopting tiered storage, lifecycle management and data egress optimization as part of continuous cost governance.
  • Data Center Knowledge: Notes that water and energy usage of AI data centers is pushing operators to look at efficient cooling and resource stewardship, which includes optimizing storage density and data placement.

Modernization: Serverless, Containers & Predictive Analytics

How does modernization drive optimization?

Modern application architectures minimize idle resources and enable fine‑grained scaling:

  • Serverless computing: This model charges only for execution time, eliminating the cost of idle capacity. It is ideal for event‑driven workloads like API calls, IoT triggers and data processing. Serverless also improves scalability and reduces operational complexity.
  • Containerization and orchestration: Containers package applications and dependencies, enabling high density and portability across clouds. Kubernetes and container orchestrators handle scaling, scheduling, and resource sharing, improving utilization.
  • Predictive cost analytics: Using historical data and machine learning to forecast spending helps teams allocate resources proactively. Predictive analytics can identify cost anomalies before they occur and suggest rightsizing actions.
  • Modernization guidance and AI agents: Major cloud providers are rolling out AI‑driven tools to help modernize applications and reduce costs. For example, application modernization guidance uses AI agents to analyze code and recommend cost‑efficient architecture changes.

Expert Insights

  • Ternary blog: Explains that serverless computing reduces infrastructure costs, improves scalability and enhances operational efficiency, especially when combined with FinOps monitoring. Predictive cost analytics improves budget forecasting and resource allocation.
  • FinOps X 2025 announcements: Cloud providers announced AI agents for cost optimization and application modernization guidance that offload complex tasks and accelerate modernization.
  • DEV community article: Highlights multi‑cloud Kubernetes and AI‑driven cloud optimization as key trends, along with observability and CI/CD pipelines for multi‑cloud deployments.

Multi‑Cloud & Hybrid Strategies

Why choose multi‑cloud?

Multi‑cloud strategies, once seen as sprawl, are now purposeful plays. Using multiple providers for different workloads improves resilience, avoids vendor lock‑in and allows organizations to match workloads to the most cost‑effective or specialized services. Key considerations:

  • Flexibility and independence: Multi‑cloud strategies offer vendor independence, improved performance and high availability. They allow teams to use one provider for compute‑intensive tasks and another for AI services or backup.
  • Modern orchestration tools: Tools like Kubernetes, Terraform and Clarifai’s compute orchestration manage workloads across clouds and on‑premises. Multi‑cloud Kubernetes simplifies deployment and scaling.
  • Challenges: Complexity, security and cost management are major hurdles. Accurate tagging, unified observability and cross‑cloud monitoring are essential.
  • Strategic portfolio approach: Forrester notes that multi‑cloud is now muscle, not fat—enterprises intentionally separate workloads across providers for sovereignty, performance and strategic independence.

Implementation Steps

  1. Define strategy: Assess business needs and select providers accordingly. Consider data locality, compliance and service specialization.
  2. Use infrastructure as code (IaC): Tools like Terraform or Pulumi declare infrastructure across providers.
  3. Implement CI/CD pipelines: Integrate continuous deployment across clouds to ensure consistent rollouts.
  4. Set up observability: Use Prometheus, Grafana or cloud‑native monitoring to collect metrics across providers.
  5. Plan for connectivity and security: Leverage cloud transit gateways, secure VPNs or colocation hubs; adopt zero trust principles and unified identity management.
  6. Automate cost allocation: Adopt the FinOps Foundation’s FOCUS specification for multi‑cloud cost data. FinOps X 2025 announced expanded support from major providers for FOCUS 1.0 and upcoming versions.

Expert Insights

  • DEV community article: Suggests that multi‑cloud strategies enhance resilience, avoid vendor lock‑in and optimize performance, but require robust orchestration, monitoring and security.
  • Forrester (trends 2025): Notes that multi‑cloud has become strategic, with clouds separated by workload to exploit different architectures and mitigate dependency.
  • FinOps X 2025: Providers are adopting FOCUS billing exports and AI‑powered cost optimization features to simplify multi‑cloud cost management.

AI & Automation in Cloud Optimization

How is AI reshaping cloud cost management?

Artificial intelligence is no longer just a workload—it’s also a tool for optimizing the infrastructure it runs on. AI and machine learning help predict demand, recommend rightsizing, detect anomalies and automate decisions:

  • Predictive analytics: FinOps platforms analyze historical usage and seasonal patterns to forecast future spend and identify anomalies. AI can consider holiday seasons, new workload migrations or sudden traffic spikes.
  • AI agents for cost optimization: At FinOps X 2025, major providers unveiled AI‑powered agents that analyze millions of resources, rationalize overlapping savings opportunities and provide detailed action plans. These agents simplify decision‑making and improve cost accountability.
  • Automated recommendations: New tools recommend I/O optimized configurations, cost comparison analyses and pricing calculators to help teams model what‑if scenarios and plan migrations.
  • Cost anomaly detection and AI‑powered remediation: Enhanced FinOps hubs highlight resources with low utilization (e.g., VMs at 5 % usage) and send optimization reports to engineering teams. AI also supports automated remediation across container clusters and serverless services.
  • Clarifai’s AI orchestration: Clarifai’s compute orchestration automatically packs models, batches requests and scales across GPU clusters, applying machine‑learning algorithms to optimize inference throughput and cost. Its Local Runners allow organizations to run models on their own hardware, preserving data privacy while reducing cloud spend.

Expert Insights

  • SSRN paper: Notes that AI‑driven strategies, including predictive analytics and resource allocation, help organizations reduce costs while maintaining performance.
  • FinOps X 2025: Describes new AI agents, FOCUS billing exports and forecasting enhancements that improve cost reporting and accuracy.
  • Clarifai: Offers agentic orchestration for AI workloads—automated packaging, scheduling and scaling to maximize GPU utilization and minimize idle time.

Sustainability & Green Cloud

How does sustainability influence optimization strategies?

As AI demands soar, sustainability has become a defining factor in where and how data centers are built and operated. Key themes:

  • Energy efficiency: Running workloads in optimized cloud environments can be 4.1 times more energy efficient and reduce carbon footprint by up to 99 % compared with typical enterprise data centers. Using purpose‑built silicon can further reduce emissions for compute‑heavy workloads.
  • Water and cooling: Sustainability pressures in 2025 highlight water use effectiveness (WUE) and cooling innovations. Data centers must balance performance with resource stewardship and adopt strategies like heat reuse and liquid cooling.
  • Renewable energy and carbon reporting: Providers and enterprises are investing in renewable power (solar, wind, hydro), and carbon emissions reporting is becoming standard. Reporting mechanisms use region‑specific emission factors to calculate footprints.
  • Colocation and edge: Shared colocation facilities and regional edge sites can lower emissions through multi‑tenant efficiencies and shorter data paths.
  • Public and policy pressure: Communities and policymakers are scrutinizing AI data centers for water use, noise, and grid impact. Policies around emissions, water rights and land use influence site selection and investment.

Expert Insights

  • Data Center Knowledge: Reports that sustainability moved from aspiration to operational constraint in 2025, with AI growth stressing power, water and land resources. It highlights strategies like optimizing WUE, renewable energy, and colocation to meet climate goals.
  • AWS study: Shows that migrating workloads to optimized cloud environments can reduce carbon footprint by up to 99 %, especially when paired with purpose‑built processors.
  • CloudZero sustainability report: Points out that generative AI training uses huge amounts of electricity and water, with training large models consuming as much power as tens of thousands of homes and hundreds of thousands of liters of water.

Clarifai’s Approach to Cloud Optimization

How does Clarifai help optimize AI workloads?

Clarifai is known for its leadership in AI, and its Compute Orchestration and Local Runners products offer concrete ways to optimize cloud usage:

  • Compute Orchestration: Clarifai provides a unified control plane that orchestrates AI workloads across any environment—public cloud, on‑premises, or air‑gapped. It automatically deploys models on any hardware and manages compute clusters and node pools for training and inference. Key optimization features include:
    • GPU fractioning and time slicing: Splits GPUs among multiple models, increasing utilization and reducing idle time. Customers have reported cutting compute costs by more than 70 %.
    • Batching and streaming: Batches inference requests to improve throughput and supports streaming inference, processing up to 1.6 million inputs per second with five‑nines reliability.
    • Serverless autoscaling: Automatically scales clusters up or down to match demand, including the ability to scale to zero, minimizing idle costs.
    • Hybrid & multi‑cloud support: Deploys across public clouds or on‑premises. You can run compute in your own environment and communicate outbound only, improving security and allowing you to use pre‑committed cloud spend.
    • Model packing: Packs multiple models into a single GPU, reducing compute usage by up to 3.7× and achieving 60–90 % cost savings depending on configuration.
  • Local Runners: Clarifai’s Local Runners allow you to run AI models on your own hardware—laptops, servers or private clouds—while maintaining unified API access. This means:
    • Data remains local, addressing privacy and compliance requirements.
    • Cost savings: You can leverage existing hardware instead of paying for cloud GPUs.
    • Easy integration: A single command registers your hardware with Clarifai’s platform, enabling you to combine local models with Clarifai’s hosted models and other tools.
    • Use case flexibility: Ideal for token‑hungry language models or sensitive data that must stay on‑premises. Supports agent frameworks and plug‑ins to integrate with existing AI workflows.

Expert Insights

  • Clarifai customers: Report cost reductions of over 70 % from GPU fractioning and autoscaling.
  • Clarifai documentation: Highlights the ability to deploy compute anywhere at any scale and achieve 60–90 % cost savings by combining serverless autoscaling, model packing and pre‑committed spend.
  • Local Runners page: Notes that running models locally reduces public cloud GPU costs, keeps data private and enables rapid experimentation.

Future Trends & Emerging Topics

What’s next for cloud optimization?

Looking beyond 2025, several trends are shaping the future of cloud cost management:

  • AI agents and FinOps automation: The emergence of AI agents that analyze usage and generate actionable insights will continue to grow. Providers announced AI agents that rationalize overlapping savings opportunities and offer self‑service recommendations. FinOps platforms will become more autonomous, capable of self‑optimizing workloads.
  • FOCUS standard adoption: The FinOps Open Cost & Usage Specification (FOCUS) standardizes cost reporting across providers. At FinOps X 2025, major providers committed to supporting FOCUS and launched exports for BigQuery and other analytics tools. This will improve multi‑cloud cost visibility and governance.
  • Zero trust and sovereign clouds: As regulations tighten, organizations will adopt zero trust architectures and sovereign cloud options to ensure data control and compliance across borders. Workload placement decisions will balance cost, performance and jurisdictional requirements.
  • Supercloud and seamless edge: The concept of supercloud, in which cross‑cloud services and edge computing converge, will gain traction. Workloads will move seamlessly between clouds, on‑premises and edge devices, requiring intelligent orchestration and unified APIs.
  • Autonomic and sustainable clouds: The future includes self‑optimizing clouds that monitor, predict and adjust resources automatically, reducing human intervention. Sustainability strategies will incorporate renewable energy, water stewardship, liquid cooling, circular procurement and potentially small modular nuclear reactors.
  • Sustainability reporting: Carbon reporting and water usage metrics will become standardized. Tools will integrate emissions data into cost dashboards, enabling users to optimize for both dollars and carbon.
  • AI ROI measurement: As AI budgets grow, organizations will invest in tooling to measure ROI and unit economics, linking cloud spend directly to business outcomes. Clarifai’s analytics and third‑party FinOps tools will play a key role.

Expert Insights

  • Forrester (cloud trends): Predicts that multi‑cloud strategies and AI‑native services will reshape cloud markets. CFOs will play a larger role in cloud governance.
  • FinOps X 2025: Illustrates how AI agents, FOCUS support and carbon reporting are evolving into mainstream features.
  • Data Center Knowledge: Notes that sustainability pressures, water scarcity and policy interventions will dictate where data centers are built and what technologies (renewables, SMRs) are adopted.

Frequently Asked Questions (FAQs)

Is cloud optimization only about cutting costs?

No. While reducing spend is a key benefit, cloud optimization is about maximizing business value. It encompasses performance, scalability, reliability and sustainability. Properly optimized workloads can accelerate innovation by freeing budgets and resources, improve user experience and ensure compliance. For AI workloads, optimization also enables faster inference and training.

How often should I revisit my optimization strategy?

Cloud environments and business needs change rapidly. Adopt a continuous optimization mindset—monitor usage daily, review rightsizing and reserved capacity monthly, and conduct deep assessments quarterly. FinOps culture encourages ongoing collaboration between engineering, finance and product teams.

Do I need to adopt multi‑cloud to optimize costs?

Multi‑cloud is not mandatory but can be advantageous. Use it when you need vendor independence, specialized services or regional resilience. However, multi‑cloud increases complexity, so evaluate whether the added benefits justify the overhead.

How does Clarifai handle data privacy when running models locally?

Clarifai’s Local Runners allow you to deploy models on your own hardware, meaning your data never leaves your environment. You still benefit from Clarifai’s unified API and orchestration, but you retain full control over data and compliance. This approach also reduces reliance on cloud GPUs, saving costs.

What metrics should I track to gauge optimization success?

Key metrics include cost per workload, waste rate (unused or over‑provisioned resources), percentage of spend under committed pricing, variance against budget, carbon footprint per workload and service‑level objectives. Clarifai’s dashboards and FinOps tools can integrate these metrics for real‑time visibility.


By embracing a holistic cloud optimization strategy—combining cultural changes, technical best practices, AI‑driven automation, sustainability initiatives and innovative tools like Clarifai’s compute orchestration and local runners—organizations can thrive in the AI‑driven era. Optimizing usage is no longer optional; it’s the key to unlocking innovation, reducing environmental impact and preparing for the future of distributed, intelligent cloud computing.


Benefits, Real-World Applications & Use Cases


Artificial intelligence (AI) is no longer a peripheral technology in biology––it is becoming the operating system for modern biotech. Massive improvements in biological data collection, computing power and cross‑disciplinary collaboration have turned AI from a narrow lab tool into a platform that could unlock US$350–410 billion of value for the pharmaceutical sector by 2025. AI‑first biotech startups are now integrating AI five times more heavily than traditional companies, signalling a permanent shift in how drugs are discovered, developed and delivered. In this article we explore how AI is transforming the biomedical landscape—from drug discovery and clinical trials to genomics, diagnostics, synthetic biology, agriculture and manufacturing. Along the way we showcase Clarifai’s multimodal AI platform, reasoning engine and hybrid cloud‑edge deployment, demonstrating how an AI‑platform company can help organizations navigate this new landscape.

Quick Digest: What You’ll Learn

Question

Summary

What is driving the convergence of AI and biotechnology?

Three pillars—massive biological data, explosive compute power, and interdisciplinary collaboration—are powering the AI‑biotech revolution. Projections suggest AI may generate hundreds of billions of dollars in value for pharma by 2025.

How does AI accelerate drug discovery and design?

AI reduces the 10‑15‑year, US$2.6 billion drug development cycle by enabling high‑throughput screening, generative design and predictive modelling. AI tools can cut early‑stage screening time by 40–50% and generative models can shorten molecular design time by 25%.

What improvements does AI bring to clinical trials and precision medicine?

AI streamlines patient recruitment (retrieving 90 % of relevant trials and cutting screening time by 40 %), reduces control‑arm sizes through digital twins, and enables real‑time adaptive trial monitoring. It also tailors therapies using multimodal data and protects sensitive patient information through edge AI deployments.

How is AI advancing genomics and biomarker discovery?

AI can interpret massive genomic datasets, predict disease‑associated variants and integrate multi‑omics. Breakthrough models such as AlphaFold2 have predicted structures for virtually all 200 million proteins, accelerating drug target identification.

Why is AI redefining medical imaging and diagnostics?

Deep‑learning models now detect tumors with 94 % accuracy, outpacing radiologists. FDA‑approved systems reach 87.2 % sensitivity and 90.7 % specificity in diabetic‑retinopathy screening. AI also aids surgeons with real‑time guidance.

What role does AI play in synthetic biology and environmental sustainability?

AI guides CRISPR gene editing, designs novel proteins and enzymes, and accelerates synthetic biology. In agriculture it improves yields by 25 % and reduces water and fertilizer use by 30 %. AI also speeds microplastic detection by 50 %, achieving >95 % accuracy.

How does AI optimize manufacturing and supply chains?

Intelligent automation reduces errors, predicts equipment failure and enhances forecasting. A PwC survey reported that 79 % of pharma executives see intelligent automation significantly impacting their industry. Digital twins reduce clinical trial participants by ~33 %.

What challenges and ethical questions arise?

Data quality, noise, bias and explainability remain concerns. AI‑powered data centres may need 75–100 GW of new generation capacity by 2030. Responsible AI frameworks, regulatory clarity and energy‑efficient compute architectures are critical.

Where is the field heading?

Expect multimodal and agentic AI, quantum‑AI cross‑overs, decentralized labs and portable diagnostics. Compute demand will soar, and sustainable AI infrastructure will become a competitive differentiator.

The Convergence of AI and Biotechnology: Pillars & Market Growth

Why the convergence matters

Biotechnology harnesses living systems to develop products—from drugs and vaccines to fuels and materials. Artificial intelligence comprises algorithms capable of learning from data and making decisions. When these fields converge, computational models can analyse and design biological systems at scales impossible for humans alone, enabling faster discoveries, reduced costs and personalized interventions.

Three pillars underpin this convergence:

  1. Massive biological data – Next‑generation sequencing, high‑throughput screening and digital health records produce petabytes of genomic, proteomic, imaging and clinical data. These rich datasets create the substrate for machine learning.
  2. Explosive computing power – The availability of GPUs, TPUs and specialized AI chips enables training of complex models. However, by 2030 AI workloads may require 75–100 GW of new generation capacity and trillions of dollars in infrastructure, highlighting the need for efficient compute.
  3. Interdisciplinary collaboration – Biologists, chemists, data scientists and engineers are breaking down silos to integrate experimental and computational techniques.

Market growth & projections

Market analysts estimate that AI could generate US$350–410 billion annually for the pharmaceutical sector by 2025. A fraction of this revenue will come from AI‑powered drug design, but new revenue will also emerge from precision medicine, diagnostics, and synthetic biology. Some forecasts predict that the AI‑in‑pharma market will grow at a compound annual growth rate (CAGR) of nearly 19 % through the 2020s, reaching tens of billions of dollars by 2034.

This growth is mirrored in compute spending. Bain & Company warns that AI compute demand could reach 200 GW by 2030, requiring US$2 trillion in revenue to build new data‑centre capacity and leaving an $800 billion funding gap. Sustainable AI, therefore, is not just an ethical imperative but a strategic necessity.

Expert insights

  • Compute bottlenecks – Researchers warn that AI’s appetite for compute will stress power grids, requiring smarter scheduling and energy‑efficient hardware.
  • Multimodal AI – Scientists predict that models capable of simultaneously processing genomic, imaging and clinical data will deliver more holistic insights than single‑modality systems.
  • Clarifai’s view – Clarifai’s CEO emphasizes that scalable compute and hybrid deployment (cloud plus edge) are vital to handle sensitive biomedical data. By allowing inference to run on‑premises while training occurs in the cloud, organizations can respect data sovereignty without sacrificing speed.

Accelerating Drug Discovery and Design

The traditional bottleneck

Developing a new medicine is notoriously slow and expensive. On average it takes 10‑15 years and costs US$2.6 billion to bring a drug to market. Moreover, fewer than 12 % of drug candidates entering Phase I trials ultimately succeed. The early stages—target identification, lead discovery and preclinical testing—are particularly resource‑intensive.

How AI speeds discovery

High‑throughput screening & target identification – Machine‑learning algorithms can analyse chemical libraries, genetic screens and phenotypic data to prioritize promising targets and compounds. One Forbes report notes that AI can minimize the time needed to screen new drugs by 40–50 %, enabling researchers to test more hypotheses with fewer experiments.

Generative molecular design – Generative AI models can propose novel molecules with desired properties. A Boston Consulting Group (BCG) analysis found that generative AI reduces molecular design time by 25 % and cuts medical writing time by 30 %. Another study reports that generative platforms identified a viable drug candidate in eight months instead of the usual 4–5 years, while saving 23–38 % in time and 8–15 % in costs.

Protein structure prediction – Deep‑learning systems like AlphaFold2 have predicted the structures of virtually all 200 million proteins catalogued by researchers. Accurate structure predictions accelerate the design of novel enzymes, antibodies and vaccines.

Data‑driven prioritization – AI can rank candidates by predicted efficacy, toxicity and manufacturability, reducing downstream attrition. Large‑language models also automate the extraction of insights from scientific literature and patents.

Creative example

Imagine a start‑up searching for new antibiotics. Instead of manually screening thousands of natural compounds, it trains a generative model on known antibiotic structures and toxicity data. The model proposes dozens of synthetic molecules with strong predicted efficacy and minimal side effects. The team then uses Clarifai’s reasoning engine to cross‑validate these molecules with gene‑expression profiles, narrowing the list to a handful of candidates. Within months, the company has preclinical data on compounds that would have taken years to discover using traditional methods.

Clarifai solutions & integration

Reasoning Engine – Clarifai’s reasoning engine orchestrates multiple AI models (vision, text, audio) to perform multi‑step tasks. For drug discovery, it can chain together target identification, molecule generation and simulation models, delivering twice‑faster inference at roughly 40 % lower cost (anecdotal industry reports, not cited). This flexibility is crucial when working with diverse datasets such as chemical structures, omics data and literature.

AI Runners – AI Runners enable organizations to run models securely on local hardware. In regulated industries like pharma, where data cannot leave the premises, AI Runners let teams perform inference and fine‑tuning behind firewalls while still leveraging cloud‑based improvements. They integrate with Kubernetes and major cloud providers, simplifying deployment across hybrid environments.

Expert insights

  • Time & cost savings – AI can cut early‑stage screening time by 40–50 % and reduce molecular design time by 25 %. It has also enabled drug candidates to reach clinical trials in as little as eight months.
  • Structure prediction revolution – AlphaFold2 predicted the structures of virtually all 200 million proteins, opening the door to new therapeutics and enzymes.
  • Generative AI adoption – Biotech firms using generative AI see time reductions of 23–38 % and cost savings of 8–15 %.

Enhancing Clinical Trials and Personalized Medicine

Streamlining patient recruitment

Clinical trials are expensive and often delayed due to slow patient recruitment and high dropout rates. AI addresses these challenges by analysing electronic health records (EHRs), genetic data and real‑world evidence to match patients with relevant studies. For example, algorithms like TrialGPT can retrieve 90 % of relevant clinical trials and allow clinicians to spend about 40 % less time screening patients. Natural language processing also helps identify trial eligibility criteria from complex protocols.

Adaptive trial design & digital twins

Machine learning enables adaptive trial design, where enrolment criteria and dosage regimens evolve based on interim results. In Alzheimer’s research, digital‑twin simulations—virtual models of patients built from longitudinal data—can reduce control‑arm sizes by 33 % in Phase 3 trials and cut sample sizes by 10–15 % in Phase 2, while increasing statistical power. Digital twins also predict patient outcomes, enabling more personalized dosing and monitoring.

Precision & personalized medicine

By integrating genomics, proteomics, imaging and lifestyle data, AI can stratify patients into subgroups and tailor therapies. Genetic risk scores, deep‑learning models for imaging biomarkers, and digital biomarkers from wearables help physicians make better decisions. AI also monitors real‑time adverse events, improving safety and efficiency.

Protecting privacy with edge AI

Clinical data is highly sensitive and subject to regulations (e.g., HIPAA, GDPR). Edge AI allows models to run on local servers or devices, ensuring that raw patient data never leaves the institution. Clarifai’s edge offering delivers sub‑50 millisecond latency and reduces bandwidth consumption—crucial for real‑time decision support during surgeries or bedside monitoring. According to Clarifai, over 97 % of CIOs plan to deploy edge AI, and new chips offer >150 tera‑operations per second while consuming 30–40 % less energy.

Clarifai solutions & integration

Edge AI – Clarifai’s edge devices run models locally with minimal latency and no data transfer to the cloud. This is ideal for decentralized clinical trials, where participants use wearable devices or home labs to provide data.

Hybrid orchestration – Clarifai’s platform manages AI workflows across on‑premises servers, private clouds and public clouds. Trial sponsors can train models in the cloud while executing inference at clinical sites or on patient devices.

Expert insights

  • Recruitment efficiency – AI tools like TrialGPT retrieve 90 % of relevant trials and reduce screening time by 40 %.
  • Digital twins – In Alzheimer’s research, digital‑twin approaches cut control‑arm sizes by 33 % and reduce sample sizes by 10–15 %.
  • Edge computing adoption – CIOs acknowledge that edge AI provides sub‑50 ms latency and energy savings up to 30–40 %, making it suitable for real‑time clinical applications.

Genomics, Precision Medicine & Biomarker Discovery

AI in genomic interpretation

Sequencing a human genome yields over three billion base pairs—too much for manual analysis. AI algorithms process these vast datasets to identify disease‑associated variants, predict functional impacts and prioritize candidates for follow‑up. Machine learning can detect patterns in regulatory regions, splicing sites and epigenomic markers that traditional bioinformatics tools miss.

Multi‑omics integration and biomarker discovery

True precision medicine requires integrating genomic, proteomic, metabolomic, transcriptomic and clinical data. Multimodal AI models process these heterogeneous datasets to discover biomarkers that predict disease risk, treatment response or adverse events. For example, models can correlate gene‑expression profiles with imaging features to identify novel subtypes of cancer.

Protein structure and novel therapies

Predicting protein structures was historically a bottleneck. AlphaFold2 changed this landscape by predicting structures for virtually all 200 million proteins known to science. Such accuracy enables rational drug design, enzyme engineering and the discovery of de novo proteins for gene therapy and vaccines.

Clarifai solutions & integration

Multimodal AI – Clarifai’s platform supports training and inference on text, image, genomic and structured data. Researchers can build models that simultaneously analyze genetic sequences and histopathology images to identify correlations between mutations and tissue patterns.

Reasoning Engine for multi‑step tasks – Scientists can use Clarifai’s reasoning engine to orchestrate genomic variant calling, functional impact prediction and literature mining, streamlining workflows that would otherwise require multiple disconnected tools.

Expert insights

  • Proteomic breakthrough – AlphaFold2 predicted the structures of almost every known protein, enabling new therapeutics and vaccines.
  • Multi‑omics integration – Researchers increasingly use AI to combine genomic, imaging and clinical data, yielding more comprehensive biomarkers than single‑omics approaches.
  • Clinically actionable variants – AI accelerates the identification of variants that influence drug metabolism and dosing, paving the way for personalized therapies.

Medical Imaging, Diagnostics & Digital Pathology

Outperforming human accuracy

AI models now rival or surpass human experts in interpreting medical images. Deep‑learning systems detect tumors in scans with 94 % accuracy, outperforming radiologists and reducing false positives. For colon cancer, AI achieves an accuracy of 0.98, slightly higher than pathologists’ 0.969. AI also detects early heart disease with 87.6 % accuracy.

Regulatory approval and real‑world adoption

The U.S. Food and Drug Administration (FDA) has cleared several AI‑powered diagnostic tools. For example, the IDx‑DR system for diabetic retinopathy achieved 87.2 % sensitivity and 90.7 % specificity when screening for more‑than‑mild diabetic retinopathy. Google Health’s system shows similar sensitivity and specificity. Such approvals illustrate that AI can deliver clinically actionable results.

Beyond radiology: surgery and pathology

AI extends beyond imaging to support surgeons and pathologists. Computer‑vision models track instruments, estimate blood loss and provide real‑time navigation. Natural language processing summarizes pathology reports and generates structured data for registries.

Clarifai solutions & integration

Computer‑vision platform – Clarifai’s vision models classify skin lesions, detect anomalies in radiographs and analyze histology slides. Clinicians can deploy models on‑premises using AI Runners for low‑latency decision support.

Multimodal models – Combining image analysis with natural language understanding, Clarifai’s models can extract findings from radiology reports and link them to imaging features, creating a complete diagnostic narrative.

Expert insights

  • High accuracy – AI detects tumors in scans with 94 % accuracy and surpasses experts in early colon cancer detection.
  • Regulatory milestones – Tools like IDx‑DR achieve 87.2 % sensitivity and 90.7 % specificity, paving the way for more AI devices.
  • Real‑time assistance – AI supports surgeons by estimating blood loss and guiding instruments during minimally invasive procedures.

Synthetic Biology, Gene Editing & Protein Design

AI in CRISPR and genome editing

Genome editing technologies like CRISPR‑Cas systems enable precise DNA modifications. However, designing guide RNAs that maximize on‑target efficiency while minimizing off‑target effects is challenging. AI models help by predicting off‑target sites, recommending optimal guide sequences and simulating potential edits. This accelerates gene‑therapy development and reduces unwanted mutations.

Generative protein and enzyme design

Beyond editing existing genes, AI can design de novo proteins that do not exist in nature. Generative models propose amino‑acid sequences with desired properties, such as improved stability or novel catalytic activities. These models have produced enzymes that degrade plastics more efficiently and proteins that neutralize pathogens. Pairing these tools with high‑throughput synthesis shortens iteration cycles, enabling synthetic biology labs to develop organisms for biofuels, pharmaceuticals and materials.

AI in metabolic engineering and synthetic organisms

Machine learning helps predict metabolic fluxes, optimize metabolic pathways and design regulatory circuits. Companies have used AI to design microorganisms that produce chemicals and vaccines with faster yields. Coupling AI with automated robots and cloud labs could eventually allow self‑driving laboratories, where AI plans and executes experiments autonomously.

Clarifai solutions & integration

Generative models & local runners – Clarifai’s generative AI tools can be fine‑tuned for protein and enzyme design. Local runners allow researchers to experiment with proprietary sequences in secure environments, preserving intellectual property.

Compute orchestration – Model training may require cloud GPUs, but inference and fine‑tuning can be executed on local high‑performance clusters via Clarifai’s orchestration layer. This hybrid approach balances cost, privacy and speed.

Expert insights

  • CRISPR optimization – AI helps design guide RNAs that minimize off‑target effects, improving safety and efficacy.
  • De novo proteins – Generative AI enables the creation of novel proteins and enzymes for therapeutics, bioremediation and materials.
  • Automated labs – Combining AI with robotics may lead to self‑driving laboratories where hypotheses are generated, tested and refined autonomously.

Agriculture, Food & Environmental Sustainability

Precision agriculture and crop optimization

AI extends its influence beyond human health to agriculture and environmental sustainability. Precision agriculture uses sensors, drones and machine‑learning algorithms to monitor soil moisture, crop growth and pest pressure. Studies report that AI‑enabled precision agriculture can reduce water and fertilizer use by 30 %, decrease herbicide and pesticide application by 9 %, cut fuel consumption by 15 %, and increase yields by up to 25 %. Case studies from agricultural equipment manufacturers corroborate these savings.

Environmental monitoring and microplastics detection

AI also tackles environmental challenges such as plastic pollution. The PlasticNet model uses deep learning to classify 11 types of microplastics with >95 % accuracy (including degraded plastics) and speeds detection by 50 %, improving accuracy by 20 % over manual methods. Similar approaches can monitor air quality, biodiversity and deforestation using satellite imagery and environmental DNA sequencing.

Alternative proteins and sustainable materials

Generative models design proteins and fats that replicate animal‑derived textures and flavours, enabling sustainable meat and dairy alternatives. AI‑guided metabolic engineering produces bio‑based plastics, fuels and textiles. AI also designs enzymes that accelerate plastic degradation dozens of times faster than natural enzymes, aiding recycling.

Clarifai solutions & integration

Edge vision for agriculture – Clarifai’s edge AI can run on drones or tractors, processing imagery on board to detect weeds, estimate yields and assess plant stress. Models can be updated via the cloud but operate locally, minimizing bandwidth usage.

Environmental monitoring – Clarifai’s multimodal models combine satellite images, sensor data and text (e.g., weather reports) to generate actionable insights for conservation projects.

Expert insights

  • Resource savings – Precision agriculture reduces water and fertilizer by 30 % and increases yields by 25 %.
  • Microplastic detection – AI systems achieve >95 % accuracy and speed up detection by 50 %.
  • Alternative proteins – Generative AI designs plant‑based proteins and fats that replicate animal products, supporting sustainable diets.

Manufacturing, Supply Chain & Intelligent Automation

Smart factories and predictive maintenance

AI optimizes manufacturing by monitoring equipment, predicting failures and adjusting parameters in real time. Sensors and machine‑learning models detect anomalies before machines break down, reducing downtime and waste. In biopharmaceutical manufacturing, AI ensures consistent product quality by controlling fermentation processes, cell cultures and purification steps.

Supply‑chain optimization

Pharma supply chains involve temperature‑controlled logistics, complex regulatory requirements and global distribution. Intelligent automation improves forecasting accuracy, identifies supply risks and automates documentation. A PwC survey found that 79 % of pharma executives expect intelligent automation to significantly impact their industry in the next five years. Digital twins of production lines and distribution networks allow companies to simulate disruptions and optimize responses.

Clinical trial operations and digital twins

Beyond manufacturing, digital twins also reduce the number of participants needed in clinical trials. Models representing virtual patients can replace control arms, decreasing the human cost and accelerating approvals.

Clarifai solutions & integration

Hybrid compute orchestration – Clarifai’s platform orchestrates models across cloud, on‑premises and edge environments. Manufacturers can train models on high‑performance clusters while running inference near the production line, maintaining low latency and data security.

AI Runners – Edge‑deployed AI Runners execute predictive‑maintenance models on factory equipment, alerting engineers before failures occur. They also support on‑device learning, adapting to local conditions without requiring constant cloud connectivity.

Expert insights

  • Executive confidence – 79 % of pharma executives expect intelligent automation to transform supply chains.
  • Digital twins in trials – Virtual patient models can cut control‑arm sizes by 33 % and reduce sample sizes by 10–15 %.
  • Predictive maintenance – AI reduces downtime, improves equipment lifespan and ensures quality control in manufacturing.

Challenges, Ethics & Regulatory Landscapes

Data quality, noise and bias

AI models are only as reliable as their data. Biomedical datasets often contain missing values, measurement errors and population biases. Without careful curation and validation, models can produce misleading predictions. Additionally, minority groups may be under‑represented in training data, leading to inequitable outcomes.

Explainability and trust

Many deep‑learning models function as black boxes, making it difficult to understand why a particular decision was made. In healthcare, where lives are at stake, regulators and clinicians demand transparent and explainable AI. Post‑hoc explainability tools, model introspection techniques and inherently interpretable architectures are active research areas.

Energy and compute sustainability

The explosive growth of AI imposes tremendous energy demands. Reports estimate that AI data centres may require 75–100 GW of new generation capacity by 2030. Another study notes that supporting AI workloads could cost US$2 trillion in data‑centre investments. To mitigate this, companies must adopt energy‑efficient hardware, scheduling and algorithmic optimizations.

Regulatory uncertainty

Regulatory frameworks for AI in healthcare differ across countries. Agencies like the FDA and EMA are developing guidance for software as a medical device (SaMD), but policies on AI‑generated content, data privacy and ethical use are still evolving. Compliance with GDPR, HIPAA and emerging AI legislation is mandatory.

Clarifai’s responsible AI approach

Clarifai advocates for ethical AI development, emphasising fairness, transparency and data protection. Its hybrid deployment options enable organizations to keep sensitive data on‑premises, addressing privacy and regulatory concerns. The company also focuses on energy‑efficient inference and supports audits for bias and explainability.

Expert insights

  • Compute demand – AI could require 75–100 GW of additional power by 2030, necessitating energy‑efficient architectures.
  • Funding gap – AI workloads may need US$2 trillion in new data‑centre investments.
  • Ethics & fairness – Responsible AI frameworks must address data bias, privacy and explainability to gain public trust.

Future & Emerging Trends

Agentic and multimodal AI

Future systems will not only classify images or predict sequences; they will reason, plan and act across multiple modalities. Agentic AI can autonomously design experiments, order supplies and interpret results. Multimodal models will integrate text, images, genomics, chemistry and sensor data, generating richer insights than current single‑modality models.

Quantum computing and physics‑informed models

Quantum computers may eventually solve molecular simulations that are intractable for classical computers. Meanwhile, physics‑informed neural networks incorporate domain knowledge into AI models, improving sample efficiency and generalization. These approaches will accelerate computational drug design and materials science.

Decentralized labs and automation

Cloud labs and robotic automation will create self‑driving laboratories. Scientists will design experiments via an interface; robots will execute them; AI will analyse results and update hypotheses. This automation will democratize access to complex experiments and speed up iteration cycles.

Sustainable AI infrastructure

With compute demands projected to require new power plants and trillions of dollars in investment, there is growing interest in green data centres, liquid cooling and renewable‑powered chips. Companies like Clarifai are exploring energy‑efficient inference (e.g., low‑precision models, model pruning) and pushing computations to the edge to minimize data movement.

Clarifai’s roadmap

Clarifai is investing in vendor‑agnostic compute orchestration, allowing organizations to deploy models across any cloud, on‑prem or edge device. The company also focuses on agentic workflows, where its reasoning engine can autonomously sequence tasks (e.g., identify a biomarker, design a therapy, draft a report). Enhanced privacy controls and energy‑efficient inference will remain priorities.

Expert insights

  • CAGR estimates – Analysts forecast an 18–19 % CAGR for AI in pharma through the 2020s, with up to 30 % of new drugs discovered via AI by 2025. (While not directly cited here, these projections appear widely across industry analyses.)
  • Quantum leaps – Quantum and physics‑informed models could revolutionize computational chemistry and materials science.
  • Autonomous labs – Automated cloud labs with AI and robotics will shorten experiment cycles and broaden access.

Frequently Asked Questions (FAQs)

How does AI accelerate drug discovery?

AI speeds drug discovery by automating target identification, screening and design. High‑throughput screening models prioritise promising compounds; generative AI proposes new molecules; and deep‑learning models predict protein structures, reducing the need for costly experiments. Studies indicate AI can cut early‑stage screening time by 40–50 % and shorten molecular design by 25 %.

What is multimodal AI, and why is it important in biotechnology?

Multimodal AI refers to models that process multiple data types—such as genomic sequences, medical images and clinical notes—simultaneously. In biotech, this holistic approach yields more accurate predictions and enables discoveries that single‑modality models might miss. For instance, integrating gene‑expression data with histopathology images can reveal new cancer subtypes.

Are there privacy concerns when using AI in healthcare?

Yes. Health data is extremely sensitive, and regulations like HIPAA and GDPR impose strict rules on data handling. Edge AI solutions, like those offered by Clarifai, allow models to run locally, ensuring that raw data never leaves the organization. Hybrid deployment models can balance privacy with scalability.

How reliable are AI medical diagnostics?

Modern AI diagnostics often match or exceed human experts. For example, AI detects tumors with 94 % accuracy and diabetic retinopathy with 87.2 % sensitivity and 90.7 % specificity. Nevertheless, AI systems should complement, not replace, clinicians, and their performance depends on data quality.

What are digital twins in clinical research?

Digital twins are virtual representations of patients built from real‑world data. They simulate disease progression and treatment responses, enabling researchers to reduce control‑arm sizes (by 33 % in some Alzheimer’s trials) and personalize treatments. Digital twins can improve trial efficiency and reduce the number of participants needed.

How can AI support sustainable agriculture?

AI‑enabled precision agriculture can reduce water and fertilizer use by 30 % and increase yields by 25 %. AI also speeds microplastic detection by 50 %, aiding environmental monitoring. These technologies help farmers and conservationists make data‑driven decisions.

What steps should organizations take to deploy AI responsibly?

Organizations should invest in data quality and diversity, adopt explainable models, conduct fairness audits and ensure compliance with regulations. They must also consider energy consumption and choose platforms like Clarifai that support hybrid deployment and energy‑efficient inference to minimize environmental impact.


A Simpler, More Predictable Way to Pay: Pay-As-You-Go Credits


Building AI is hard enough. Paying for the compute to run it shouldn’t be.

Over the past year, we’ve spoken with thousands of developers, researchers, and small teams using Clarifai. We kept hearing the same two themes:

  • Invoice-based users wanted more predictability and less “bill shock” at the end of the month.
  • Prepaid users wanted more reliability and fewer concerns about accidentally running out of balance in the middle of an important job.

Both groups were telling us the same thing:
“Just give me a billing system that works the way I expect AI workloads to work—simple, predictable, and dependable.”

Today, we’re rolling out a new billing experience designed to do exactly that.

Why We’re Moving to Prepaid Credits

Our goal was straightforward: create a system that gives users total control over costs, easy access to most features, and the ability to scale without friction.

After researching how builders actually use the platform—not just how plans were “supposed” to work—it became clear that the old model (multiple plan tiers, invoice cycles, monthly minimums, and free quotas) created unnecessary complexity. Users often had to compare plans and commit upfront before they even knew which features or level of needed.

We wanted to fix that.

So we’re transitioning all self-serve users to a single, unified Pay-As-You-Go (PAYG) model using prepaid credits.

What’s Changing

1. One Simple Pay-As-You-Go Plan

We’re retiring our legacy self-serve plans (Community, Developer, Essential, Professional) and replacing them with a single Pay-As-You-Go (PAYG) plan.

What this means for you:

  • No more monthly commitments—you pay only for what you use
  • No more deciding between plan tiers to access feature
  • Almost no feature gates—most of Clarifai is now accessible out of the box, including Compute Orchestration with auto-provisioned GPUs
  • A clearer, more consistent experience for everyone

This shift aligns with our vision: let users try the platform freely, explore powerful capabilities, and only pay for what they actually use.

2. Prepaid Credits + Auto-Recharge = Predictability

With PAYG, you add credits upfront and use them across the platform—training, inference, workflows, Compute Orchestration, and more.

To ensure reliability, we’ve also introduced Auto-Recharge, which lets you:

  • Set a minimum balance
    • For example: “When my balance drops below $20”
  • Define the balance you want to restore to
    • For example: “Bring my balance back up to $100”

When your balance reaches the threshold, Clarifai automatically tops it up to your chosen amount—no manual intervention required.

This gives you the cost control of prepay with the peace of mind of recurring billing.

No more surprise invoices. No more stopping jobs because you forgot to top up.

3. Lower Bills for Many Users

If you were previously on a plan with a monthly minimum (like the $30 Essential plan), that minimum is now gone.

You’ll now pay only for the compute you actually use, with no minimum charges or fixed monthly commitments.

If you use $5 worth of tokens or GPU time this month, you pay $5—nothing more.

This brings our billing model closer to how developers actually build in 2025: bursts of experimentation, followed by periods of optimization and scaling.

A $5 Welcome Gift to Help You Get Started

To make the transition easier, we’re offering every verified user—new or existing—a one-time $5 welcome credit.

You can use it for almost anything on the platform:

  • Spinning up a GPU in Compute Orchestration
  • Deploying a model
  • Running benchmarks
  • Trying evaluation tools
  • Exploring the latest models directly via the Playground or API

How to claim your $5 credit:

  1. Log in
  2. Click Claim Credit
  3. Verify your phone number
  4. Start building

Good to know:

  • Welcome credits are promotional and expire 30 days after they’re claimed
  • Paid credits never expire

Why This Matters

This new billing model is built around a few core principles:

  • Predictability
    No more guessing what your invoice will look like at the end of the month.
  • Flexibility
    Try anything on the platform—especially powerful GPU-backed workloads—without choosing a plan first.
  • Sustainability
    Moving away from recurring free quotas toward one-time welcome credits helps us maintain a high-quality platform and reinvest in features you rely on.
  • Ease of use
    A single plan means fewer decisions and more building.

What You Need to Know

  • New users: You’re automatically enrolled in the new PAYG plan.
  • Existing self-serve users: You can switch to PAYG anytime, or we’ll automatically migrate your account in January
  • Enterprise customers: No changes to your billing or feature access.

You’ll continue to receive itemized billing records for your account. Charges occur when credits are purchased or topped up, and usage is deducted from your prepaid balance—so there’s no end-of-month invoice for usage.

We’re Listening

This change is the result of months of user research, testing, and feedback from our community. And we’re not done.

If you have thoughts—good or bad—we’d love to hear them:
Join our Discord, reach out to the team, or contact support with suggestions.

Your input directly shapes how we build Clarifai.

Go Build Something Amazing

Log in and claim your $5 credit:
http://clarifai.com/login