Visual Studio Code 1.115


Follow us on LinkedIn, X, Bluesky |


Last updated: April 3, 2026

Welcome to the 1.115 release of Visual Studio Code.

Happy Coding!


April 2, 2026

  • Enable showing test coverage indicators in the minimap. #258961

  • Add support for pasting files (for example, images) into the terminal by using Ctrl+V, drag-and-drop, and right-click paste. #301603

  • Background terminals automatically notify the agent when commands complete, including the exit code and terminal output. Prompts for input in background terminals are also detected and surfaced to the user. #307201

  • Add support for pinch-to-zoom gestures on Mac in the integrated browser. #307267

  • Update code serve-web CLI command to support --disable-telemetry, --default-folder, and --default-workspace options. #192230

April 1, 2026

  • The Copilot status bar entitlements and usage information is available in Sessions. #306462

  • Add support for connecting to remote machines over SSH, automatically installing the CLI and starting it in agent host mode. #306196

  • Track and restore file edits in agent sessions, delivering diffs, undo/redo, and state restoration for customizations made during a session. #305332

March 31, 2026

  • Chat can now track and link to browser tabs that were opened or interacted with during a session, so agents can reference open web pages. #306537

  • The send_to_terminal tool lets agents send commands to background terminals with user confirmation, fixing an issue where run_in_terminal with a timeout would move terminals to the background and make them read-only. #305909

  • Rename agent sessions from the client side via a new client-to-server rename capability in the Agent Host Protocol. #305318

  • Open web pages now show their favicons in the Go to File quick pick list, matching the favicon display on browser tab labels. #299792


We really appreciate people trying our new features as soon as they are ready, so check back here often and learn what’s new.

Bookmark Studio: evolving bookmarks in Visual Studio


Bookmarks in Visual Studio have always been a simple, reliable feature. Many developers use them regularly, and over the years we’ve heard consistent feedback from those users. Bookmarks were useful, but there were a few core gaps that kept them from being as effective and relevant as they could be.

Navigation was one of the biggest pain points. You could move between bookmarks, but there was no easy way to jump directly to a specific bookmark using the keyboard. That made bookmarks harder to rely on once you had more than a few. Another common request was sharing. Bookmarks worked well for personal, local navigation, but there was no good way to share them with teammates or reuse them across repos, branches, or pull requests.

That feedback is what led to Bookmark Studio, a new experimental Visual Studio extension that builds on the existing bookmark experience by filling in those missing pieces, without changing how bookmarks fundamentally work.

Faster, more intentional navigation

One of the core additions in Bookmark Studio is slot‑based navigation.

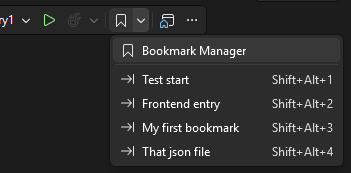
Bookmarks can be assigned to slots 1 through 9 and jumped to directly using simple keyboard shortcuts like Alt+Shift+1 through Alt+Shift+9. This makes bookmarks feel more deliberate and easier to rely on when you want fast access to a handful of important locations.

Toolbar

New bookmarks are automatically assigned the next available slot when possible, so fast navigation often works without any extra setup. Bookmark Studio also integrates with Visual Studio’s existing bookmark commands, which means your current shortcuts and muscle memory continue to work as expected.

A single place to work with bookmarks

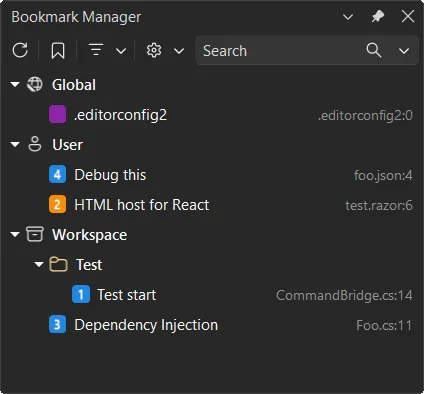
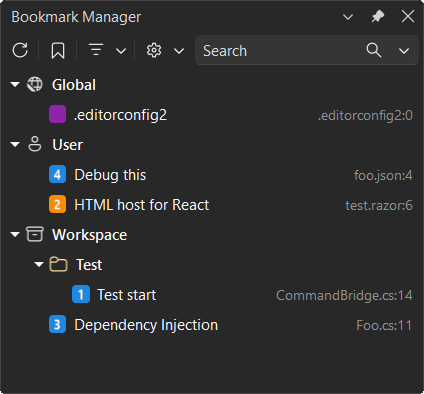
Bookmark Studio also adds a dedicated Bookmark Manager tool window.

Tool window

The manager shows all bookmarks in one place and makes it easy to browse, search, and navigate between them. You can filter by name, file, location, color, or slot, and jump directly to a bookmark with a double‑click or keyboard navigation. It’s designed to make bookmarks easier to revisit, especially when switching context or coming back to code later.

Optional structure, when you need it

Another piece of feedback we heard was the need for just a bit more organization.

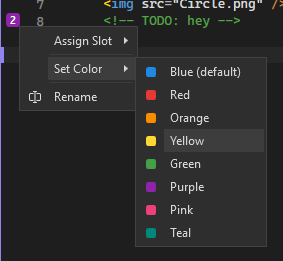
With Bookmark Studio, bookmarks can have labels, colors, and folders. None of this is required, and you can keep using bookmarks exactly as you do today. But when you’re debugging, refactoring, reviewing code, or exploring unfamiliar areas of a codebase, that extra context can make bookmarks more useful and easier to reason about.

Glyphs

All bookmark metadata is stored per solution, so it stays with your work across sessions.

Bookmarks you can share and reuse

Bookmarks are often most valuable when they capture intent, not just location.

Bookmark Studio makes it easy to export bookmarks as plain text, Markdown, or CSV. That means you can include bookmarks in pull requests, share investigation paths with teammates, or move useful bookmark sets between repos. Instead of being a purely personal tool, bookmarks can become a lightweight way to communicate context and decisions.

Bookmarks that stay put as code changes

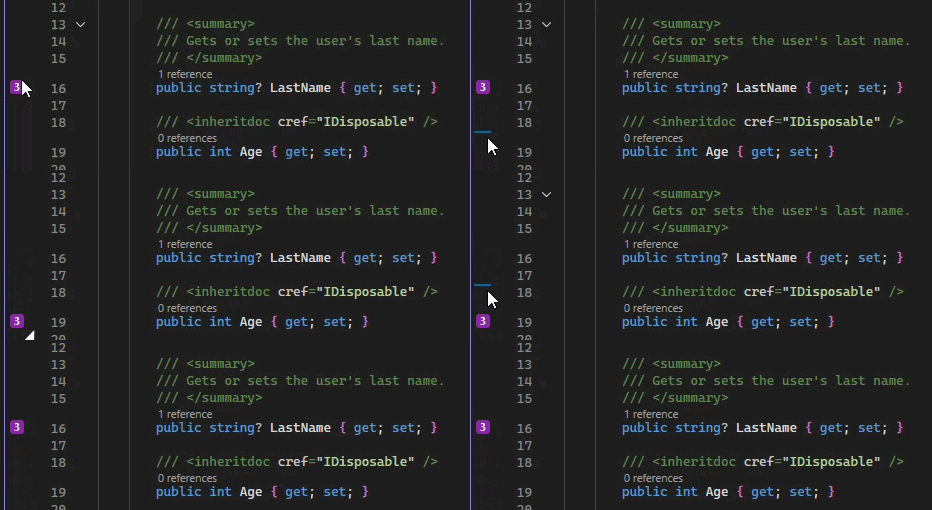
Bookmark Studio tracks bookmarks as text moves during editing, so they stay attached to the relevant code instead of drifting to the wrong line. This makes bookmarks more dependable during active development, especially when files are changing frequently.

Drag and drop of glyph

A focused improvement, not a reinvention

Bookmark Studio doesn’t try to replace tasks, TODO comments, or issue tracking. It doesn’t introduce a new workflow you have to learn. Instead, it fills in the gaps that many bookmark users have pointed out over time, making bookmarks easier to navigate, easier to share, and more useful as part of everyday development.

If you already use bookmarks in Visual Studio, Bookmark Studio should feel familiar within minutes. And if you’ve ever wished bookmarks could do just a little more, this extension is worth a look.

You can download Bookmark Studio today from the Visual Studio Marketplace. As always, feedback and pull requests are welcome on the GitHub repo.

Visual Studio March Update – Build Your Own Custom Agents


This month’s Visual Studio update gives you new ways to customize GitHub Copilot. Custom agents allow you to build specialized Copilot agents tailored to your team’s workflow, backed by the tools and knowledge sources that matter to your project. Alongside that, agent skills bring reusable instruction sets, and a new find_symbol tool gives agents language-aware navigation across your codebase.

Beyond agents, we’re continuing to invest in the diagnostics experience with Copilot-powered profiling directly from Test Explorer and real-time perf tips during debugging. Security gets a boost too, with Copilot now helping you fix NuGet vulnerabilities right from Solution Explorer.

Download Visual Studio 2026 Insiders to try these features today.

Build your own custom agents

Want Copilot to follow your team’s coding standards, run your build pipeline, or query your internal docs? Custom agents make that possible. They’re specialized Copilot agents defined as .agent.md files in your repository, with full access to workspace awareness, code understanding, tools, your preferred model, and MCP connections to external knowledge sources.

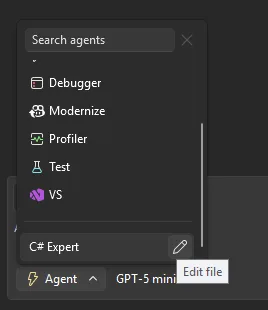
Drop an .agent.md file into .github/agents/ in your repo, and it shows up in the agent picker ready to use.

vs18 4 custom agents image

A few things to keep in mind: if you don’t specify a model, the agent uses whatever you’ve selected in the model picker. Tool names can vary across GitHub Copilot platforms, so check the tools available in Visual Studio to make sure your agent works as expected. The awesome-copilot repo has community-contributed agent configurations you can use as starting points.

Use agent skills

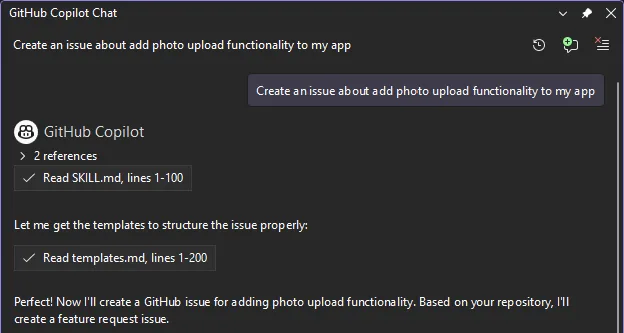
Skills are picked up automatically from several locations in your repository (such as .github/skills/) or your user profile (such as ~/.copilot/skills/). Each skill lives in its own directory with a `SKILL.md` file that follows the Agent Skills specification. When a skill is activated, it appears in the chat so you know it’s being applied.

vs18 4 agent skills image

Check out the awesome-copilot repo for community-shared skills, and look for more user-friendly flows for browsing and creating skills inside Visual Studio in upcoming releases.

Find_symbol tool for agent mode

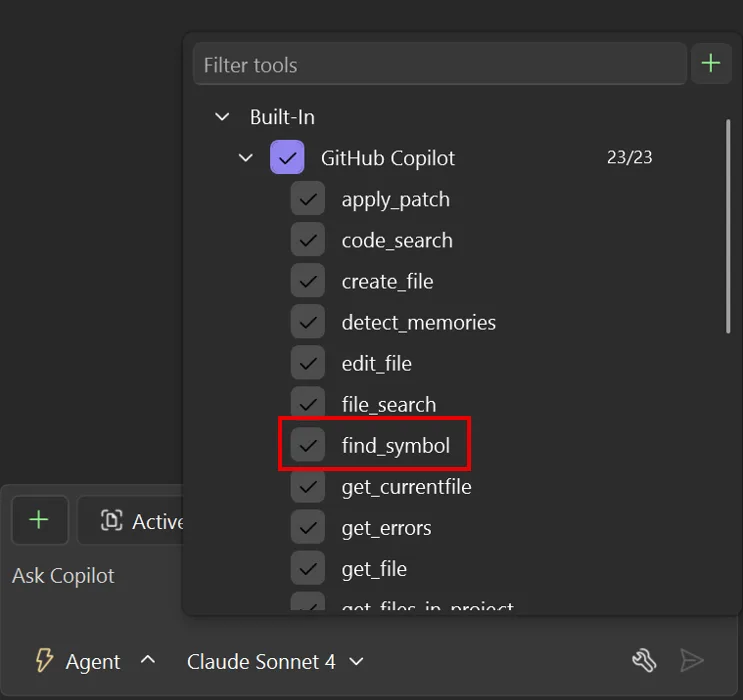
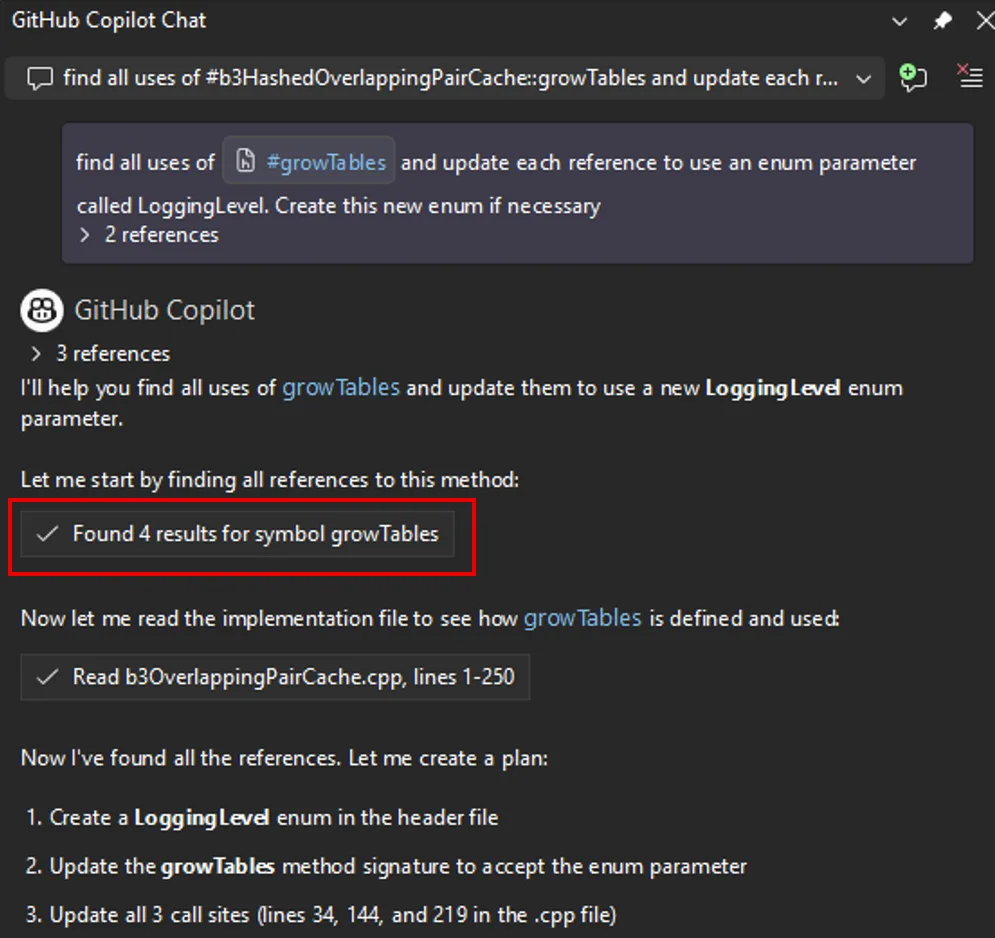
Copilot’s agent mode now has language-aware symbol navigation. The new find_symbol tool lets the agent find all references to symbols across your project and access metadata like type information, declarations, and scope. This means when you ask Copilot to refactor a method or update a parameter across call sites, it can actually see your code’s structure rather than guessing from text.

vs18 4 find symbol image

Enable the tool, and Copilot uses it automatically when answering questions or suggesting code changes. The difference is noticeable: instead of searching for text patterns, the agent navigates your code using language services.

vs18 4 find symbol example image

Supported languages include C++, C#, Razor, and TypeScript, plus any language with a supported LSP extension installed. For best results, use AI models that support tool-calling. Learn more at AI model comparison.

Enterprise MCP governance

MCP server usage in Visual Studio now respects allowlist policies set through GitHub. Admins can specify which MCP servers are allowed within their organizations. When an allowlist is configured, only approved servers can be connected. If you try to use an unauthorized server, you’ll see an error explaining the restriction. This helps organizations control which MCP servers process sensitive data and maintain compliance with security policies.

Profile Tests with Copilot

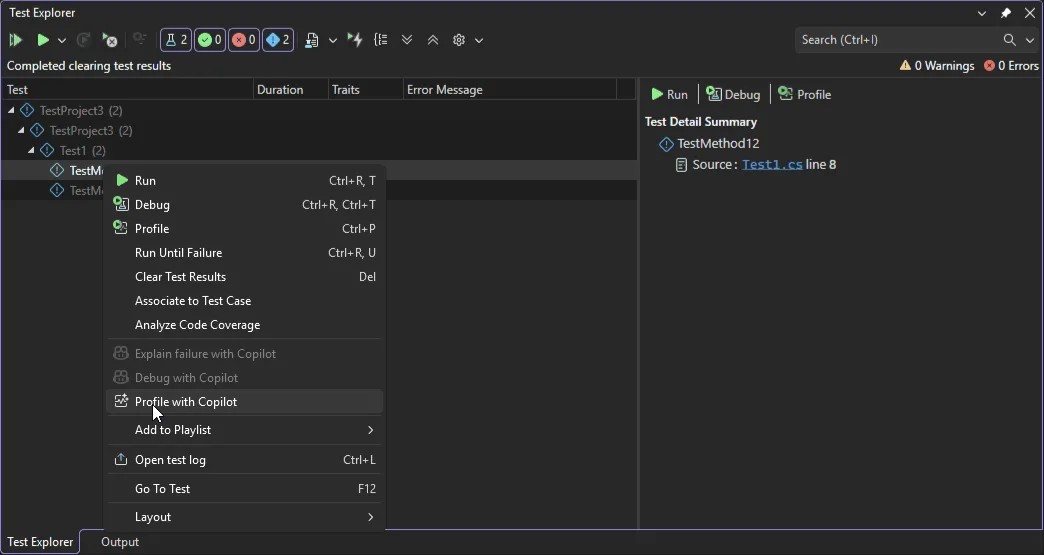
Ever wanted to profile a specific test without wrestling with profiler configuration? There’s now a Profile with Copilot command right in the Test Explorer context menu.

vs18 4 profile test with copilot image

When selected, the Profiling Agent automatically runs the chosen test and analyzes its performance, combining CPU usage and instrumentation data to deliver actionable insights. By default, it uses Instrumentation profiling and is currently supported in .NET. If you need deeper analysis, you can launch the selected test directly from the Copilot chat window and choose additional profiling tools.

Perf tips powered by live profiling

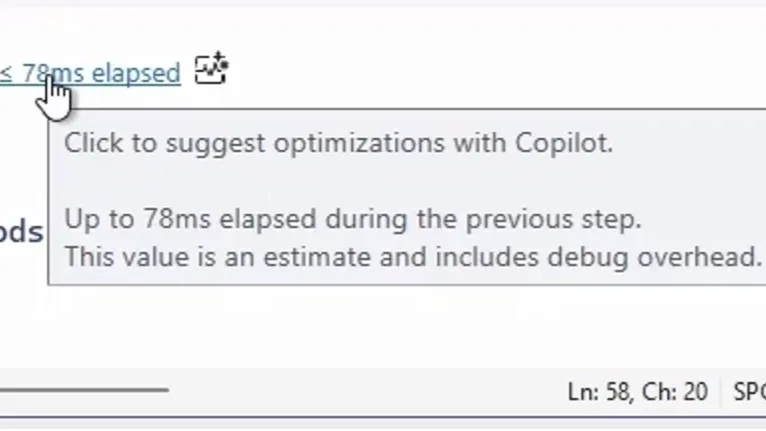
Performance optimization now happens while you debug, not after. As you step through code, Visual Studio shows execution time and performance signals inline for each step. When you spot a slow line, just click the Perf Tip and ask Copilot for optimization suggestions on the spot.

vs18 4 profiler agent perf tip image

The Profiler Agent captures runtime data during debugging automatically: elapsed time, CPU usage, and memory behavior. Copilot uses this data to pinpoint performance hot spots and suggest targeted fixes. This keeps optimization part of your regular debugging workflow instead of something you tackle later.

Fix vulnerabilities with Copilot

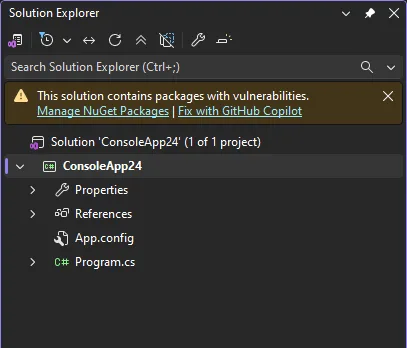
Spotted a NuGet package vulnerability? Copilot can now help you fix it directly from Solution Explorer. When a vulnerability is detected, you’ll see a notification with a Fix with GitHub Copilot link. Click through, and Copilot analyzes the vulnerability, recommends and implements targeted dependency updates that keep your packages secure without disrupting your workflow.

vs18 4 fix with copilot link image

No more manual vulnerability research or hunting down correct package versions. You address security issues right when they’re discovered.

HTML rich copy/cut

Need to paste code into a presentation, an Azure DevOps work item, or a web-based document? Visual Studio now supports HTML clipboard format when cutting or copying code from the editor. Syntax highlighting and formatting carry over when you paste into HTML-based applications. It’s turned on by default. To customize, go to Tools > Options > Text Editor > Advanced where you can toggle Copy rich text on copy/cut and set the max length.

From our entire team, thank you for choosing Visual Studio! For the latest updates, resources, and news, check out the Visual Studio Hub and stay in touch.

Happy coding!

The Visual Studio team

Visual Studio Code 1.114


Last updated: March 25, 2026

Welcome to the 1.114 release of Visual Studio Code.

Happy Coding!


To try new features as soon as possible, download the nightly Insiders build, which includes the latest updates as soon as they are available.


March 23, 2026

  • Pinned chat sessions show a pin icon indicator in the sessions list, making it easier to distinguish pinned from unpinned sessions. #304046

  • A new ${taskVar:name} variable lets you capture dynamic values from a task’s problem matcher output and use them in launch configurations. For example, capture a server URL from task output and reference it with ${taskVar:serverUrl}. #303361


We really appreciate people trying our new features as soon as they are ready, so check back here often and learn what’s new.

How VS Code Builds with AI


March 13, 2026 by Pierce Boggan

We use AI every day to ship VS Code. It’s made us so much faster that, after ten years of monthly releases, we just went weekly. Agents were the key that unlocked this, not just for writing code, but across every part of how the team works.

To kick off Agent Sessions Day, I sat down with Peng Lyu, Engineering Manager on the VS Code team, to walk through how the VS Code team actually uses AI for our day-to-day work. Not only for implementing features (that part’s self-evident), but for everything around building features: triage, code review, release notes, validation, staying productive in a meeting-heavy schedule.

In that session, we probably only covered 5% of what the team does with agents on any given day. But it’s representative of how a product that’s used by millions of developers is built. So, we wanted to share more about these big recent changes to our workflow, and where we think we’re going next.

After Ten Years of Monthly Releases, We Went Weekly

We shipped VS Code monthly for ten years. Every single month we went through our well-oiled cycle of plan, build, test, endgame, ship. With each member of the team rotating through the different roles, it was a rhythm that became part of the team’s culture.

Recently, we decided to start shipping VS Code on a weekly cadence. And we wanted to keep the bar for rigor and quality just as high. A monthly cycle gives you breathing room with time to plan, time to run a full endgame week where the team cross-tests each other’s features, and time to write thorough release notes. Moving to a weekly cadence means all of that has to get faster or get automated. This is a huge change and a year ago, we couldn’t have done it. This shift was only possible because of the way agents have transformed how we work.

A screenshot of a post on X from @pierceboggan that says "You told us you wanted features available in Insiders to VS Code stable, faster. We're moving towards weekly stable releases to bring top features to VS Code".

The weekly cadence isn’t about shipping faster for its own sake. It’s about getting improvements to developers sooner. A bug fix that used to wait three weeks for the next stable release now ships in days. A feature that’s merged on Monday can be in developers’ editors that same week. That feedback loop of ship > learn > iterate just gets so much faster.

What We Learned From This Shift

Our workflows and processes continue to evolve daily, as we learn and adapt. But there are some key learnings that continue to hold true:

  1. Parallelize yourself. Build the habit of kicking off multiple agent sessions before context-switching. Worktrees, cloud agents, multiple VS Code sessions… use them all.
  2. Skip the intermediate artifacts. What used to be meeting notes → issues → specs → code, is now actually becoming meeting → agent sessions → code → PR.
  3. Automate the overhead that scales with velocity. We built agent-powered pipelines for issue triage, commit summarization, release notes, code review, all of it using Copilot CLI, the Copilot SDK, and GitHub Actions. Engineers are still on the other end of these workflows, but agents help surface the right things to the right people, faster.
  4. Invest in harnesses before speed. Tests, golden scenarios, and code review gates prevent agent-driven velocity from becoming agent-driven regression.
  5. Ownership is evolving. When PMs, engineers from other areas, community contributors, and agents can contribute to any component, traditional ownership models need to adapt. Accountability for outcomes still rests with engineers.
  6. Keep humans in the loop for taste. Agents check correctness. Humans evaluate delight.

Let’s look into more detail on how each of these plays out in our team.

Working in Parallel

There’s a famous Paul Graham essay about how maker schedules and manager schedules are fundamentally incompatible. That was mostly true until recently. But agents are changing that.

Here’s what a typical day might look like:

  • Before entering a meeting, kick off 3-4 agent sessions for fixing bugs, prototyping features, or triaging issues.
  • During the meeting, agents run in parallel across multiple VS Code sessions, worktrees, or in the cloud.
  • After the meeting, review the agent output, verify locally, merge or re-prompt, and kick off again.

Managers still attend meetings and other managerial tasks, but they can use agents to also take on some of the maker work that used to be impossible to do in a meeting-heavy schedule.

Let me give you a real example. Peng starts each morning by updating VS Code Insiders. Most days, we ship Insiders builds twice a day so we can get early feedback on the stuff we are working on. Then he runs a custom agent that fetches his meetings via Work IQ, and produces a snapshot of what’s on his plate.

From there, Peng decides what needs his focus, what to delegate to agents, and what to prioritize for the team. The agent handles the busywork of gathering context so he can cut straight to the interesting problems. By the time he’s in his first call, tasks are already running in parallel.

A task management view showing a prioritized to-do list split into two sections: "Do Yourself (people/decisions)" with 4 items including prepping for VS Code Live Agent Sessions Day, scheduling a 1:1, sending a repo link, and communicating opt-out expectations; and "Open Code Tasks (delegate or do)" with 3 items including background agent worktree improvements, starting a group chat for review coordination, and discussing a GitHub endpoint for steering context. Each item includes status notes and dates.

“Previously, you were always working sequentially. You wrote notes, turned them into issues, and then someone else, or you, would pick that up later. Now you are empowered and able to do things in parallel. It’s a habit you have to build. So, I don’t write down meeting notes anymore. I’m kicking off the agents directly.” — Peng Lyu

It really is a new muscle. Someone in a meeting mentions something we need to go do, and I’ll fire off agents right there. We’ve also enabled transcription for most of our meetings in Teams, so grabbing context after the fact is easy. What used to be meeting notes turned into issues turned into work is now just a prompt kicked off in the moment.

Automating the Overhead

More velocity is great. It also creates its own overhead: more issues to triage, more commits to track, more release notes to write. Here’s how we’ve automated the parts that scale with speed.

Commit summarization. We built a custom slash command that fetches all commits from the last 24 hours across multiple repos and summarizes them with a fast model. It used to be you’d git fetch and have 20 or 30 commits. Now, there can be 100+ waiting for you. An entire feature area can land in a single day. That same pipeline feeds into our Insiders changelog and powers our automated X account that posts daily updates. All built on Copilot CLI and the Copilot SDK, running as GitHub Actions triggered by commits to main.

Issue triage. VS Code is one of the largest open-source projects on GitHub. We love our community, and the volume of issues we get is a reflection of how many people care about the product: hundreds land daily. We used to have a rotating “inbox tracker” role, one person triaging everything for a week. This no longer scales.

Now, every time an issue is opened, it triggers an agent loop in GitHub Actions that detects duplicates (with confidence scores), determines the right owner, and suggests labels. The agent reads our ownership docs and looks at historical assignment patterns, because ownership shifts over time.

You can see it in the repo’s public data: comparing Jan-Mar year over year, commit volume has more than doubled and the team is closing nearly 3x as many issues. Better triage helps engineers find and fix the right issues faster, which frees up more time for actual software development.

Bar chart titled VS Code Repo Activity Jan 1 to Mar 10 showing a year-over-year comparison using public GitHub data. Commits grew from 2,339 in 2025 to 5,104 in 2026, a 2.2x increase. Issues Closed grew from 2,916 in 2025 to 8,402 in 2026, a 2.9x increase. 2025 bars are gray, 2026 bars are blue.

“Now that piece of code is written by Copilot, who is the right owner for it? I would say it’s still our engineers who are accountable for the outcome. But you do need the right harness to welcome other people to contribute to your component.” — Peng Lyu

The team also built a Chrome extension that shows triage suggestions directly on GitHub issues, like duplicates, owners, and labels. It includes a dashboard showing issue status across the team. Inside VS Code, custom slash commands let engineers groom issues and find duplicates without leaving the editor.

We’ve already seen a real boost in shipping velocity from the team. And, there’s still so much more we can continue to automate, streamline, and learn from as these workflows mature.

Everyone Ships Code

This is the part I’m most excited about, because it’s changed how I work more than anything else.

The traditional PM loop looks like this: write a spec or PRD → create issues → hand off to engineering. Nobody loved reading those specs, and the fundamental problem is that they’re based on hypotheses. You’re writing about what you think the experience should be, but you don’t actually know until it’s built. So, the turnaround time for feature validating can be long.

What’s changed is that instead of creating a spec, I create a prototype, an actual pull request!

With agents in VS Code, I can go from someone giving us feedback on X or Reddit to a working prototype, self-host and experience it on Insiders, and continue to iterate. I had a PR merged last month that implements forking conversations in Copilot Chat. Together with Justin, one of our engineers, we reviewed the PR, worked through a few CSS changes together in the office and merged it. That’s in VS Code now.

A screenshot of an X post from @pierceboggan sharing that the fork feature is coming to VS Code.

This doesn’t mean that all these prototypes end up in the product. Engineers are still accountable for code quality and architecture. If Peng looks at my PR and says “this doesn’t have the right architecture,” that’s fair, I’m fine with my PR getting thrown away and rebuilt. But the PR moves the conversation forward faster than any document ever could. The first PR doesn’t have to be perfect. It moves the needle and starts a conversation with the engineer who owns that feature area.

This workflow is also a litmus test for whether your codebase is agent-ready. Can an agent find the right components? Can it find regressions? Can it find the right fix? If a PM can throw a problem at an agent and get a reasonable PR, that tells you something good about the codebase’s structure, documentation, and test coverage. If the agent struggles, that’s a signal too.

Keeping Quality High as Velocity Increases

More velocity means more risk of regression.

“Without the right harness, for the first week or two your productivity is really high. Then you quickly reach a ceiling where you keep regressing.” — Peng Lyu

If a new component doesn’t have good guardrails, agent-driven development starts strong and then quality degrades quickly. The fundamentals are still important, and with AI, we can actually improve upon them:

  • Automated validation. When you’ve got 5-10 agents running at once, manually verifying that each one delivered the right experience, not just code that compiles, is expensive. Our team built a custom agent that uses the Playwright MCP server to launch VS Code, navigate to the feature under test, take screenshots, and evaluate whether the change matches expected behavior. Because it runs inside an agent loop, if the screenshot shows something broken, the agent goes and fixes it. Screenshots are stored for human review.

  • Testing. Comprehensive test suites, unit tests, integration tests, and the infrastructure to run them, are table stakes. Beyond that, we document golden scenarios: specs of expected behavior for core user flows. We’ve traditionally tested these manually during monthly endgame weeks. We’re now giving these scenarios to agents to run as automated post-merge validation. We’re also exploring using this pipeline to auto-generate demo recordings: a PR lands, a demo video gets generated, and that becomes content for the changelog or a tweet.

  • Code review. Every PR automatically gets a Copilot code review, and engineers resolve Copilot’s comments before requesting human review. Six months ago, we didn’t enforce this because the feedback was too noisy. Over the last few months, model quality significantly improved, often catching security, performance, and code quality issues on first pass. Resolving those comments before requesting human review has become a natural part of our workflow. We coordinate through a Slack channel where a bot posts PRs with status indicators for CI and Copilot Code Review, both updating in-place as checks complete. The culture is “give one, take one”: submit a PR, pick up a review.

  • Evaluating for taste. Human review isn’t going away and has even become more important. When agents are writing more code and PRs are landing faster, the human reviewer checks whether the change actually makes sense for the product. Does this fit the architecture long-term? Does it feel right to use? Agents can catch bugs, but they can’t tell you whether a feature is going to delight a developer.

Traditionally, we had endgame weeks where engineers, PMs, and designers test each other’s features. We aren’t doing away with this, but rather compressing it in time. On the PM side, I’ve been exploring what I think of as taste-based grading: writing down the qualitative experience I want a feature to have, then using agents to evaluate whether the implementation matches. Maybe 80% of the agent’s observations are useful, 20% I ignore, but that 80% still gets you pretty far. Things like: does our model picker just show the model name and multiplier, or is there more information a user would actually want?

We think this same approach could help us check whether our published docs actually match the lived experience of using the product. All of our VS Code docs are largely written by one person, which is kind of amazing given our pace, but docs can go stale fast when the product is changing this quickly. We’re exploring how agents can help us catch that drift automatically.

What’s Next

More broadly, all of this comes back to what we think of as agent-ready codebase assessment: does your codebase have the structure, documentation, and test coverage for agents to contribute effectively?

We’re genuinely curious: what does your team’s version of this look like? Are there workflows we’re missing? Things you’ve automated that we haven’t thought of? Drop us an issue in the VS Code repo or find us on X — we’re building this alongside you and your feedback shapes what comes next.

We had a lot of other great sessions at Agent Sessions Day too, so check those out if you haven’t already.

Happy coding! 💙

Get the Inside Scoop on Visual Studio Subscriptions, Straight to Your Inbox


VSS Newsletter Opt in Blog Banner image

Get the Inside Scoop on Visual Studio Subscriptions, Straight to Your Inbox 

A few weeks ago I was talking with a Visual Studio Enterprise subscriber. Seasoned .NET developer. Ships production code. Knows his stack inside and out. 

During the conversation I mentioned one of the training benefits included in his subscription. 

He stopped me. 

“I didn’t even know that was included.” 

That is exactly why we created the Visual Studio Subscriptions monthly email newsletter. 

Why We Launched It 

Visual Studio Professional and Enterprise subscriptions include far more than just the IDE. For example: 

  • Professional or Enterprise IDE downloads 
  • Training platforms like Pluralsight and Cloud Academy 
  • Discounts on Visual Studio Live! events 
  • Additional partner offers 

That is real value. But most developers are focused on building, shipping, and supporting applications. You’re not signing in to my.visualstudio.com every week to see what changed. And you shouldn’t have to. 

The Visual Studio newsletter delivers the signal directly to you, once a month, in a format that is concise, relevant, and actionable. 

What You’ll Get 

This is not a generic marketing email. It’s built specifically for Visual Studio subscribers. 

Each edition includes exclusive resources you will not find anywhere else, including: 

  • Hot off the press updates 
  • Insider tips to level up your code 
  • Carefully curated on-demand content 
  • Clear explanations of subscriber benefits 
  • Practical insights from the Visual Studio team 

If you have ever wondered whether you’re fully using your subscription, this newsletter makes it easy to know. 

Why It Matters 

Technology moves fast. AI is changing development workflows. .NET continues to evolve. Azure adds capabilities every month. 

Staying current does not mean reading everything. It means reading the right things. 

The newsletter helps you: 

  • Discover new and updated subscriber benefits 
  • Activate learning resources you may not know about 
  • Take advantage of exclusive discounts 
  • Stay ahead on tools like GitHub Copilot, Azure, and .NET 

Small, consistent updates compound over time. 

Want In? 

If you’re a Visual Studio subscriber and want the inside track on updates, benefits, and exclusive resources, opt in here: 

When you reach the preferences page, make sure these two boxes are checked: 


vss opt in image

Building Long-Distance Next Edit Suggestions


February 26, 2026 by Vikram Duvvur, Gaurav Mittal, Benjamin Simmonds

Last February, we released next edit suggestions (NES) in GitHub Copilot. NES extends ghost text by not just inserting code at your cursor, but suggesting edits nearby, anticipating what you’d change next. This was a powerful step forward, but it only worked within a small window around your cursor. In real editing workflows, the next change you need to make is often several screens away.

That’s what we set out to solve with long-distance next edit suggestions: extending NES to predict and suggest edits anywhere in your file, not just near your current cursor position.

A far away NES edit

From nearby edits to anywhere in the file

Think about a typical refactoring session. You rename a function and all function invocations elsewhere in the file also need updating. Or you change a parameter type, which now makes the validation logic 200 lines down incorrect. These are exactly the moments where you would expect NES to help you, but unfortunately, the next meaningful edit is far outside its effective window.

This creates a hard modeling problem. The search space explodes from a handful of nearby lines to every line in the file. And the cost of getting it wrong isn’t evenly split: a correct jump saves you real effort, but an unnecessary one interrupts your flow and makes you less likely to trust the next suggestion. The system must learn not only where to move, but also when not to move.

Rather than modifying the existing edit-generation model, we decided to use a multi-model approach. We trained a dedicated location model whose sole responsibility is to predict where the next edit should happen. Once a valid location is selected, the original NES model then generates the edit suggestion.

This separation has two benefits. First, each model can specialize on one task: one model learns spatial intent (where to jump), the other model produces high-quality edits within a local window. In addition, it enables us to iterate independently on location prediction without disrupting ongoing improvements to the core NES model.

Measuring success via an evaluation framework

Before training the location model, we needed a way to measure whether it was actually working for real-world editing scenarios.

We designed a structured three-step evaluation process:

  1. Identify common multi-edit workflows
  2. Construct representative cursor-jump examples
  3. Measure both jump and no-jump accuracy

Diagram of the three-step evaluation flow, showing the progression from real editing workflows to structured evaluation dataset to spatial intent metrics.

We started by analyzing how developers chain together edits in real-world scenarios – renaming, signature changes, documentation updates – rather than treating each edit as an isolated event. The common thread: edits ripple across multiple, non-adjacent locations in a file.

From these workflows, we built an evaluation dataset where each example includes the ground-truth next line to jump to, recent edit history, and cursor context.

Crucially, we measured both jump and no-jump accuracy. While many examples required predicting a new location, a meaningful subset required staying on the current line. A model that jumps too often can be just as disruptive as one that misses important transitions. Imagine getting a jump suggestion every time you’re halfway through typing a variable name.

By grounding evaluation in realistic workflows and measuring both jump and no-jump cases, we ensured that offline metrics reflected how developers actually edit rather than artificial scenarios.

Building the training dataset

With evaluation in place, we turned to training data. While the evaluation dataset was small enough to construct by hand, training required data at a much larger scale. We started with the same dataset we curated for training the core NES model, which contains trajectories of how developers move through and edit a file.

By replaying these trajectories, we transformed every cursor movement into a training sample. After applying filters, such as ensuring the jump location appeared in the prompt, we had our training dataset.

Training with supervised finetuning

To train the location model, we used Supervised Finetuning (SFT) with targeted hyperparameter search. Our strongest results came from a structured grid search centered around the hyperparameters of the existing NES model. By constraining the search space to values already known to perform well in a related setting, we were able to efficiently explore combinations and identify a high-performing configuration.

Before settling on this approach, we also experimented with Bayesian Optimization, a technique designed to optimize expensive black-box functions. In our case, each evaluation required training a model from scratch, making experimentation computationally costly. While theoretically appealing, this approach did not yield improvements over the more focused grid search.

Ultimately, the structured grid search produced our best-performing supervised model and provided a stable foundation for subsequent iterations.

Designing UX for distant edits

A better model isn’t enough if you never notice or trust the suggestions it produces. With standard NES, suggestions appear close to your cursor and within your immediate view, making them naturally discoverable. With long-distance NES, the most relevant edit may not be in your immediate vicinity. So, the UX has to solve a harder problem: surfacing distant edits without disrupting your flow.

Video of a far away jump suggestion, showing how the widget adapts to a gradually reducing window size.

This comes down to balancing three concerns: keeping suggestions compact, making them readable, and minimizing how much of your code they obscure.

This is more than a discoverability problem. It’s a trust problem. When the system proposes moving your cursor elsewhere, you need to quickly assess whether that jump is relevant and worth your attention. The UI must communicate enough context to evaluate the suggestion without demanding a full context switch.

Rather than rendering large diffs inline or forcing attention shifts, we designed a compact widget that appears near your cursor and prefers empty space when available. The widget adapts to the surrounding editor layout, shrinking or expanding to fit naturally into whitespace such as at the end of a line or between blocks of code.

Because the full edit may be far away and potentially large, the widget does not attempt to render the entire suggestion. Instead, it provides a lightweight preview, an excerpt from one of the affected lines, rendered with diff-style highlighting. This gives you just enough context to judge relevance and decide whether to act.

If the preview looks useful, you can choose to jump to the suggested location and review or apply the full edit there. If not, you can continue editing uninterrupted.

Validating: from dogfooding to A/B tests

We always dogfood internally before shipping new capabilities, and long-distance NES was no exception. Early feedback revealed a clear pattern: the model was too eager to jump. Even when its predictions were directionally correct, frequent suggestions became distracting. The root cause was a dataset imbalance: far fewer “no jump” examples than jump examples. The model had learned to jump confidently but hadn’t learned when to stay put.

We rebalanced the dataset by expanding samples where the correct action was to remain on the current line, such as partially typed identifiers where jumping would not make sense. After retraining, both jump and no-jump accuracy improved, and suggestions felt noticeably more intentional.

To validate at scale, we ran A/B tests comparing long-distance NES against standard NES. The results were encouraging: a 23% increase in code written via NES, along with improvements across other engagement metrics. But the experiment also surfaced a tradeoff. Far-away suggestions were rejected more often than standard NES. Some of this was expected given a new interaction pattern, but it signaled that the model still needed to be more selective about when to suggest a jump.

This wasn’t purely a modeling problem or purely a UX problem. It was both. Improving long-distance NES required tightening the model’s jump predictions while also ensuring the interface made it easy to assess and accept relevant suggestions.

Reinforcement Learning: Learning when not to jump

The validation results pointed to a clear conclusion: the supervised model needed more restraint.

To address this, we introduced a reinforcement learning stage using Reinforcement Learning with Verified Rewards (RLVR). Instead of relying solely on supervised labels, we added a grading signal based on how closely the model’s predicted jump location matched the eventual cursor movement. Predictions that aligned closely with actual editing behavior were rewarded more strongly, while unnecessary or poorly timed jumps were penalized.

This allowed the model to optimize directly for real editing conditions, without requiring new manual annotations or UX instrumentation.

The result was a better balance between initiative and restraint. The updated model improved offline metrics and translated those gains into online performance, increasing code written via NES while reducing rejection rates. With those signals in place, we began shipping the improved version the following month.

What’s next?

Looking ahead, we plan to extend this work with cross-file suggestions, enabling the model to reason beyond the current file. We’re also exploring a unified model that predicts both the location and the content of the next edit together, which could improve overall suggestion relevance.

Try It Out

Long-distance next edit suggestions are available now in VS Code for users with a GitHub Copilot subscription – just ensure you have next edit suggestions and extended NES range


github.copilot.nextEditSuggestions.extendedRange

enabled in VS Code. Give it a try the next time you’re doing refactoring work—renaming variables, updating function signatures, or making changes that ripple through your file. We’d love to hear your feedback!

Happy coding! 💙


Acknowledgements

A big shoutout to our developer community for the ongoing feedback that pushes us to deliver the best possible experiences with VS Code and GitHub Copilot. And a huge thanks to the researchers, engineers, product managers, and designers across GitHub and Microsoft who curated the training data, built the training pipeline, evaluation suites, and serving stack, and to the VS Code and GitHub Copilot teams for smooth model releases.

Making agents practical for real-world development


March 5, 2026 by VS Code Team, @code

Agents are taking on more complex and longer-running development tasks.

With the February 2026 release (1.110), we’re making those workflows more practical inside Visual Studio Code by giving you greater control over how agents behave, integrate into your tools, and retain project context across sessions.

From enforcing policies with hooks to guiding agents mid-response, validating UI features with integrated browser tools, and bringing structured skills directly into the editor, this release focuses on making agents reliable collaborators for real development work.

Give agents the right context

Codebases often have a complex architecture and project structure, and can consist of thousands of files. Agents might struggle to stay focused and find the right pieces of information, especially as sessions get longer.

In this release, we’re improving how agents handle large outputs efficiently, how they remember the most important parts of the task at hand, and giving you control over what information can be discarded.

Handle large outputs

Large diffs, generated files, or extensive logs can overwhelm a session if treated as an inline context.

Agents and LLMs are great at working with files. VS Code now manages large outputs by streaming them to temporary files and prioritizing the most relevant information for the model. This keeps agents focused on the right details while optimizing context usage without additional work.

From a UI perspective, large tool outputs in a chat conversation can make it difficult to follow the overall flow of what’s happening in a session. VS Code now puts terminal output in collapsible sections, giving you the details if you want them, while keeping the session uncluttered.

Share agent memory

Agents in Visual Studio Code use memory to retain relevant context. Agent memory now spans coding agents, CLI workflows, and code review interactions.

Rather than starting from scratch each session, agents recall your preferences, apply lessons from previous tasks, and build up knowledge about your codebase over time.

Architectural decisions, naming conventions, and prior refactors remain part of the conversation, so you spend less time restating intent and more time continuing the work.

Compact long sessions

As conversations expand, VS Code automatically compacts older history. Earlier discussions are summarized, key decisions are preserved, and space is freed up for ongoing work.

Previously, you had no control over when context compaction was happening and what information was retained after compacting. Maybe you discussed several implementation variants, and only one specific one is important to remember and build upon.

Now you can manually run context compaction for a session by typing /compact. And in doing so, you can give the agent additional instructions on what information to keep or discard.

Especially when working with long-running sessions and dealing with lots of context, controlling compaction keeps the agent focused on the key information.

Screenshot showing the context window control and the compact option.

Agent controls

As agents take on more responsibility, the way you interact with them matters just as much as what they generate. These updates make it easier to control the conversation and guide outcomes during active work.

Guide the agent while it works

Agents sometimes head down the wrong path and it’s immediately obvious, even before it has finished the request.

Previously, you had to wait for a response to complete before you could steer it in a different direction. Now, you can intervene while the agent is generating a response, guiding the direction of the work without restarting or losing context.

And if you think of some extra tasks the agent should perform, you can now queue follow-on requests for the agent to perform once it has finished its current task. If you queue up multiple requests, you can easily change the order in which they need to be performed.

For example, you might clarify:

  • Only modify this component
  • Reuse existing utilities
  • Avoid changes to backend APIs

Fewer wasted edits, shorter feedback loops, and a conversation that stays on track.

In our app, when new styling guidance is introduced to enhance the hero card with a gold accent and shimmer effect, the agent revisits the existing CSS and continues the implementation without restarting the session.

Explore alternatives without losing context

There are often different ways to solve a problem or multiple design options. You could create multiple chat sessions, one for each variant, but that would mean you need to copy over the existing context and conversation history.

To make this experience easier, you can now fork a chat session. This creates a new, independent session that inherits the conversation history from the original session. The forked session is fully separate from the original, so changes in one session do not affect the other.

You can either type /fork and it will copy over the full conversation, or you can use the fork button at a specific checkpoint to fork the conversation up until that point.

In the demo below, /fork creates a parallel thread where a more minimal design direction is explored without affecting the original discussion.

Automate with hooks

Teams frequently rely on conventions, validations, or automated checks to maintain consistency.

Hooks execute deterministically at key lifecycle events, allowing teams to enforce policies and set guardrails that keep agent-driven changes aligned with project standards, rather than relying on repeated prompts.

For example, a team might automatically lint code before edits are applied, block changes to protected configuration files, or trigger a test suite whenever an agent modifies application logic.

This keeps agent-driven changes aligned with your project’s standards without requiring constant supervision.

The following demo shows a stop hook executing on session exit, detecting uncommitted changes and automatically committing and pushing them.

Agent extensibility

Agents are most useful when they integrate naturally into the tools and workflows you already rely on. These updates introduce a richer agent experience that closes the development loop, while skills provide reusable building blocks you can invoke on demand.

Run agent skills when you need them

Many development tasks repeat across sessions.

Writing tests, refactoring code, or reviewing changes often follows patterns you already understand.

Instead of rewriting instructions each time, you can invoke agent skills directly from chat using slash commands. Skills may come from built-in capabilities, extensions, or project-specific tooling.

Instead of prompting vaguely, you can intentionally invoke workflows.

For example:

  • /tests generates validation tests
  • /explain documents unfamiliar code
  • /fix targets a specific error

By default, available skills appear in the / menu, making them discoverable and easy to reuse across sessions.

The following video demonstrates a frontend design skill driving the workflow end to end, implementing a new UI component, integrating live data, and validating the result without leaving VS Code.

Validate changes without leaving the editor

Agents are already effective at generating and running unit tests to validate non-UI code changes.

Verifying frontend behavior, however, has often relied on manual testing or manual screenshot comparisons.

With browser agent tools, agents can now open and interact with the application directly in the integrated browser inside VS Code.

This allows the agent to implement a UI change, load the running application, inspect the result, and adjust the code if something doesn’t behave as expected.

Implementation, inspection, and validation now happen within the same workflow, helping you iterate quickly without leaving the editor.

In the example below, the integrated browser opens and follows the page navigation, so you can validate changes as you interact with the application.

Development often moves between the terminal and the editor.

That’s why the Copilot CLI is now integrated in VS Code, with native support including diff tabs, trusted folder sync, and right-click to send code snippets. You can manage the connection by running /ide.

The CLI and editor stay aligned, sharing context as work progresses.

In practice:

  • A CLI process generates changes
  • VS Code surfaces them as diffs
  • You review and approve modifications directly in the editor

Screenshot of the Copilot CLI screen with VS Code auto‑connect settings and a selected workspace.

The next step for agents in VS Code

Agents are becoming a natural part of everyday development. You shouldn’t have to adapt your workflow around them. They should adapt to the way you build.

With the February 2026 release (1.110), VS Code gives you more control over how agents behave. They fit into your tools more naturally and carry context across sessions.

We’re building this in the open. If you have feedback, ideas, or run into issues, open a discussion or file an issue in the VS Code repo or find us on social. We’d love to hear from you.

Want to see how these features can enhance your developer workflow?

Join us for our VS Code release livestream on March 19 at 8 AM PST. Turn on notifications!

Happy coding! 💙

Insiders (version 1.111)


VS Code Insiders banner

Last updated: March 5, 2026

These release notes cover the Insiders build of VS Code and continue to evolve as new features are added. To try the latest updates, download Insiders.
To read these release notes online, go to code.visualstudio.com/updates.

You can still track our progress in the Commit log and our list of Closed issues.

These release notes were generated using GitHub Copilot and might contain inaccuracies.

Happy Coding!


March 5, 2026

  • VS Code now recursively searches for *.instructions.md files in subdirectories under .github/instructions/, matching the behavior of Copilot CLI and web-based GitHub Copilot agents. Previously, only files in the root .github/instructions/ directory were discovered. #295944

  • You can now copy the name of an item in the Source Control Repositories view by using the context menu option Copy Stash Name, Copy Branch Name, or other. #289824

  • Custom agent frontmatter now supports agent-scoped chat hooks. These hooks only run when the custom agent is selected or invoked via runSubagent. #299337

  • A new /troubleshoot slash command injects agent mode event logs into the chat context. Use it to ask the agent which customizations are loaded, how many tokens are consumed, debug instructions, and more. #299344

  • CLI sessions now support folder and repository isolation, in addition to worktree isolation. #299376

March 4, 2026

  • AI CLI terminal profiles now get a dedicated group in the terminal dropdown, making them easier to discover instead of being listed among other profiles. #293554

March 3, 2026

  • MCP Apps now support file downloads. #298836

  • Add Ctrl+F5 keyboard shortcut for a page refresh in the integrated browser, instead of unexpectedly opening the browser debugger. #291219

March 2, 2026

  • Added OpenTelemetry instrumentation support for Copilot Chat, enabling observability and performance tracing. #298834

  • Chat tips now only appear when a single chat session or the welcome view is visible, avoiding tips in sessions where multiple chat editors are open. #297759

  • After a user acts on or dismisses a chat tip, no more tips are shown for the rest of that session. #297682

  • You can now Go to Definition on localization placeholder strings (for example, %config.settingName%) in package.json to jump directly to the corresponding entry in package.nls.json. #297496

  • Selecting an agent plugin in the Extensions view now opens a detail view with an uninstall button, rendered README, and a list of contributed features. #297246

March 1, 2026

  • Markdown tables in chat now render with a horizontal scrollbar and improved column widths. #265062

February 28, 2026

  • Full-width CJK punctuation characters now render with consistent widths. #242138

  • Add a new foldedLine unit to the cursorMove command, enabling vim-like cursor movement that treats each folded region as a single step. #81498

February 27, 2026

  • Adjusts chat accessibility announcements so the accessibility.verboseChatProgressUpdates setting is respected, reducing unintended speech output (e.g. auto-synthesized TTS) for in-progress “thinking”/progress content. #296720

  • The confirm button in the ask_questions tool’s multi-page UI is repositioned on the last page to prevent overlap with the next-page arrow. #292404

  • Theme token customization now supports relative numeric values for font sizes and weights, instead of requiring absolute numbers. #285891


We really appreciate people trying our new features as soon as they are ready, so check back here often and learn what’s new.

Visual Studio February Update – Visual Studio Blog


This month’s Visual Studio update continues our focus on helping you move faster and stay in flow, with practical improvements across AI assistance, debugging, testing, and modernization. Building on the momentum from January’s editor updates, the February release brings smarter diagnostics and targeted support for real world development scenarios, from WinForms maintenance to C++ modernization.

All of the features highlighted are available in the Visual Studio 2026 Stable Channel as part of the February 2026 feature update (18.3). Please update to the latest version to try out these new features!

WinForms Expert Agent

The WinForms Expert agent provides a focused guide for handling key challenges in WinForms development. It covers several important areas:
Designer vs. regular code: Understand which C# features apply to designer-generated code and business logic.

  • Modern .NET patterns: Updated for .NET 8-10, including MVVM with Community Toolkit, async/await with proper InvokeAsync overloads, Dark mode with high-DPI support, and nullable reference types.
  • Layout: Advice on using TableLayoutPanel and FlowLayoutPanel for responsive, cross-device design.
  • CodeDOM serialization: Rules for property serialization and avoiding common issues with [DefaultValue] and ShouldSerialize*() methods.
  • Exception handling: Patterns for async event handlers and robust application-level error handling.

The agent serves as an expert reviewer for your WinForms code, providing comprehensive guidance on everything from naming controls to ensuring accessibility. The WinForms Agent is automatically implemented and included in the system prompt when necessary.

Smarter Test Generation with GitHub Copilot

Visual Studio now includes intelligent test generation with GitHub Copilot, making it faster to create and refine unit tests for your C# code. This purpose-built workflow works seamlessly with xUnit, NUnit, and MSTest.

GitHub Copilot Chat pane in Visual Studio showing a new chat thread. The Copilot Chat welcome screen appears with a message about checking accuracy, a prompt asking ‘generate tests for my entire solution,’ and the selected model labeled Claude Haiku 4.5. The input box includes a reference button and test generation command.

Simply type @Test in GitHub Copilot Chat, describe what you want to test, and Copilot generates the test code for you. Whether you’re starting fresh or improving coverage on existing projects, this feature helps you write tests faster without leaving your workflow.

Slash Commands for Custom Prompts

Invoke your favorite custom prompts faster using slash commands in Copilot Chat. Type / and your custom prompts appear at the top of the list, marked with a bookmark icon for easy identification.

Copilot Chat slash command menu in Visual Studio showing available commands such as quality check, clear, explain, fix, and generate, with Agent mode enabled and Claude Sonnet 4.5 selected in the chat input area.

We’ve also added two additional commands:

/generateInstructions: Automatically generate a copilot-instructions.md file for your repository using project context like coding style and preferences

/savePrompt: Extract a reusable prompt from your current chat thread and save it for later use via / commands

These shortcuts make it easier to build and reuse your workflow patterns.

C++ App Modernization

GitHub Copilot app modernization for C++ is now available in Public Preview. GitHub Copilot app modernization for C++ helps you update your C++ projects to use the latest versions of MSVC and to resolve upgrade-related issues. You can find our user documentation on Microsoft Learn.

Split view in Visual Studio showing a Markdown file on the left and a rendered preview on the right with an Executive Summary and Key Findings for an MSVC Build Tools upgrade including errors and warnings.

DataTips in IEnumerable Visualizer

You can now use DataTips in the IEnumerable Visualizer while debugging. Just hover over any cell in the grid to see the full object behind that value, the same DataTip experience you’re used to in the editor or Watch window.

When you hover over a cell, a DataTip shows all the object’s properties in one place. This makes it much easier to debug collections with complex or nested data. Whether it’s a List<T> of objects or a dictionary with structured values, one hover lets you quickly inspect everything inside.

Visual Studio IEnumerable Visualizer showing the expression lpvm.Posts. A table displays one row with columns for PostViewModel properties, including Categories with a count of one, AllCategories, NewCategory, and AllowComments set to True. A tooltip shows a CategoryViewModel object with an option to view raw data.

Analyze Call Stack with Copilot

You can now Analyze Call Stack with Copilot to help you quickly understand what your app is doing when debugging stops. When you pause execution, you can select Analyze with Copilot in the Call Stack window. Copilot reviews the current stack and explains why the app isn’t progressing whether the thread is waiting on work, looping, or blocked by something.

This makes the call stack more than just a list of frames. It becomes a helpful guide that shows what’s happening in your app so you can move faster toward the real fix.

Profiler agent with Unit Test support

The Profiler Agent (@profiler) now works with unit tests. You can use your existing tests to check performance improvements, making it easier to measure and optimize your code in more situations. The agent can discovers relevant unit tests/BenchmarkDotNet benchmarks that exercise performance-critical code paths.

If no good tests or benchmarks are available, it automatically creates a small measurement setup so you can capture a baseline and compare results after changes. This unit-test-focused approach also makes the Profiler Agent useful for C++ projects, where benchmarks aren’t always practical, but unit tests often already exist.

GitHub Copilot Chat showing profiler suggestion to optimize code step identify scope message requesting permission to run CPU performance profiler with confirm and deny buttons and model selector visible

Faster and More Reliable Razor Hot Reload

Hot Reload for Razor files are now faster and more reliable. By hosting the Razor compiler inside the Roslyn process, edits to .razor files apply more quickly and avoid delays that previously slowed Blazor workflows. We also reduced the number of blocked edits, with more changes now applying without requiring a rebuild, including file renames and several previously unsupported code edits. When a rebuild is still required, Hot Reload can now automatically restart the app instead of ending the debug session, helping you stay in flow.

We are continuing to invest in features that help you understand, test, and improve existing code, not just write new code. Try these updates in the Visual Studio 2026 Stable Channel and let us know what is working well and where we can improve. Your feedback directly shapes what we build next.