Three-Command CLI Workflow for Model Deployment


12.2_blog_hero - Version A (1)

This blog post focuses on new features and improvements. For a comprehensive list, including bug fixes, please see the release notes.

Three-Command CLI Workflow for Model Deployment

Getting models from development to production typically involves multiple tools, configuration files, and deployment steps. You scaffold a model locally, test it in isolation, configure infrastructure, write deployment scripts, and then push to production. Each step requires context switching and manual coordination.

With Clarifai 12.2, we’ve streamlined this into a 3-command workflow: model init, model serve, and model deploy. These commands handle scaffolding, local testing, and production deployment with automatic infrastructure provisioning, GPU selection, and health checks built in.

This isn’t just faster. It removes the friction between building a model and running it at scale. The CLI handles dependency management, runtime configuration, and deployment orchestration, so you can focus on model logic instead of infrastructure setup.

This release also introduces Training on Pipelines, allowing you to train models directly within pipeline workflows using dedicated compute resources. We’ve added Video Intelligence support through the UI, improved artifact lifecycle management, and expanded deployment capabilities with dynamic nodepool routing and new cloud provider support.

Let’s walk through what’s new and how to get started.

Streamlined Model Deployment: 3 Commands to Production

The typical model deployment workflow involves multiple steps: scaffold a project structure, install dependencies, write configuration files, test locally, containerize, provision infrastructure, and deploy. Each step requires switching contexts and managing configuration across different tools.

Clarifai’s CLI consolidates this into three commands that handle the entire lifecycle from scaffolding to production deployment.

How It Works

1. Initialize a model project

clarifai model init --toolkit vllm --model-name Qwen/Qwen3-0.6B 

This scaffolds a complete model directory with the structure Clarifai expects: config.yaml, requirements.txt, and model.py. You can use built-in toolkits (HuggingFace, vLLM, LMStudio, Ollama) or start from scratch with a base template.

The generated config.yaml includes smart defaults for runtime settings, compute requirements, and deployment configuration. You can modify these or leave them as-is for basic deployments.

2. Test locally

clarifai model serve 

This starts a local inference server that behaves exactly like the production deployment. You can test your model with real requests, verify behavior, and iterate quickly without deploying to the cloud.

The serve command supports multiple modes:

  • Environment mode: Runs directly in your local Python environment
  • Docker mode: Builds and runs in a container for production parity
  • Standalone gRPC mode: Exposes a gRPC endpoint for integration testing

3. Deploy to production

clarifai model deploy 

This command handles everything: validates your config, builds the container, provisions infrastructure (cluster, nodepool, deployment), and monitors until the model is ready.

The CLI shows structured deployment phases with progress indicators, so you know exactly what’s happening at each step. Once deployed, you get a public API endpoint that’s ready to handle inference requests.

Intelligent Infrastructure Provisioning

The CLI now handles GPU selection automatically during model initialization. GPU auto-selection analyzes your model’s memory requirements and toolkit specifications, then selects appropriate GPU instances.

Multi-cloud instance discovery works across cloud providers. You can use GPU shorthands like h100 or legacy instance names, and the CLI normalizes them across AWS, Azure, DigitalOcean, and other supported providers.

Custom Docker base images let you optimize build times. If you have a pre-built image with common dependencies, the CLI can use it as a base layer for faster toolkit builds.

Deployment Lifecycle Management

Once deployed, you need visibility into how models are running and the ability to control them. The CLI provides commands for the full deployment lifecycle:

Check deployment status:

clarifai model status --deployment <deployment-id> 

View logs:

clarifai model logs --deployment <deployment-id> 

Undeploy:

clarifai model undeploy --deployment <deployment-id> 

The CLI also supports managing deployments directly by ID, which is useful for scripting or CI/CD pipelines.

Enhanced Local Development

Local testing is critical for fast iteration, but it often diverges from production behavior. The CLI bridges this gap with local runners that mirror production environments.

The model serve command now supports:

  • Concurrency controls: Limit the number of simultaneous requests to simulate production load
  • Optional Docker image retention: Keep built images for faster restarts during development
  • Health-check configuration: Configure health-check settings using flags like --health-check-port, --disable-health-check, and --auto-find-health-check-port

Local runners also support the same inference modes as production (streaming, batch, multi-input), so you can test complex workflows locally before deploying.

Simplified Configuration

Model configuration used to require manually editing YAML files with exact field names and nested structures. The CLI now handles normalization automatically.

When you initialize a model, config.yaml includes only the fields you need to customize. Smart defaults fill in the rest. If you add fields with slightly incorrect names or formats, the CLI normalizes them during deployment.

This reduces configuration errors and makes it easier to migrate existing models to Clarifai.

Why This Matters

The 3-command workflow removes friction from model deployment. You go from idea to production API in minutes instead of hours or days. The CLI handles infrastructure complexity, so you don’t need to be an expert in Kubernetes, Docker, or cloud compute to deploy models at scale.

This also standardizes deployment across teams. Everyone uses the same commands, the same configuration format, and the same testing workflow. This makes it easier to share models, reproduce deployments, and onboard new team members.

For a complete guide on the new CLI workflow, including examples and advanced configuration options, see the Deploy Your First Model via CLI documentation.

Training on Pipelines

Clarifai Pipelines, introduced in 12.0, allow you to define and execute long-running, multi-step AI workflows. With 12.2, you can now train models directly within pipeline workflows using dedicated compute resources.

Training on Pipelines integrates model training into the same orchestration layer as inference and data processing. This means training jobs run on the same infrastructure as your other workloads, with the same autoscaling, monitoring, and cost controls.

How It Works

You can initialize training pipelines using templates via the CLI. This creates a pipeline structure with pre-configured training steps. You specify your dataset, model architecture, and training parameters in the pipeline configuration, then run it like any other pipeline.

This creates a pipeline structure with pre-configured training steps. You specify your dataset, model architecture, and training parameters in the pipeline configuration, then run it like any other pipeline.

The platform handles:

  • Provisioning GPUs for training workloads
  • Scaling compute based on job requirements
  • Saving checkpoints as Artifacts for versioning
  • Monitoring training metrics and logs

Once training completes, the resulting model is automatically compatible with Clarifai’s Compute Orchestration platform, so you can deploy it using the same model deploy workflow. Read more about Pipelines here.

UI Experience

We’ve also launched a new UI for training models within pipelines. You can configure training parameters, select datasets, and monitor progress directly from the platform without writing code or managing infrastructure.

This makes it easier for teams without deep ML engineering expertise to train custom models and integrate them into production workflows.

Training on Pipelines is available in Public Preview. For more details, see the Pipelines documentation.

Artifact Lifecycle Improvements

With 12.2, we’ve improved how Artifacts handle expiration and versioning.

Artifacts no longer expire automatically by default. Previously, artifacts had a default retention policy that would delete them after a certain period. Now, artifacts persist indefinitely unless you explicitly set an expires_at value during upload.

This gives you full control over artifact lifecycle management. You can set expiration dates for temporary outputs (like intermediate checkpoints during experimentation) while keeping production artifacts indefinitely.

The CLI now displays latest-version-id alongside artifact visibility, making it easier to reference the most recent version without listing all versions first.

These changes make Artifacts more predictable and easier to manage for long-term storage of pipeline outputs.

Video Intelligence

Clarifai now supports video intelligence through the UI. You can connect video streams to your application and apply AI analysis to detect objects, track movement, and generate insights in real time.

This expands Clarifai’s capabilities beyond image and text processing to handle live video feeds, enabling use cases like security monitoring, retail analytics, and automated content moderation for video platforms.

Video Intelligence is available now.

Deployment Enhancements

We’ve made several improvements to how deployments work across compute infrastructure.

Dynamic nodepool routing allows you to attach multiple nodepools to a single deployment with configurable scheduling strategies. This gives you more control over how traffic is distributed across different compute resources, which is useful for handling spillover traffic or routing to specific hardware based on request type.

Deployment visibility has been improved with status chips and enhanced list views across Deployments, Nodepools, and Clusters. You can see at a glance which deployments are healthy, which are scaling, and which need attention.

New cloud provider support: We’ve added DigitalOcean and Azure as supported instance providers, giving you more flexibility in where you deploy models.

Start and stop deployments explicitly: You can now pause deployments without deleting them. This preserves configuration while freeing up compute resources, which is useful for dev/test environments or models with intermittent traffic.

Redesigned Deployment details page provides expanded status visibility, including replica counts, nodepool health, and request metrics, all in one view.

Additional Changes

Platform Updates

We’ve launched several UI improvements to make the platform easier to navigate and use:

  • New Model Library UI provides a streamlined experience for browsing and exploring models
  • Universal Search added to the navbar for quick access to models, datasets, and workflows
  • New account experience with improved onboarding and settings management
  • Home 3.0 interface with a refreshed design and better organization of recent activity

Playground Improvements

The Playground now includes major upgrades to the Universal Search experience, with multi-panel (compare mode) support, improved workspace handling, and smarter model auto-selection. Model selections are panel-aware to prevent cross-panel conflicts, and the UI can display simplified model names for a cleaner experience.

Pipeline Step Visibility

You can now set pipeline steps to be publicly visible during initialization through both the CLI and builder APIs. By default, pipelines and pipeline step templates are created with PRIVATE visibility, but you can override this when sharing workflows across teams or with the community.

Modules Deprecation

Support for Modules has been fully dropped. Modules previously extended Clarifai’s UIs and enabled customized backend processing, but they’ve been replaced by more flexible alternatives like Artifacts and Pipelines.

Python SDK Updates

We’ve made several improvements to the Python SDK, including:

  • Fixed ModelRunner health server starting twice, which could cause “Address already in use” errors
  • Added admission-control support for model runners
  • Improved signal handling and zombie process reaping in runner containers
  • Refactored the MCP server implementation for better logging clarity

For a complete list of SDK updates, see the Python SDK changelog.

Ready to Start Building?

You can start using the new 3-command deployment workflow today. Initialize a model with clarifai model init, test it locally with clarifai model serve, and deploy to production with clarifai model deploy.

For teams running long-running training jobs, Training on Pipelines provides a way to integrate model training into the same orchestration layer as your inference workloads, with dedicated compute and automatic checkpoint management.

Video Intelligence support adds real-time video stream processing to the platform, and deployment improvements give you more control over how models run across different compute environments.

The new CLI workflow is available now. Check out the Deploy Your First Model via CLI guide to get started, or explore the full 12.2 release notes for complete details.

Sign up here to get started with Clarifai, or check out the documentation for more information.

If you have questions or need help while building, join us on Discord. Our community and team are there to help.
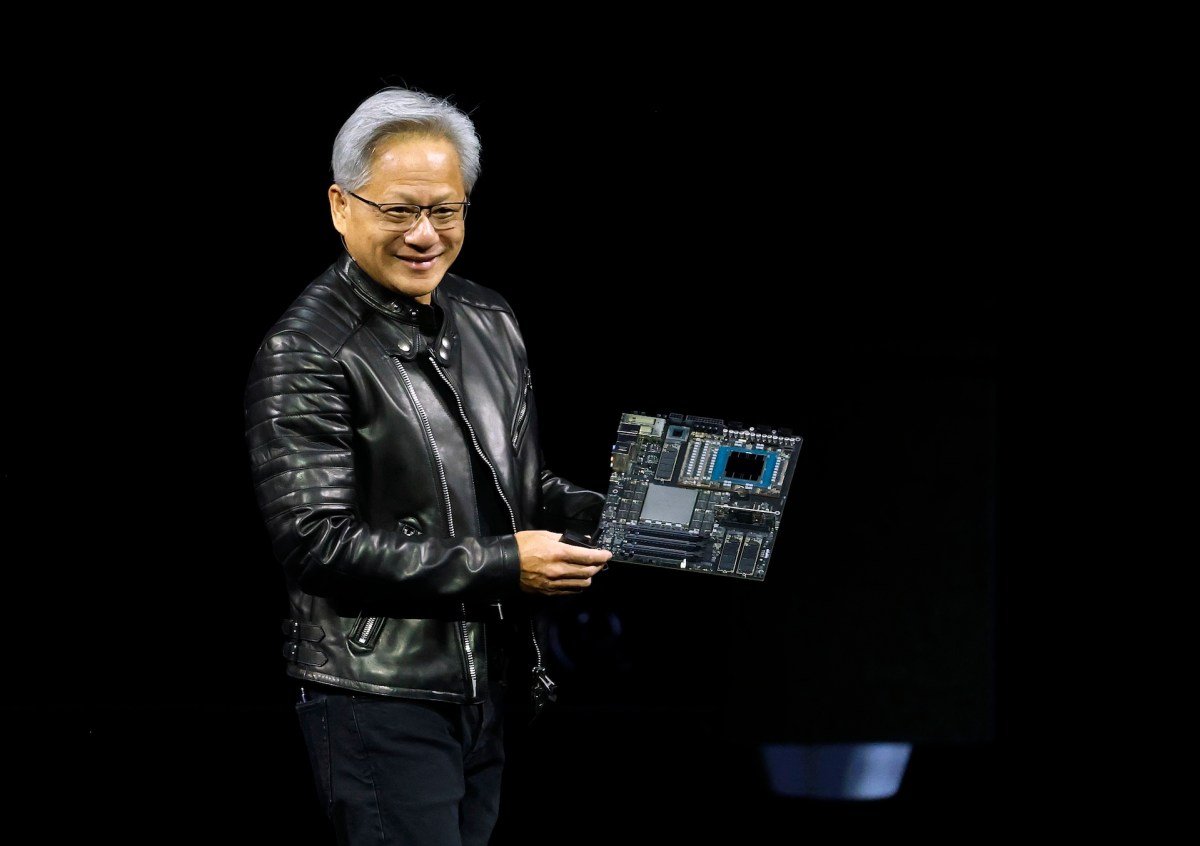



How to watch Jensen Huang’s Nvidia GTC 2026 keynote


Nvidia kicks off its annual GTC developer conference in San Jose, California, next week with CEO Jensen Huang’s keynote scheduled for Monday at 11am PT / 2pm ET.

GTC — which stands for GPU Technology Conference — is Nvidia’s flagship annual event, where the chipmaker typically uses the spotlight to announce new products, champion partnerships, and lay out its vision for the future of computing. Huang’s keynote will focus on Nvidia’s role in the future of computing and AI. You can watch the two-hour address in person at the SAP Center or livestream the talk on the event’s website.

The broader three-day event is focused on what’s coming next for AI across industries including healthcare, robotics, and autonomous vehicles, among others.

On the software side, it’s rumored that Nvidia will release an open source platform for enterprise AI agents, dubbed NemoClaw, as originally reported by Wired. The platform would give businesses a structured way to build and deploy AI agents (software that can carry out multi-step tasks autonomously) and would position Nvidia to mirror similar offerings from companies like OpenAI.

On the hardware side, the company is also rumored to be releasing a new chip designed to accelerate the AI inference process — the process by which an AI model applies what it has learned to generate responses or make decisions, as distinct from the initial training process, which requires far more computing power. Faster, cheaper inference is widely seen as one of the last bottlenecks to scaling AI applications broadly. The chip, if confirmed, would represent Nvidia’s latest bid to dominate not just the training market, where it already commands an estimated 80% share, but the inference market as well, where competition from custom chips built by Google, Amazon and others is fast intensifying.

Kevin Cook, a senior equity strategist at Zacks Investment Research, told TechCrunch that attendees should also expect to learn what the company plans to do with its relationship with Groq, the inference company Nvidia reportedly paid $20 billion late last year to license its technology. There’s a lot of curiosity around this tie-up, given that Jonathan Ross, Groq’s founder, Sunny Madra, Groq’s President, and other members of the Groq team agreed to join Nvidia to help advance and scale that licensed tech.

There will, of course, also be a range of partnership announcements and demonstrations showcasing Nvidia’s AI capabilities across industries.

Techcrunch event

San Francisco, CA
|
October 13-15, 2026

Samsung’s new tool aims to fix Android graphics bottlenecks


classic android games asphalt 8

Dhruv Bhutani / Android Authority

TL;DR

  • Samsung introduced Sokatoa, a new GPU profiling tool designed to help Android developers diagnose performance issues.
  • Sokatoa features multi-frame GPU profiling, allowing developers to analyze several frames of GPU activity at once to spot patterns and identify rendering problems more easily.
  • The tool is free to download now, and Samsung plans to release it as open source later this year.

If you’ve ever been in the middle of a high-end mobile game and noticed your phone heating up while the frame rate suddenly drops, you’ve run into the mystery of mobile GPU performance. Android developers have often found it hard to figure out exactly why a game stutters or drains the battery. Samsung aims to change this with Sokatoa, a new performance analysis tool built to help developers get the most out of Android GPUs.

Unlike consoles, where the hardware is fixed, Android phones use a wide range of chipsets and driver versions. Historically, developers relied on generic profilers that gave a broad overview of performance and didn’t provide the detailed data needed to fine-tune graphics. When a game lagged, it was hard to tell if the problem was a texture issue, a shader error, or thermal throttling.​

Sokatoa helps fill this gap. It is a GPU software profiler that gives real-time, detailed information about how graphics tasks are managed, as per Samsung’s announcement. The tool was developed by Samsung’s Austin Research and Development Center (SARC) and Advanced Computing Lab (ACL), both teams that focus on GPU design and system architecture.

Why graphics debugging is getting harder

Mobile graphics have become much more complex in recent years. Games now use advanced lighting, high-resolution textures, and more complicated rendering methods. Even regular apps can have demanding visual effects or augmented reality features.

Samsung Sokatoa

Pipeline debugging view in Sokatoa

The problem is that many performance issues don’t show up in just one frame. Instead, they appear off and on over several frames, making them hard to spot with standard profiling tools.

Don’t want to miss the best from Android Authority?

google preferred source badge light@2xgoogle preferred source badge dark@2x

Sokatoa addresses this with its main feature: multi-frame GPU profiling. Rather than looking at one frame at a time, developers can review several frames of GPU activity together. This helps them spot patterns and find the exact moment when a rendering issue happens.

In practice, this means developers can find performance bottlenecks more quickly, whether they are caused by slow shaders, sudden GPU workload spikes, or differences between frames.

Tools designed for faster iteration

Another important feature is that developers can edit shaders and replay workloads right on the device. They can adjust graphics code, replay the rendering process, and see the results right away.

This makes the usual cycle of optimizing, testing, and repeating much faster for graphics engineers. Teams can quickly try out ideas and see how they affect performance, so they don’t have to rebuild the whole app to test small changes.

Sokatoa also offers detailed data visualizations and a modern interface, making it easier for developers to understand complex GPU metrics without getting overwhelmed by numbers.

Although the tool works best with Samsung’s Xclipse GPU, it is not limited to Samsung devices. Sokatoa also supports other major Android GPUs from companies like Qualcomm and ARM, according to Taekhyun Kim, vice president of GPU Software Development at SARC/ACL.

Samsung developed Sokatoa together with Google and LunarG, making sure it fits with modern Android graphics workflows like Vulkan. The company says Sokatoa is free to download and use, and it plans to make it open source later this year.

Thank you for being part of our community. Read our Comment Policy before posting.

Is Your PC Infected? Signs It’s Time to Call a Virus Removal Specialist


Your computer was working fine yesterday, and today it feels like it’s moving through wet cement. Web pages take forever to load, random pop-ups keep appearing out of nowhere, and your antivirus software is either throwing alerts or, worse, not opening at all. If any of that sounds familiar, you may be dealing with something more serious than a software glitch. At PC Geeks, we’ve helped thousands of frustrated users get their machines back to full health, and we know firsthand how quickly a virus or malware infection can go from a minor annoyance to a full-blown digital disaster.

The tricky part about malware is that it’s designed to hide. Modern viruses don’t always announce themselves with flashing warnings. Some quietly run in the background, stealing passwords, mining cryptocurrency using your hardware, or logging every keystroke you make. A 2023 report from Verizon found that over 74% of data breaches involved a human element, and many of those started with a single infected device. That’s not meant to scare you, but it is a good reason to take strange computer behavior seriously rather than hoping it resolves itself.

PC

When Something Feels “Off” But You Can’t Pinpoint It

Computers communicate distress in subtle ways. If your machine is running noticeably slower than usual, your browser homepage changed without your permission, or you’re seeing advertisements on websites that never had them before, those are classic signs of an infection. A sudden spike in your internet data usage or a fan that runs constantly even during light tasks can also point to a hidden process running without your knowledge. These symptoms don’t always mean catastrophe, but they do mean something is worth investigating by someone who knows what to look for.

When Antivirus Software Isn’t Enough

Off-the-shelf antivirus programs are a solid first line of defense, but they have real limitations. Some forms of malware are specifically coded to disable or bypass consumer antivirus tools. Rootkits, for instance, embed themselves so deeply in your operating system that they can become nearly invisible to standard scanning software. If you’ve run a full scan and the problems persist, or if your security software won’t run at all, that’s a strong signal that what you’re dealing with requires more than a free tool and a YouTube tutorial. A trained specialist has access to enterprise-grade diagnostic tools and the hands-on experience to recognize what automated software can miss.

When Personal or Financial Information May Be at Risk

This is the moment most people underestimate. If your computer has been acting strangely and you’ve recently logged into your bank account, entered a credit card number, or accessed work-related files, you need to treat the situation as urgent. Some malware variants are built entirely around data theft, and every minute your device stays infected is another minute that information is potentially being transmitted somewhere it shouldn’t be. A virus removal specialist won’t just clean the infection. They’ll also help you understand what may have been exposed and what steps you should take next.

When a Fresh Start Might Be Necessary

Sometimes, an infection has gone far enough that a simple removal isn’t enough to guarantee your system is truly clean. A professional can assess whether your operating system has been compromised at its core and whether a complete reinstall is the smarter path forward. This might sound drastic, but done correctly by someone who knows how to back up what matters and restore your settings, it’s often faster and more reliable than attempting to patch a deeply infected machine piece by piece.

Trusting the Right People With Your Technology

There’s no shame in reaching out for help. Cybercriminals are sophisticated, and the tools they use evolve constantly. Knowing when to call in a specialist isn’t a sign of defeat. It’s a smart decision that protects your data, your finances, and your peace of mind. The PC Geeks team approaches every PC with the same care they’d give their own, combining technical expertise with a genuine commitment to getting you back up and running as quickly as possible.

If your computer is showing any of the warning signs above, don’t wait and hope the problem disappears. Contact PC Geeks today for a professional diagnosis and get the expert help your device deserves.

Into the Omniverse: How Industrial AI and Digital Twins Accelerate Design


Editor’s note: This post is part of Into the Omniverse, a series focused on how developers, 3D practitioners and enterprises can transform their workflows using the latest advancements in OpenUSD and NVIDIA Omniverse.

Industrial AI, digital twins, AI physics and accelerated AI infrastructure are empowering companies across industries to accelerate and scale the design, simulation and optimization of products, processes and facilities before building in the real world.

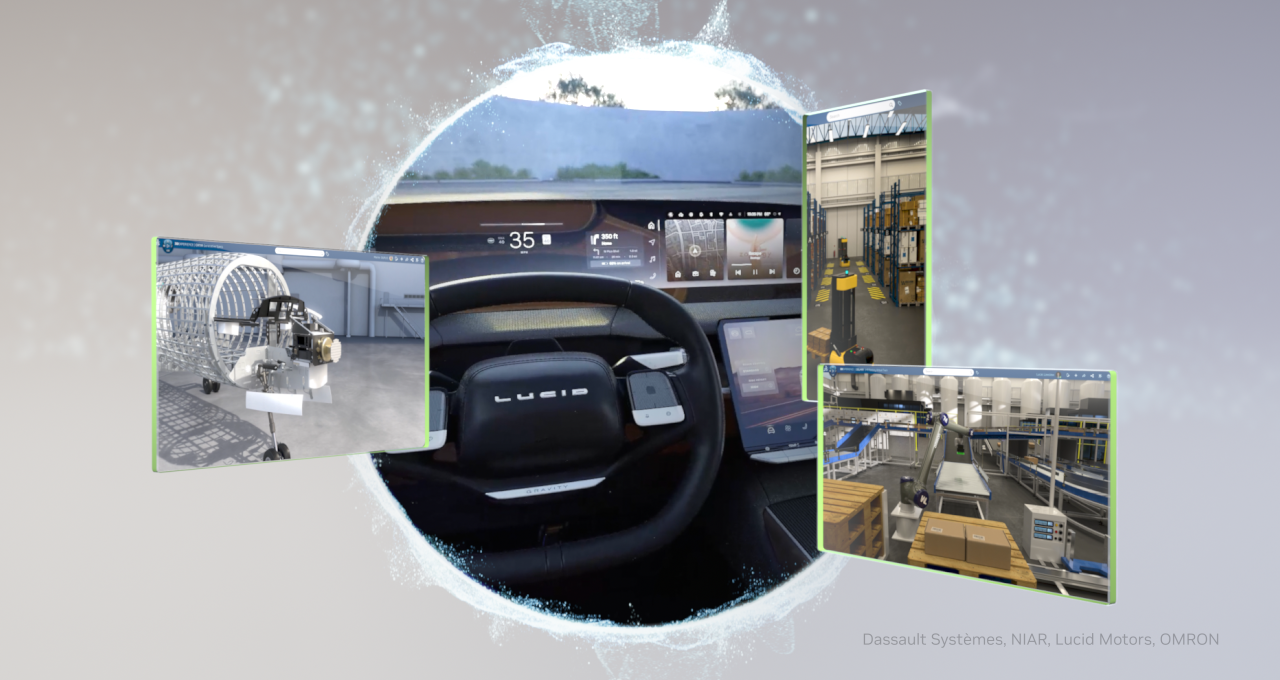
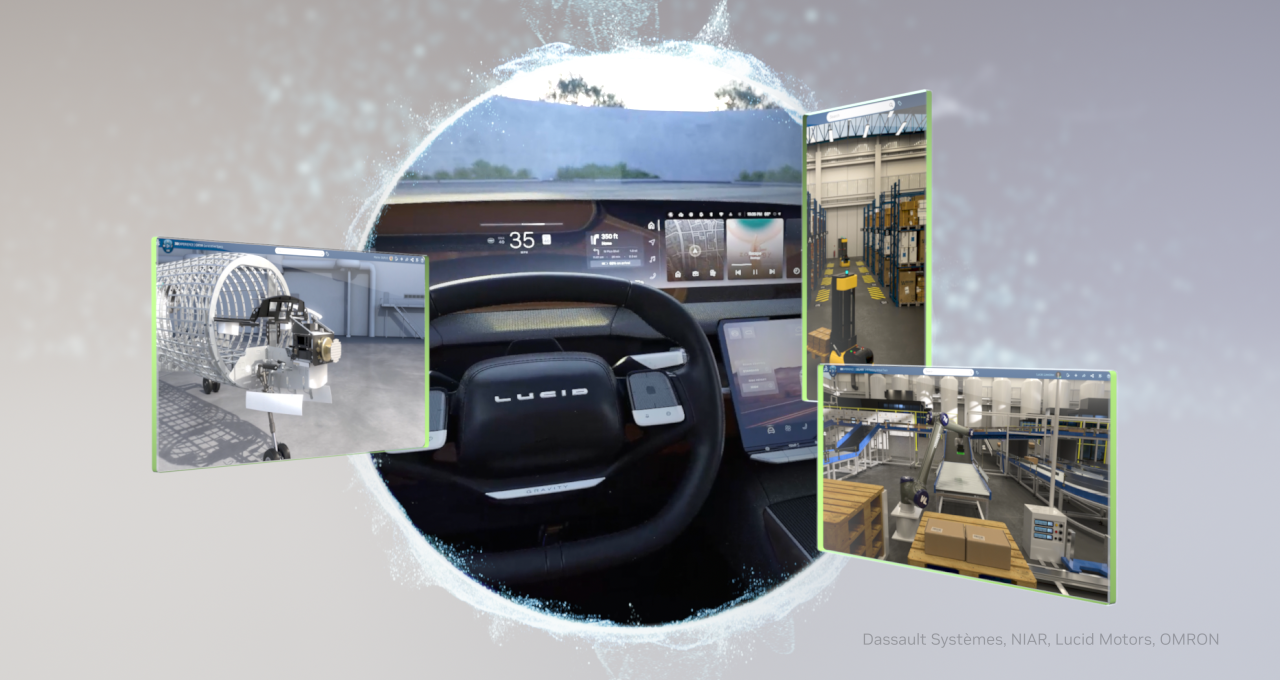
Earlier this month, NVIDIA and Dassault Systèmes announced a partnership that brings together Dassault Systèmes’ Virtual Twin platforms, NVIDIA accelerated computing, AI physics open models and NVIDIA CUDA-X and Omniverse libraries. This allows designers and engineers to use virtual twins and companions — trained on physics-based world models — to innovate faster, boost efficiency and deliver sustainable products.

Dassault Systèmes’ SIMULIA software now uses NVIDIA CUDA-X and AI physics libraries for AI-based virtual twin physics behavior — empowering designers and engineers to accurately and instantly predict outcomes in simulation.

NVIDIA is adopting Dassault Systèmes’ model-based systems engineering technologies to accelerate the design and global deployment of gigawatt-scale AI factories that are powering industrial and physical AI across industries. Dassault Systèmes will in turn deploy NVIDIA-powered AI factories on three continents through its OUTSCALE sovereign cloud, enabling its customers to run AI workloads while maintaining data residency and security requirements.

These efforts are already making a splash across industries, accelerating industrial development and production processes.

Industrial AI Simulations, From Car Parts to Cheese Proteins 

Digital twins, also known as virtual twins, and physics-based world models are already being deployed to advance industries.

In automotive, Lucid Motors is combining cutting-edge simulation, AI physics open models, Dassault Systèmes’ tools for vehicle and powertrain engineering and digital twin technology to accelerate innovation in electric vehicles. 

In life sciences, scientists and researchers are using virtual twins, Dassault Systèmes’ science-validated world models and the NVIDIA BioNeMo platform to speed molecule and materials discovery, therapeutics design and sustainable food development.

The Bel Group is using technologies from Dassault Systèmes’ supported by NVIDIA to accelerate the development and production of healthier, more sustainable foods for millions of consumers. 

The company is using Dassault Systèmes’ industry world models to generate and study food proteins, creating non-dairy protein options that pair with its well-known cheeses, including Baybel®. Using accurate, high-resolution virtual twins allows the Bel Group to study and develop validated research outcomes of food proteins more quickly and efficiently.

Using accurate, high-resolution virtual twins allows the Bel Group to study and develop validated research outcomes of food proteins more quickly and efficiently.

In industrial automation, Omron is using virtual twins and physical AI to design and deploy automation technology with greater confidence — advancing the shift toward digitally validated production. 

In the aerospace industry, researchers and engineers at Wichita State University’s National Institute for Aviation Research use virtual twins and AI companions powered by Dassault Systèmes’ Industry World Models and NVIDIA Nemotron open models to accelerate the design, testing and certification of aircrafts.

Learning From and Simulating the Real World 

Dassault Systemes’ physics-based Industry World Models are trained to have PhD-level knowledge in fields like biology, physics and material sciences. This allows them to accurately simulate real-world environments and scenarios so teams can test industrial operations end to end — from supply chains to store shelves — before deploying changes in the real world. 

These virtual models can help researchers and developers with workflows ranging from DNA sequencing to strengthening manufactured materials for vehicles. 

“Knowledge is encoded in the living world,” said Pascal Daloz, CEO of Dassault Systemes, during his 3DEXPERIENCE World keynote. “With our virtual twins, we are learning from life and are also understanding it in order to replicate it and scale it.” 

Get Plugged In to Industrial AI

Learn more about industrial and physical AI by registering for NVIDIA GTC, running March 16-19 in San Jose, kicking off with NVIDIA founder and CEO Jensen Huang’s keynote address on Monday, March 16, at 11 a.m. PT. 

At the conference:

  • Explore an industrial AI agenda packed with hands-on sessions, customer stories and live demos. 
  • Dive into the world of OpenUSD with a special session focused on OpenUSD for physical AI simulation, as well as a full agenda of hands-on OpenUSD learning sessions. 
  • Find Dassault Systèmes in the industrial AI and robotics pavilion on the show floor and learn from Florence Hu-Aubigny, executive vice president of R&D at Dassault Systemes, who’ll present on how virtual twins are shaping the next industrial revolution.
  • Get a live look at GTC with our developer community livestream on March 18, where participants can ask questions, request deep dives and talk directly with NVIDIA engineers in the chat.

Learn how to build industrial and physical AI applications by attending these sessions at GTC.

Motorola Razr 2026 leak shows the same old design with some heavy-duty internals


What you need to know

  • A regulatory listing suggests Motorola’s Razr 2026 keeps last year’s design but adds a fresh purple finish called Pantone African Violet.
  • The clamshell shape, hinge, and external display look almost identical to the previous model.
  • Configurations could reach 18GB RAM and 1TB storage, a huge jump from earlier Razr models.

A new leak suggests the next flip phone from Motorola won’t look dramatically different, but it could include some significant upgrades.

The upcoming Motorola Razr (2026) has surfaced in a regulatory filing, offering an early look at its design, colors, and key hardware changes (via Android Authority). Images from the Telecommunication Equipment Certification Center’s website show a flip phone that looks almost identical to the Razr 2025. The overall clamshell shape, hinge layout, and smaller external display remain largely unchanged from the previous generation.

Google is using old news reports and AI to predict flash floods


Flash floods are among the deadliest weather events in the world, killing more than 5,000 people each year. They’re also among the most difficult to predict. But Google thinks it has cracked that problem in an unlikely way — by reading the news.

While humans have assembled a lot of weather data, flash floods are too short-lived and localized to be measured comprehensively, the way the temperature or even river flows are monitored over time. That data gap means that deep learning models, which are increasingly capable of forecasting the weather, aren’t able to predict flash floods.

To solve that problem, Google researchers used Gemini — Google’s large language model — to sort through 5 million news articles from around the world, isolating reports of 2.6 million different floods, and turning those reports into a geo-tagged time series dubbed “Groundsource.” It’s the first time that the company has used language models for this kind of work, according to Gila Loike, a Google Research product manager. The research and data set was shared publicly Thursday morning.

With Groundsource as a real-world baseline, the researchers trained a model built on a Long Short-Term Memory (LSTM) neural network to ingest weather global forecasts and generate the probability of flash floods in a given area.

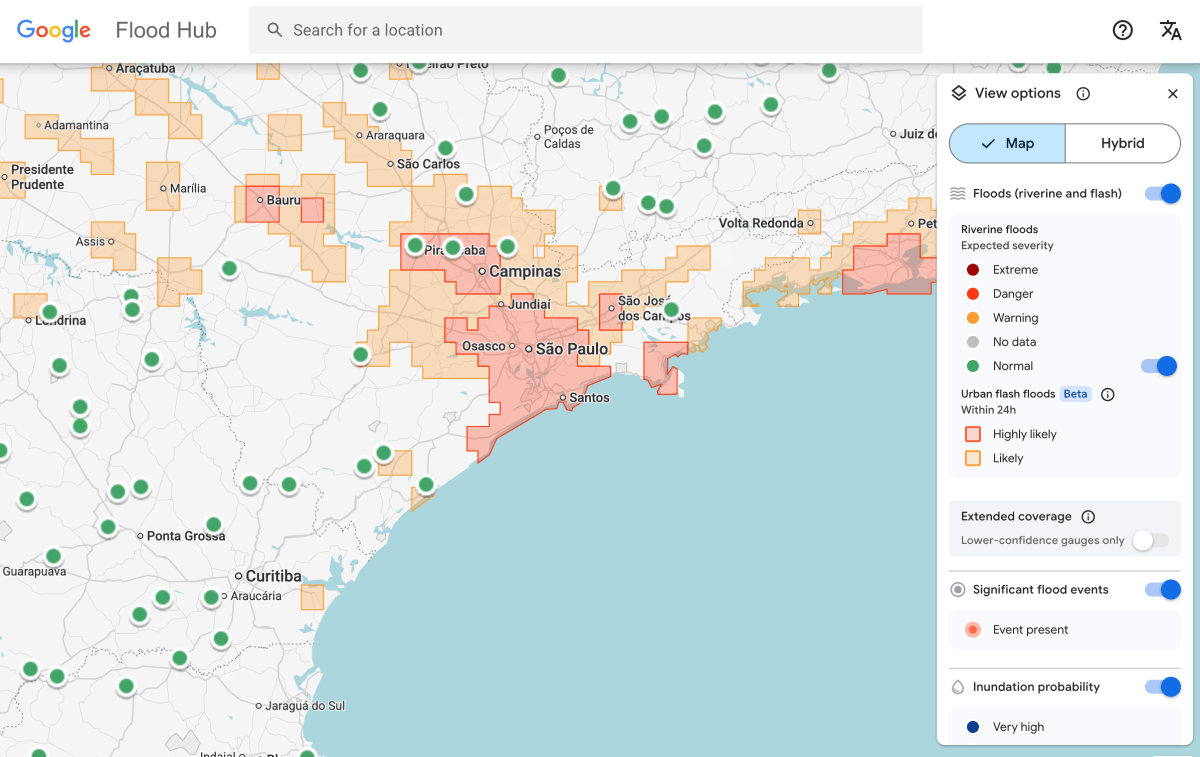
Google’s flash flood forecasting model is now highlighting risks for urban areas in 150 countries on the company’s Flood Hub platform, and sharing its data with emergency response agencies around the world. António José Beleza, an emergency response official at the Southern African Development Community who trialed the forecasting model with Google, said it helped his organization respond to floods more quickly.

There are still limitations to the model. For one, it is fairly low resolution, identifying risk across 20-square-kilometer areas. And it is not as precise as the US National Weather Service’s flood alert system, in part because Google’s model doesn’t incorporate local radar data, which enables real-time tracking of precipitation.

Part of the point, though, is that the project was designed to work in places where local governments can’t afford to invest in expensive weather-sensing infrastructure or don’t have extensive records of meteorological data.

Techcrunch event

San Francisco, CA
|
October 13-15, 2026

“Because we’re aggregating millions of reports, the Groundsource data set actually helps rebalance the map,” Juliet Rothenberg, a program manager on Google’s Resilience team, told reporters this week. “It enables us to extrapolate to other regions where there isn’t as much information.”

Rothenberg said the team hopes that using LLMs to develop quantitative data sets from written, qualitative sources could be applied to efforts to building data sets about other ephemeral-but-important-to-forecast phenomena, like heat waves and mud slides.

Marshall Moutenot, the CEO of Upstream Tech, a company that uses similar deep learning models to forecast river flows for customers like hydropower companies, said Google’s contribution is part of a growing effort to assemble data for deep learning-based weather forecasting models. Moutenot co-founded dynamical.org, a group curating a collection of machine learning-ready weather data for researchers and startups.

“Data scarcity is one of the most difficult challenges in geophysics,” Moutenot said. “Simultaneously, there’s too much Earth data, and then when you want to evaluate against truth, there’s not enough. This was a really creative approach to get that data.”

Crimson Butterfly REMAKE Free Download (Build 22266473)


FATAL FRAME II Crimson Butterfly REMAKE Preinstalled WorldofpcgamesFATAL FRAME II Crimson Butterfly REMAKE Preinstalled Worldofpcgames

FATAL FRAME II: Crimson Butterfly REMAKE Direct Download

This Japanese-style horror adventure game follows twin sisters who become lost in an abandoned village haunted by vengeful spirits. Using the Camera Obscura—a device that can capture and seal away the impossible—they fight ghosts as the story unfolds.
This title has undergone a complete overhaul, with improvements to everything from visuals and audio to the core gameplay systems and controls. The signature Camera Obscura mechanic, used to capture and fend off spirits, remains a key feature, now offering richer and more engaging gameplay in both exploration and combat. In addition, the new “Holding Hands with Mayu” mechanic adds a heartfelt touch, letting you experience the deep bond between the sisters like never before.

FATAL FRAME II: Crimson Butterfly Beautifully Remade

The graphics, sound, and controls have all been rebuilt from the ground up. Character textures, including skin and clothing, have been refined to the highest detail, and Minakami Village has been meticulously recreated with a focus on light and shadow, bringing its dark and ominous atmosphere to life with stunning realism. Monster Hunter Wilds
With 3D sound, you can feel the presence of spirits more vividly and closely. Immerse yourself in the chilling experience of exploring a haunted village.
Side stories and new areas have been added, offering players a deeper and more immersive experience in the world of FATAL FRAME II: Crimson Butterfly.

Enhanced Camera Obscura Battles

The iconic gameplay of repelling spirits using the Camera Obscura remains intact, while introducing new features such as Focus, Zoom, and Filter Switching.
Filters offer unique functionalities for both combat and exploration, allowing players to adapt to attacking spirits and uncover the mysteries of the cursed village.

Features and System Requirements:

  • Follow twin sisters Mio and Mayu as they become trapped in a mysterious abandoned village filled with restless spirits.
  • Use the supernatural Camera Obscura to capture and defeat ghosts that haunt the dark surroundings.
  • Experience a deeply atmospheric psychological horror story inspired by Japanese folklore and rituals.
  • Navigate eerie locations while solving puzzles and uncovering the tragic history of the cursed village.
  • Enhanced visuals and modern improvements bring the classic horror experience to a new generation.

Screenshots

System Requirements

Minimum
Requires a 64-bit processor and operating system
OS *: Windows 11, 64bit
Processor: Intel Core i5-8400, AMD Ryzen 5 3400G or higher
Memory: 16 GB RAM
Graphics: GeForce RTX 1050 Ti 4GB, Radeon R9 380X 4GB or higher
DirectX: Version 12
Storage: 30 GB available space
Support the game developers by purchasing the game on Steam

Installation Guide

Turn Off Your Antivirus Before Installing Any Game

1 :: Download Game
2 :: Extract Game
3 :: Launch The Game
4 :: Have Fun 🙂

Dawn of War 4 playtesters want the combat to take longer because of how much they enjoy watching it


Warhammer 40,000: Dawn of War 4 Story Trailer – PC Gaming Show: Most Wanted 2025 – YouTube
Warhammer 40,000: Dawn of War 4 Story Trailer - PC Gaming Show: Most Wanted 2025 - YouTube


Watch On

Earlier this year, Dawn of War 4 developer King Art Games showed off its combat director, which synchronizes melee animations to go a step beyond the already impressive sync-kills that were a trademark of the original Dawn of War. As senior game designer Elliott Verbiest explained on the latest episode of Deep Strike, an interview series on Warhammer TV, they’re worth slowing down the game to watch.

Analyze, evaluate, and uncomplicate


freshworks logo

Analyze, evaluate, and
uncomplicate

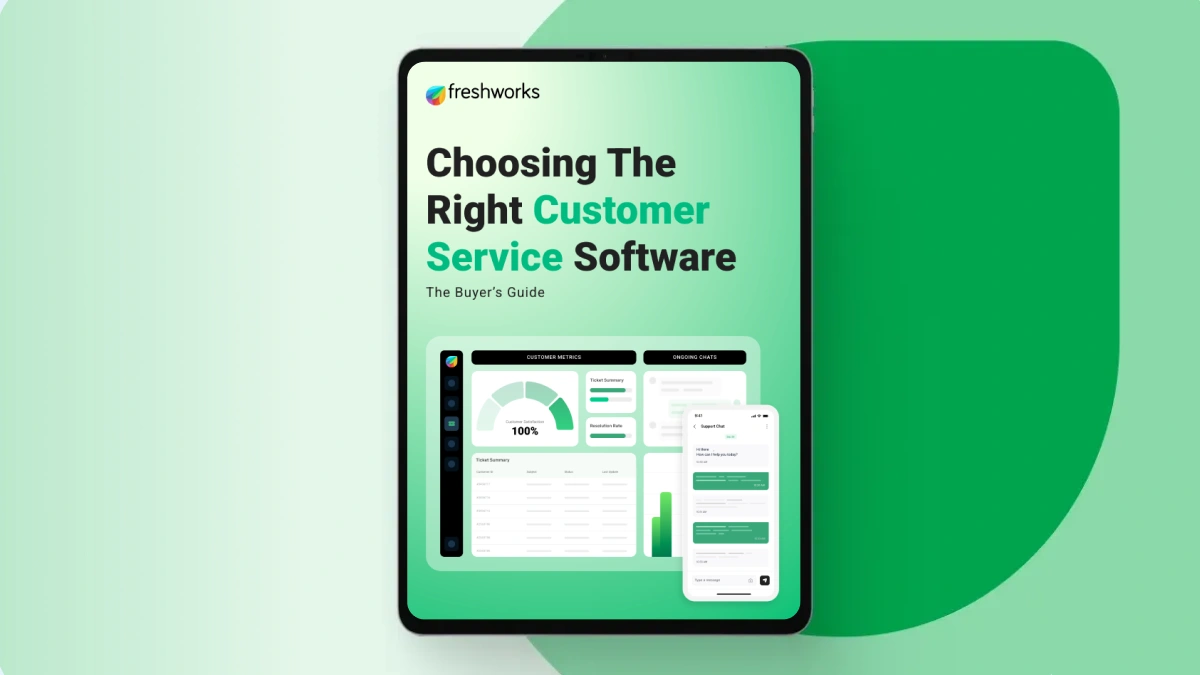
The Freshworks Buyer’s Guide 2026 enables CX leaders with practical frameworks, data, and insights to choose the customer service partner and solution for the customer of today.

Your guide to modern, uncomplicated customer service

The guide walks you through everything you need to know to evaluate, compare, and choose the right solution that meets customer expectations and prepares you to deliver excellent customer service.

  • A practical evaluation framework
    Learn how to audit your current setup, identify gaps, and map them to business outcomes.
  • Vendor comparison checklist
    A ready-to-use scorecard with 9 key dimensions, from omnichannel support to AI readiness and total cost of ownership.
  • Future-readiness markers
    Understand how the platform adapts as the business and the space change with speed, scale, and agent productivity.

Looking to make the right decision and scale your support operations?

Read the guide, which holds the necessary data, insights, and frameworks that help CX leaders make confident, future-ready decisions.

Download the Guide

Download the Guide

Error: Contact form not found.

fershworks

About Freshworks Inc.

Freshworks Inc. (NASDAQ: FRSH) creates AI-boosted business software anyone can use. Purpose-built for IT, customer support, and sales and marketing teams, our products are designed to let everyone work more efficiently and deliver more value for immediate business impact. Headquartered in San Mateo, California, Freshworks operates around the world to serve more than 67,000 customers, including American Express, Blue Nile, Bridgestone, Databricks, Fila, Klarna, and OfficeMax. For the freshest company news, visit www.freshworks.com and follow us on Facebook, LinkedIn, and X

The post Analyze, evaluate, and uncomplicate appeared first on Tech Research Online.